
Despite the tumultuous price swings in early August, which saw Bitcoin (BTC) plummet to $49K, the crypto market has shown resilience. This rebound has ignited renewed optimism among investors, suggesting a potential bullish trend. However, it’s important to note that August has historically been a challenging month for the crypto market. Check out the full analysis below.
As usual, the Pintu trading team has gathered critical information and analyzed the general economic situation and the crypto market’s movements over the past week. However, it should be noted that all information in this Market Analysis is intended for educational purposes, not as financial advice.
Market Analysis Summary
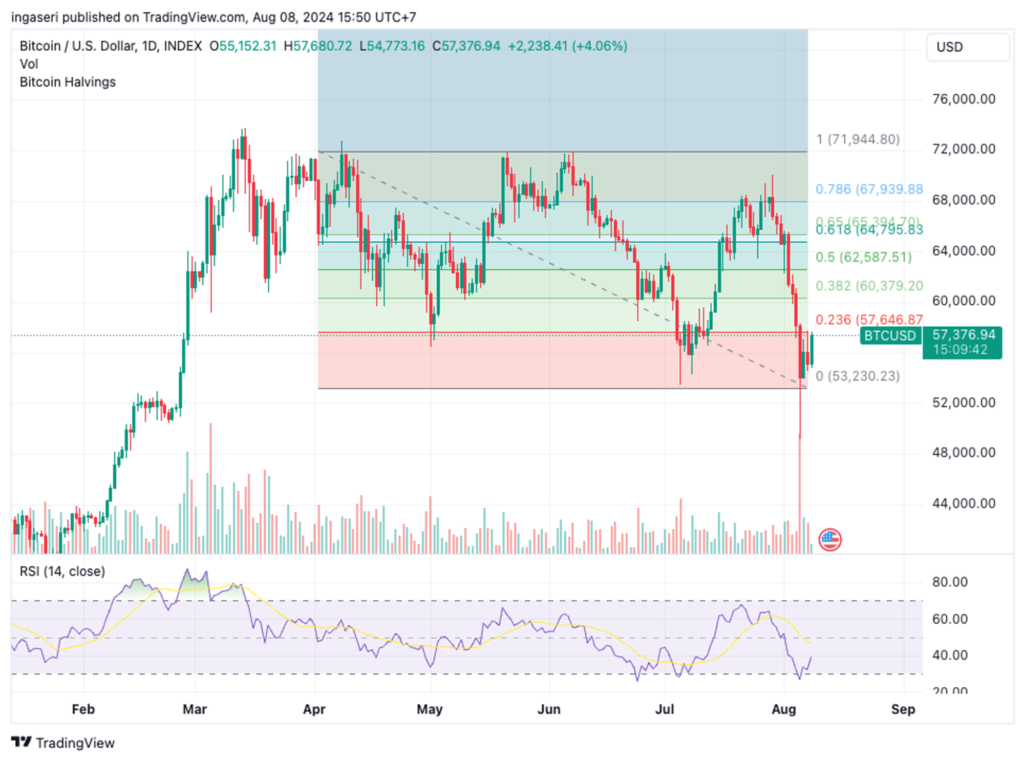
- 🟢 At the beginning of August, BTC prices began to plummet, dropping from a high of 70K on August 1st to 49K by August 5th—a 30% decrease in just five days.
- 📈 The U.S. unemployment rate surged to a nearly three-year high of 4.3% in July.
- 🏭 The Institute of Supply Management’s (ISM) services sector Purchasing Managers’ Index (PMI) rose to 51.4% in July, up from 48.8% the previous month.
- 📝 Meanwhile, the S&P Services PMI registered at 55.0, which was lower than expected but still indicated growth in the sector.
Macroeconomic Analysis
Unemployment rate
The U.S. unemployment rate surged to a nearly three-year high of 4.3% in July due to a significant hiring slowdown, raising concerns about labor market deterioration and the economy’s potential vulnerability to a recession.
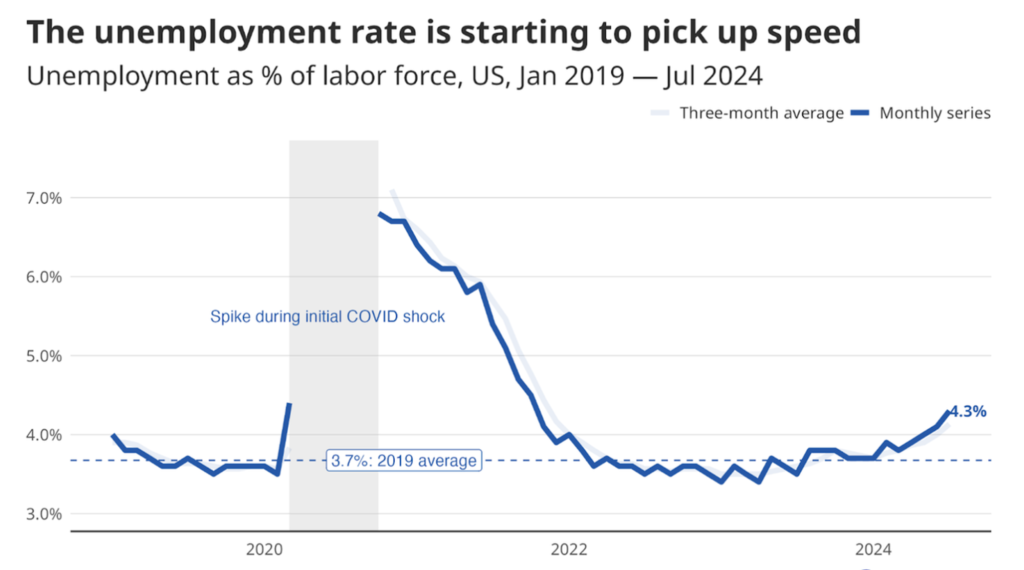
The Labor Department reported on Friday that the unemployment rate increased from 4.1% in June, marking the fourth consecutive monthly rise. This increase from a five-decade low of 3.4% in April 2023 to the highest level since September 2021 strongly suggests a September interest rate cut from the Fed. Economists are advocating for a 50 basis point reduction in borrowing costs, arguing that the U.S. central bank may be lagging in easing monetary policy.
The report contributes to the recent mixed signals regarding the economy, with financial markets anxious about the Fed’s potential response.
While markets initially responded positively on Wednesday to indications from the Fed that an interest rate cut could happen as early as September, the sentiment quickly shifted to concern following Thursday’s economic data, which revealed an unexpected rise in unemployment benefit filings and further weakening of the manufacturing sector.
This led to the worst sell-off of the year on Wall Street, reigniting fears that the Fed may be delaying interest rate cuts for too long. Slowing wage growth could, however, reassure policymakers that inflation is moving back toward their 2% target.
Other Economic Indicators
- Non-Farm Payroll: Job growth in the U.S. slowed significantly more than anticipated in July, and the unemployment rate increased, intensifying concerns about a broader economic downturn, the Labor Department reported on Friday. Nonfarm payrolls increased by only 114,000 for the month, down from a downwardly revised 179,000 in June and falling short of the Dow Jones estimate of 185,000.
- ISM Services Index: The Institute of Supply Management (ISM) services sector Purchasing Managers’ Index (PMI) for July came in at 51.4%, surpassing the 50.9% forecasted by economists. This represents a rebound from June’s decline, where the index was at 48.%. A reading above 50% indicates expansion in the services sector. While employment data in the ISM survey showed improvement, the gains in the labor market are concentrated in a few areas, with other segments still exhibiting signs of slowing.
- S&P Services Index: The S&P Global Services PMI index came in at 55.0, a decline from the previous month and below economists’ projections of 55.9. Similar to the ISM data, a reading above 50 indicates an improvement in economic activity within the services sector. Another strong expansion of business activity in the service sector, which over the past two months has enjoyed its best growth spell in over two years, contrasts with the deteriorating picture seen in the manufacturing sector.
BTC Price Analysis
At the beginning of August, BTC prices began to plummet, dropping from a high of 70K on August 1st to 49K by August 5th—a 30% decrease in just five days. Several factors contributed to this significant decline. One was the self-fulfilling prophecy that August tends to be a bearish month for both crypto and equities markets. Historically, August and September have been unfavorable months for these markets. Another factor was the rise of Democratic presidential candidate Kamala Harris in the polls against Trump, who is perceived as pro-crypto. The most impactful reason, however, was the unwinding of the Japanese Yen carry trade, which caused turmoil not only in the crypto market but also in the traditional equities market.
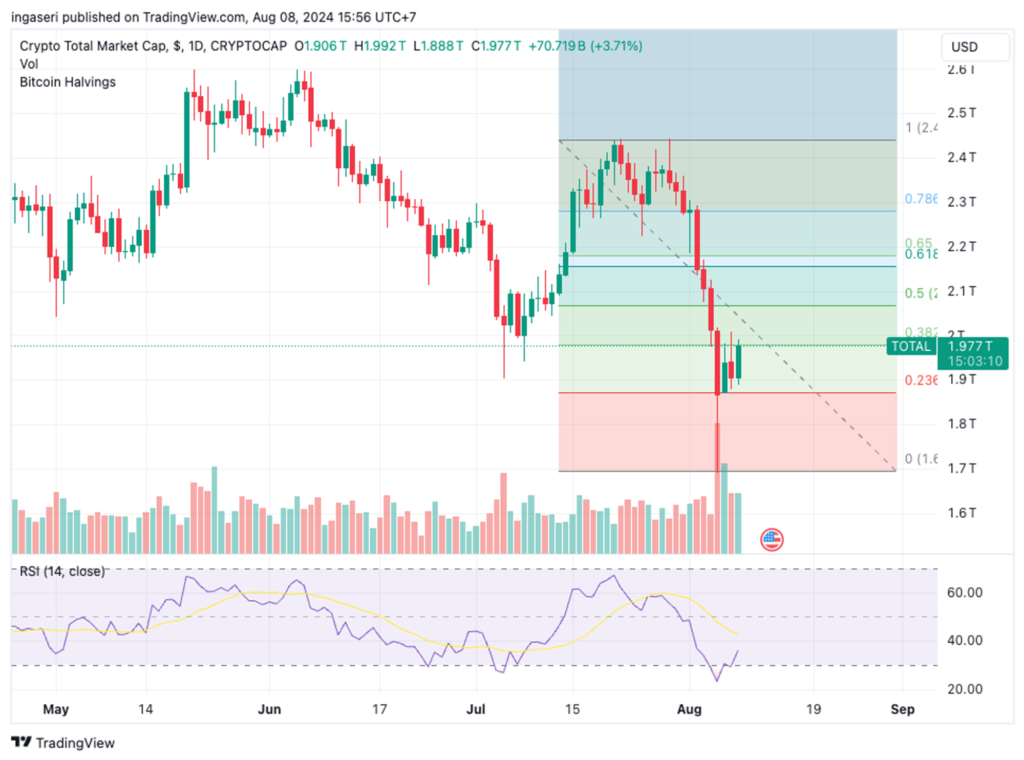
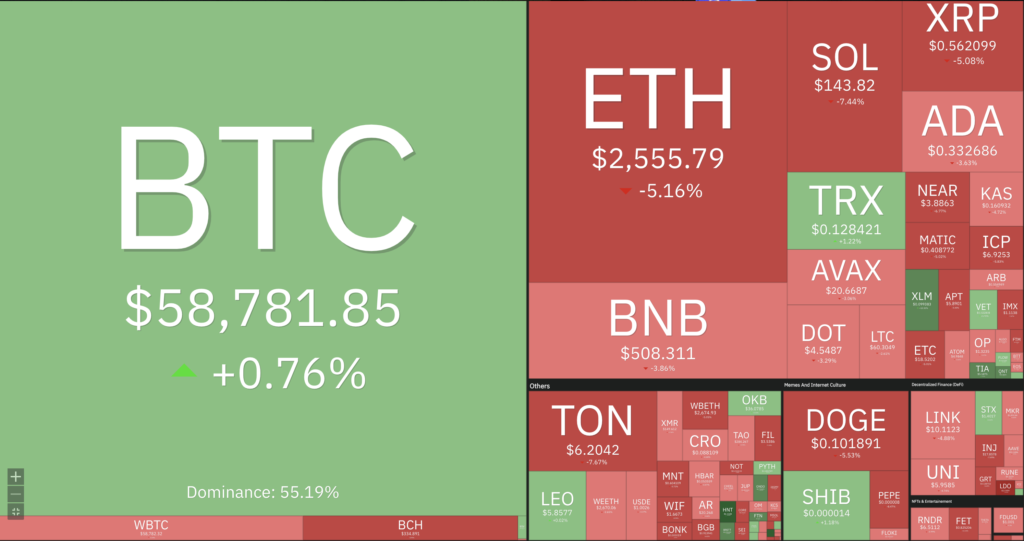
After the crash earlier this week, we can see towards the end of the week, the cryptocurrency market has experienced a resurgence in bullish sentiment, with the total crypto market cap increasing by 6%. Following a dramatic drop, BTC has rebounded to over $57K, bringing its market cap up to $1.1 trillion. In contrast, ETH saw only a modest increase of 0.3%, rising to around $2,500. Despite this small gain, ETH maintains an impressive market cap of $300 billion, highlighting the widespread attention and bullish momentum in the cryptocurrency market today.
On-Chain Analysis
- 📊 Exchange: As the exchange reserve continues to fall, it indicates lower selling pressure. Net deposits on exchanges are high compared to the 7-day average. Higher deposits can be interpreted as higher selling pressure.
- 💻 Miners: Miners’ are selling holdings in a moderate range compared to its one-year average. Miner’s revenue is in a moderate range, compared to its one-year average.
- 🔗 On-Chain: More investors are selling at a profit. In the middle of a bull market, it can indicate a market top. Long term holders’ movement in the last 7 days was lower than the average. They have a motive to hold their coins. Investors are in an anxiety phase where they are currently in a state of moderate unrealized profits.
- 🏦 Derivatives: Long-position traders are dominant and are willing to pay to short traders. Selling sentiment is dominant in the derivatives market. More sell orders are filled by takers. As open interest decreases, it indicates investors are closing futures positions and possibility of trend reversals. In turn, this might trigger the possibility of long/short-squeeze caused by sudden price movement or vice versa.
- 🔀 Technicals: RSI indicates a neutral condition. Stochastic indicates a neutral condition where the current price is in a moderate location between the highest-lowest range of the last 2 weeks.
News About Altcoins
- AI Predicts Stellar, EOS, and Cardano to Surge After Ripple Victory, as XRP ETF Hopes Rise. AI predicts a potential surge in certain coins following Ripple’s victory over the SEC and anticipation of an XRP ETF launch. The Ripple-SEC case has captivated crypto investors, and the recent win has fueled speculation about a spot XRP ETF coming to market within the next year. Additionally, artificial intelligence suggests that Stellar (XLM), EOS, and Cardano (ADA) could benefit from Ripple’s success.
News from the Crypto World in the Past Week
- Bitcoin ETF Options Trading Could Launch in Q3 2024. Bloomberg ETF analyst James Seyffart predicts that options will be added to spot Bitcoin ETFs in the US during the third quarter of 2024, ahead of the previously anticipated fourth quarter**.** Approval from the Securities and Exchange Commission (SEC), Comptroller of the Currency (OCC), and Commodity Futures Trading Commission (CFTC) is necessary before launch. While some smaller exchanges have withdrawn their applications, major platforms like NYSE, Nasdaq, and CBOE are still actively pursuing approval.
Cryptocurrencies Market Price Over the Past Week
Cryptocurrencies With the Best Performance
- Helium (HNT) +41,55%
- Sui (SUI) +36,88%
- Bittensor (TAO) +10,55%
- Toncoin (TON) +9,37%
Cryptocurrencies With the Worst Performance
- Lido DAO (LDO) -21,45%
- Artificial Superinteliigence Alliance (FET) -20,25%
- Aave (AAVE) -17,88%
- Maker (MKR) -17,51%
References
- Juhi Mirza, AI Predicts Top 3 Cryptocurrency to Buy if Ripple Wins SEC Case, Watcher.guru, accessed on 10 August 2024.
- Ana Zirojevic, Is an XRP ETF next after Ripple wins lawsuit?, Finbold, accessed on 10 August 2024.
- Gino Matos, Bitcoin ETF options likely to go live in Q4 – Bloomberg analyst, Cryptoslate, accessed on 10 August 2024.