After repeatedly breaking its all-time highs (ATH), Bitcoin (BTC) appears to be cooling down, correcting and stabilizing within the $118,000 to $120,000 range. However, BTC remains on a bullish track, supported by positive macroeconomic data and the potential for interest rate cuts. Read the full analysis from Pintu’s Trader Team in the article below.
Market Analysis Summary
- 🎯 Analysts project intermediate-term price targets as high as $135,000, driven by continued institutional adoption and BTC’s deflationary supply mechanics post the April 2024 halving.
- ✅ The headline Consumer Price Index (CPI) for June 2025 demonstrated continued disinflationary progress, largely aligning with market expectations.
- 🏭 The latest NY Empire State Manufacturing Index for July 2025 delivered a significant and unexpected positive surprise, indicating a robust rebound in manufacturing activity within New York State.
- 📉 The latest U.S. Producer Price Index (PPI) data for June 2025 indicates a significant cooling in inflationary pressures at the wholesale level.
Macroeconomic Analysis
Inflation Rate
The headline Consumer Price Index (CPI) for June 2025 demonstrated continued disinflationary progress, largely aligning with market expectations. The annual inflation rate (YoY) came in at 2.7%, exactly matching the consensus forecast and showing a modest acceleration from the previous month’s 2.4%. Month-over-month (MoM), the all-items CPI increased by 0.3%, also precisely meeting the consensus. These figures, along with the CPI seasonally adjusted (s.a.) reading of 321.5, indicate that while inflation is still above the Federal Reserve’s 2% target, it is moving in a controlled and predictable manner, suggesting that previous price surges are continuing to moderate.
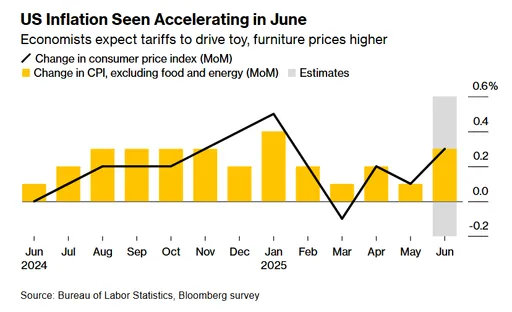
Even more encouraging was the performance of the core inflation rate, which excludes volatile food and energy prices. For June 2025, the core CPI increased by 2.9% year-over-year (YoY). This crucial metric came in below the consensus expectation of 3.0% and only slightly above the previous month’s 2.8%. On a month-over-month basis, core CPI rose by 0.2%, again coming in below the consensus of 0.3%. The slowdown in core inflation is particularly significant for the Federal Reserve, as it reflects the underlying and more persistent price trends in the economy, signaling that broader demand-driven pressures might be easing.
The positive surprise in the core inflation figures suggests that price pressures in key services sectors, such as housing and transportation, might be moderating more quickly than anticipated. While the specific components are not detailed in your image, the overall downward trajectory of core inflation points to a healthier trend.
For the Fed, these results provide significant comfort and flexibility. The fact that both headline and core inflation either met or came in below consensus expectations, alongside a core rate nearing the 2% target, strengthens the case for potential interest rate cuts later in the year. It suggests that the Fed’s past tightening measures are having the desired effect on inflation without triggering a significant economic downturn, bolstering the “soft landing” narrative.
In the broader economy and financial markets, this CPI report is likely to be met with optimism. Market reactions would likely include a strengthening of U.S. Treasury bonds (yields moving lower) as the likelihood of Fed rate cuts increases, and a positive boost to equity markets, especially growth stocks, which benefit from lower interest rates.
Other Economic Indicators
- NY Empire State Manufacturing Index: The index soared to 5.5 for July, dramatically exceeding both the previous month’s reading of -16 and the consensus forecast of -9. This jump signals a decisive shift from a state of contraction into solid expansion, providing an encouraging signal for the regional manufacturing sector.
- PPI: The latest U.S. Producer Price Index (PPI) data for June 2025, released on July 16, 2025, indicates a significant cooling in inflationary pressures at the wholesale level. The Producer Price Index for final demand came in flat, with a 0.0% month-over-month (MoM) change. This result was notably lower than both the consensus forecast of 0.2% and the upwardly revised 0.3% increase seen in May. This stagnation in producer prices suggests that the upward pressure on costs for businesses has largely abated for the month, providing a welcome signal for disinflation.
BTC Price Analysis
Over the past week, BTC has experienced notable price volatility, reflecting its characteristic market behavior. As of July 17, 2025, the latest data indicates BTC’s price is approximately $118,621.10 USD, with a 24-hour trading volume of over $71.4 billion USD. The price has seen a 7% increase from $111,105.41 a week ago, though it remains about 4% below its all-time high of $122,979.87, reached on July 14, 2025. Earlier in the week, BTC surged to above $123,000, driven by strong institutional demand and optimism surrounding potential U.S. legislative developments in cryptocurrency regulation. However, a subsequent 4.9% dip to around $116,658 was observed, described by analysts as a “standard pullback” following the rapid price increase, with the market later stabilizing around $118,000 to $120,000 by mid-week.
The rally earlier in the week was fueled by several key factors. Spot BTC ETF recorded significant inflows, with $1.69 billion reported as of July 16, 2025, led by major players like BlackRock. This institutional interest, combined with a 12.1% rise in global M2 money supply, has bolstered BTC’s appeal as a hedge against inflation. Additionally, corporate adoption has accelerated, with companies like Smarter Web Company acquiring 1,600 BTC, entering the top 25 public treasuries. The market sentiment remains bullish, supported by technical indicators such as BTC trading above its 50-day and 200-day moving averages, which are rising and acting as potential support levels. However, the 14-day RSI at 74.65 suggests overbought conditions, hinting at a possible short-term correction.
Despite the bullish momentum, there are signs of caution. BTC exchange netflows spiked after the $123,000 high, suggesting profit-taking by some investors, which could signal a local top.
BTC Technical Analysis
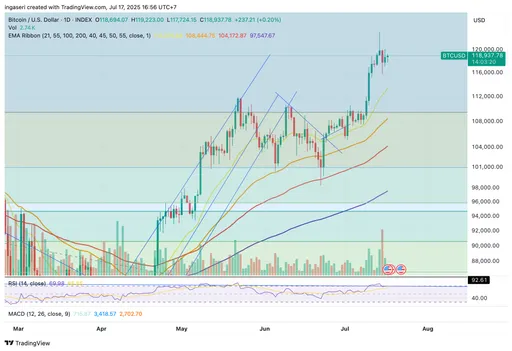
Technical analysis shows BTC in a rising trend channel, with no immediate resistance above current levels but support around $105,000 to $110,000 if a downturn occurs. The market’s reaction to macroeconomic factors, such as potential U.S. Federal Reserve actions and regulatory developments, continues to play a significant role. For instance, optimism over Congress addressing crypto regulations this week has supported price gains, but any adverse policy shifts could introduce volatility.
Looking at the broader context, BTC’s 64% dominance in the crypto market and a market capitalization of $2.35 trillion underscore its position as the leading cryptocurrency. The past week’s trading volume averaged $77.88 billion daily, reflecting high market activity, though slightly lower than the 30-day average. Analysts project intermediate-term price targets as high as $135,000, driven by continued institutional adoption and BTC’s deflationary supply mechanics post the April 2024 halving, which reduced mining rewards to 3.125 BTC per block. However, the market remains highly volatile, and investors are advised to monitor support levels and regulatory news closely for potential price swings.
Altcoin Analysis
Over the past week, the broader cryptocurrency market, has shown significant strength and momentum, with altcoins collectively outperforming BTC in several key metrics. The total cryptocurrency market capitalization, as reported by Coinbase, reached $3.68 trillion, reflecting a 9.52% increase week-over-week, with altcoins contributing significantly to this growth. BTC’s dominance, a measure of its share of the total market cap, slightly declined by 0.64% to 62.33%, signaling capital rotation into altcoins, often a precursor to an “altseason.” Altcoin volumes and market sentiment are turning bullish, with decentralized finance (DeFi) total value locked (TVL) surging past $117 billion. Top performers included Ethereum (ETH), XRP, Cardano (ADA), and Solana (SOL), with weekly gains ranging from 3% to over 20% for some assets, driven by regulatory optimism and institutional interest.
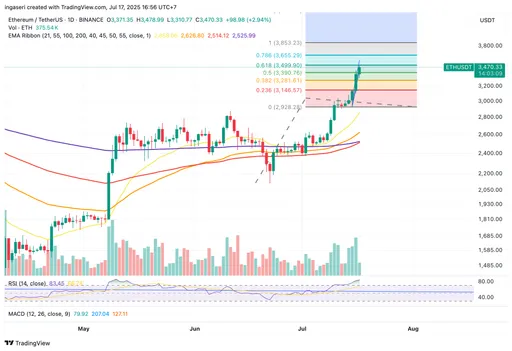
Ethereum, the second-largest cryptocurrency by market cap at $415.31 billion, led the altcoin rally with a 6.45% price increase over the week, reaching above $3,200 for the first time since February 2025. This surge was propelled by record-breaking ETH ETF inflows, with $727 million in a single day, and heightened activity in DeFi protocols like AAVE, which saw yields climb to 15%. The ETH/BTC pair also strengthened, showing bullish divergences, as noted on X, indicating growing investor confidence in Ethereum’s ecosystem. Other altcoins, such as XRP (+6.08%) and Cardano (+3.82%), also posted strong gains, with XRP climbing as much as 6.4% in a single day and Cardano benefiting from regulatory progress and its proof-of-stake platform’s appeal. Solana, another standout, saw a 3.05% increase, fueled by a memecoin explosion on its blockchain, with tokens like Bonk achieving a 20% rally the previous week.
The altcoin market’s performance was further supported by sector-specific developments. According to CoinMetrics, intermediated finance (+9.6%), specialized coins (+8.2%), and DeFi (+6.3%) led sector performance, reflecting growing interest in diverse use cases like tokenized securities and smart contract platforms. On-chain activity was mixed but showed notable increases for certain assets, such as CRO (+129.33%), BCH) (+41.16%), and XRP (+12.44%), indicating robust network usage. The launch of innovative projects, such as Bitlayer’s BitVM Bridge for BTC DeFi and Phantom’s Hyperliquid integration for alternative perpetual futures protocols, further boosted altcoin sentiment. However, some assets like LINK and LTC saw declines in on-chain activity, with LINK down 15.55% and LTC down 4.27%, suggesting uneven performance across the altcoin spectrum.
Despite the bullish momentum, risks remain in the altcoin market. The high volatility of cryptocurrencies, as noted by Forbes, makes altcoins particularly sensitive to external factors like regulatory changes or macroeconomic shifts, such as U.S. tariff policies, which briefly impacted markets earlier in 2025. The memecoin frenzy, particularly on Solana and Base, with tokens like Fartcoin crossing $1 billion in market cap, raises concerns about speculative bubbles. Additionally, while regulatory progress, such as the U.S. House debating crypto-related bills like the Genius Act and Clarity Act, has fueled optimism, uncertainty around global regulations persists, as highlighted by Fortune Business Insights. Investors are cautioned to monitor on-chain data and market sentiment closely, as rapid capital rotations and profit-taking could lead to sharp corrections, especially in smaller-cap altcoins.
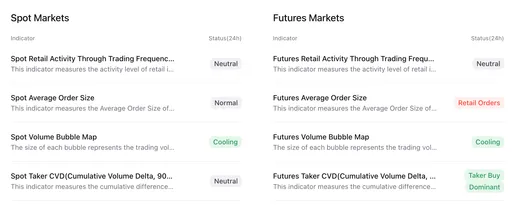
On-Chain Analysis
News About Altcoins
- XRP Eyes $20 as Analysts Predict Explosive Rally Triggered by Dominance Breakout. XRP has surged to a new high of $3.66, up nearly 90% since April, yet analysts believe its parabolic rally has just begun. Key indicators like XRP Dominance and XRP/BTC suggest a major breakout is imminent, with historical patterns hinting at a price range of $7–$10 upon resistance breakouts. A potential move above XRP’s all-time high of $3.84 could trigger a bull pennant breakout, with analysts setting long-term targets as high as $20 by the end of this cycle, based on bullish technical setups.
News from the Crypto World in the Past Week
- Bitcoin Could Hit $150,000 by October Amid ETF Inflows and Economic Uncertainty. Bitcoin could reach $150,000 by early October, according to Cooper Research, driven by strong inflows into U.S. spot Bitcoin ETFs and growing investor interest amid economic uncertainty and delayed interest rate cuts by the Federal Reserve. The firm sees Bitcoin’s rally as “inevitable,” although a potential market overheating is anticipated in the $140,000–$200,000 range. While Bitcoin dominance is slightly weakening with rising altcoins, experts argue a trend reversal is still needed for altseason to begin.
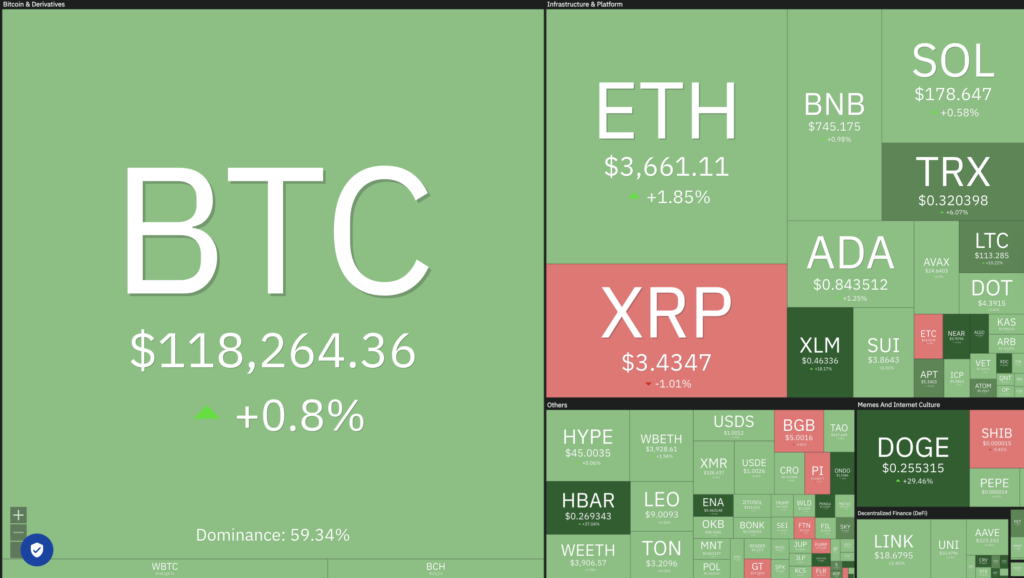
Cryptocurrencies Market Price Over the Past Week
Cryptocurrencies With the Best Performance
- Tezos (XTZ) +74.78%
- Curve DAO Token (CRV) +61.96%
- FLOKI (FLOKI) +43.53%
- Ethena (ENA) +41.74%
Cryptocurrencies With the Worst Performance
- Hyperliquid (HYPE) -5.62%
- Monero (XMR) -1.80%
- UNUS SED LEO (LEO) -0.88%
- Tether Gold (XAUt) -0.01%
References
- Liz Napolitano, Bitcoin Price Poised to Rally to $150K by October, Says Cooper Research, decrypt, accessed on 20 July 2025.
- Nancy Lubabe, Can XRP price reach $20? These charts say ‘full bull’ phase is still ahead, cointelegraph, accessed on 20 July 2025.
