The crypto market showed slight volatility following the August 1, 2025, deadline for tariff negotiations set by U.S. President Donald Trump. Adding to the pressure was his statement suggesting that military action against Iran remains on the table. Despite these geopolitical tensions, analysts view the crypto market as relatively resilient. Read the full analysis from Pintu’s Trader Team in the article below.
Market Analysis Summary
- 🎯 Analysts predict BTC is still in a bullish trend and could reach $140,000 by the end of the month. Meanwhile, ETH needs to break the short-term resistance around $3,917, and if it surpasses this level, it could potentially reach $4,000 and even $4,800 in the near future.
- 📉 The latest data for June 2025 shows that U.S. durable goods orders fell sharply by 9.3% month-over-month, reversing the previous month’s corrected jump of 16.5% in May.
- 🔻 The latest data for June 2025 shows that the United States goods trade balance reported a deficit of about $85.99 billion.
- 💼 The latest June 2025 Job Openings and Labor Turnover Survey (JOLTS) data from the U.S. Bureau of Labor Statistics shows that job openings decreased to about 7.43 million, down from a revised 7.71 million in May.
- 🔺 The latest ADP employment change report for July 2025 showed a significant rebound in U.S. private sector hiring, with the addition of 104,000 jobs.
- 📈 The latest data for the U.S. GDP growth rate shows that real gross domestic product (GDP) increased at an annualized rate of 3.0% in the second quarter (Q2) of 2025, covering the months of April, May, and June.
Macroeconomic Analysis
Durable Goods
The latest data for June 2025 shows that U.S. durable goods orders fell sharply by 9.3% month-over-month, reversing the previous month’s corrected jump of 16.5% in May. This decline is the largest monthly drop since the initial April 2020 COVID-19 shock and brought durable goods orders down to $311.84 billion in June.
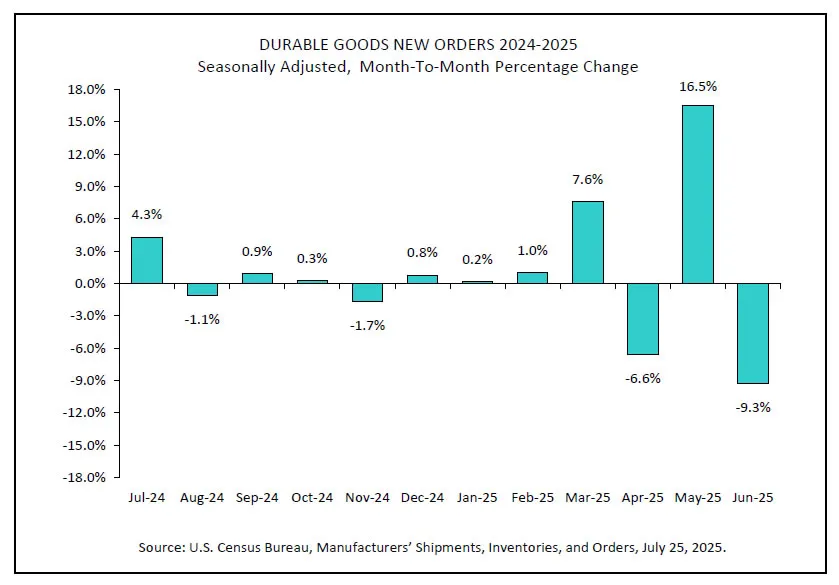
This pronounced decrease reflects weakening demand for long-lasting manufactured goods which are critical indicators of business investment and economic activity. The previous surge was attributed to temporary factors, so the June pullback suggests some volatility and caution among manufacturers and buyers amid uncertainties, including ongoing tariff concerns affecting supply chains and costs.
Despite the steep decline, core durable goods orders—which exclude transportation items like aircraft and are viewed as a more stable gauge of business spending on equipment—showed more resilience and only a modest decrease. This indicates that while headline orders fell considerably, underlying capital investment intentions might still be relatively steady.
Other Economic Indicators
- Goods Trade Balance: The latest data for June 2025 shows that the United States goods trade balance reported a deficit of about $85.99 billion, which is an improvement compared to a larger deficit of around $96.42 billion in May 2025
- JOLTs Job Openings: The latest June 2025 Job Openings and Labor Turnover Survey (JOLTS) data from the U.S. Bureau of Labor Statistics shows that job openings decreased to about 7.43 million, down from a revised 7.71 million in May. This decline of approximately 275,000 openings was slightly below market expectations, which forecasted 7.55 million openings.
- ADP Employment Change: The latest ADP employment change report for July 2025 showed a significant rebound in U.S. private sector hiring, with the addition of 104,000 jobs. This follows a decline in June when revised figures showed a loss of 23,000 jobs, highlighting a renewed momentum in the labor market.
- Growth Rate: The latest data for the U.S. GDP growth rate shows that real gross domestic product (GDP) increased at an annualized rate of 3.0% in the second quarter (Q2) of 2025, covering the months of April, May, and June
BTC Price Analysis
Over the past week, BTC has experienced a relatively stable trend with a slight decline:
- The highest recorded price was around $119,418 on July 28, 2025.
- Meanwhile, on July 30, the price stood at around $117,853, marking a slight decrease of about 0.13% from the previous day.
- Continuing on August 3, BTC dropped back to the $112,000 range.
- However, overall, this period reflects a phase of consolidation after BTC reached new highs earlier in the year.
After BTC’s price dropped below the crucial consolidation range of $116,000 and touched the $112,000 level, this indicates potential further decline if the price closes significantly below this level. This consolidation range had held for more than ten days before the recent drop, and a break below it could indicate short-term bearish pressure. Investors and market observers are closely monitoring this support level to assess the next movement direction.
BTC Technical Analysis
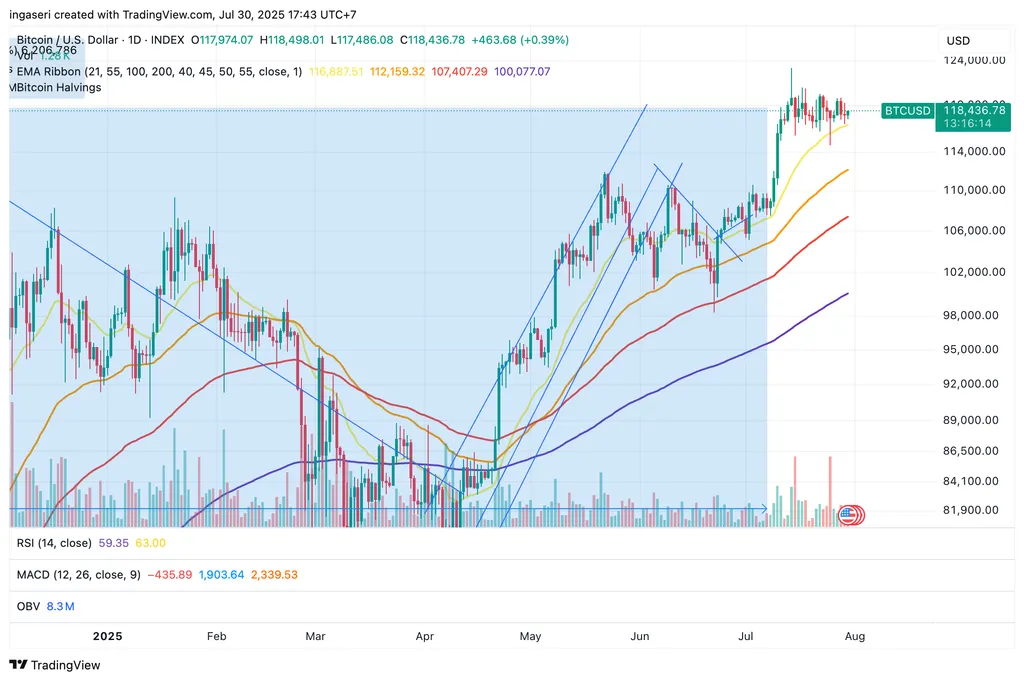
Technical analysts noted that the BTC price correction this week was accompanied by outflows from BTC ETFs, which could signal cautious sentiment among institutional investors. Despite this, some forecasts still project a positive longer-term outlook, with expert price predictions for July 2025 hovering near $119,893 and potential gains moving into August, with forecasts reaching up to about $140,000 by the end of the following month based on current trends and market analysis.
The price volatility in this period also reflected broader market dynamics, including mixed signals from institutional demand and macroeconomic factors influencing crypto assets. While short-term traders might have seen the correction as a warning sign, the larger trend since the start of the year remains strongly positive, with BTC up more than 76% compared to one year ago. This year-to-date strength continues to attract attention despite the short-term fluctuations.
ETH Price Analysis
ETH has shown notable resilience and bullishness over the past week, moving in sync with the broader crypto rally. ETH opened the week at around $3,630 (July 24) and steadily gained ground, peaking at $3,864 (July 28), before stabilizing near $3,789 as of July 30, 2025. This represents a week-on-week gain, supported by both technical indicators and surging trading volumes. Despite a brief dip midweek, ETH has managed to maintain its position above key moving averages, which many traders and analysts view as a sign of continued market strength.
Institutional interest has played a significant role in boosting ETH’s price. Spot ETH ETFs experienced substantial inflows, with a record $453 million on a single day in late July. Over the recent six-week period, ETH ETFs accumulated 1.6 million ETH, and analysts now project annualized inflows could exceed $20 billion. This robust demand comes just as ETH celebrates its 10-year anniversary, helping to fuel optimism around its fundamental and long-term value proposition. These ETF inflows have, in effect, caused a “supply shock,” further propelling the asset past recent resistance levels and triggering a sharp rally as July drew to a close.
ETH Technical Analysis
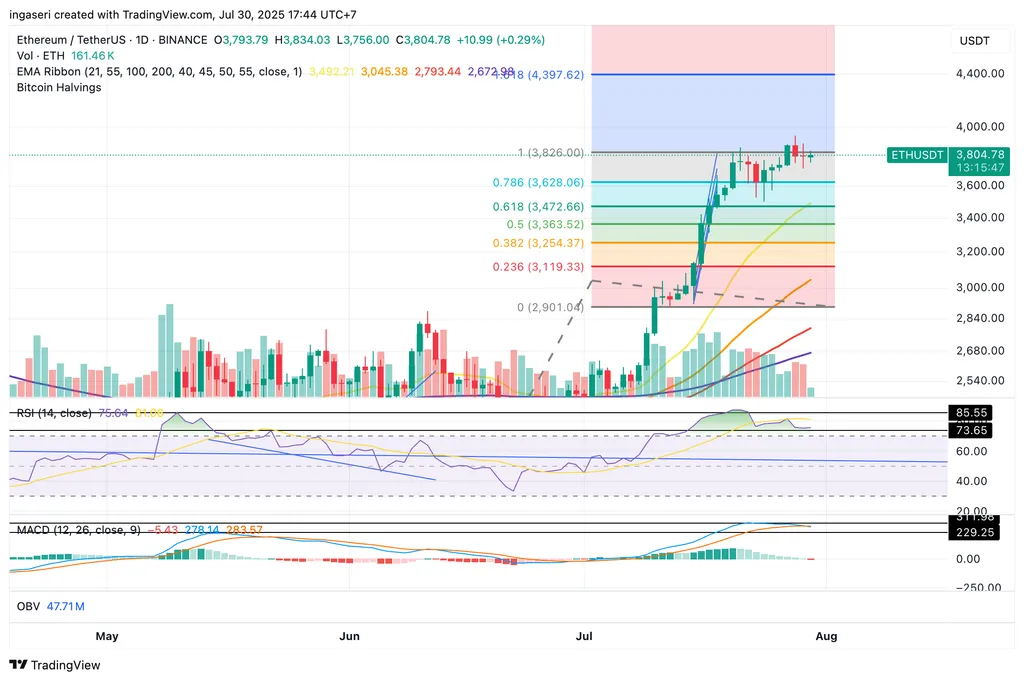
From a technical perspective, ETH has remained above both its 100-day and 200-day exponential moving averages throughout the week. This has maintained the bullish market structure despite occasional profit-taking and short pullbacks. On-chain data also reveals that approximately 1.28 million ETH were accumulated in July, indicating that strong hands are entering the market. Short-term resistance was observed at around $3,917, and analysts suggest that clearing this zone could open the door to a further push towards $4,000 and potentially $4,800 in the near term.
Trader sentiment remains optimistic, with prediction markets noting that 38% of traders expected ETH to hit $4,000 by the end of July, with even higher probabilities assigned to price targets like $4,200 and beyond into August. Most forecasts, including those from Changelly and Binance, anticipate ETH steadily climbing throughout August, with projected average and maximum prices ranging from $4,229 to $4,589, and even some outlier forecasts speculating a move toward $6,900 in the coming month. The upcoming weeks thus appear pivotal for ETH, given its strong institutional backing and robust technical foundation.
Altcoin Analysis
Over the past week (July 23–30, 2025), the wider cryptocurrency market excluding BTC and ETH has experienced notable growth and strong sector performances amid a generally bullish atmosphere. The overall crypto market capitalization held steady near $4 trillion despite some short-term dips.
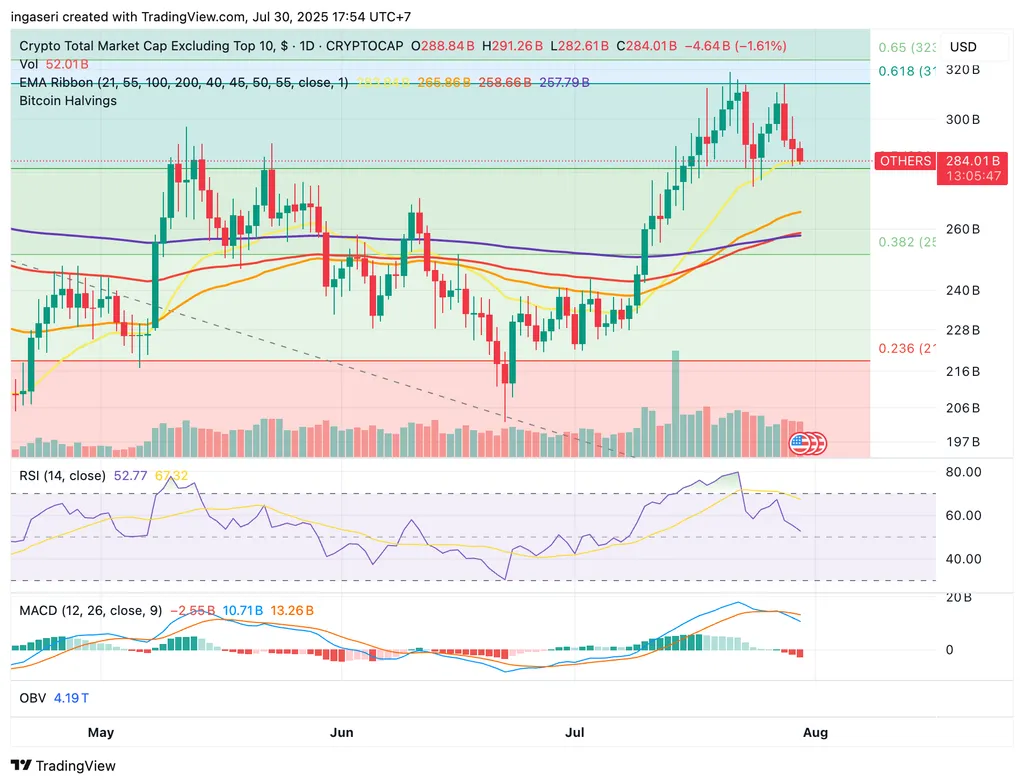
Several altcoins and sector-specific tokens have outperformed significantly, benefiting from positive regulatory developments, technological upgrades, and renewed institutional interest. Notably, memecoins and smaller-cap altcoins showed the strongest gains, with some tokens rallying over 100% during this period.
- Coflux (CFX) surged 125% driven by major network upgrades including throughput improvements and stablecoin launches.
- Other standout performers included DIA (+143%) following a major staking mainnet launch.
- UMA rose 58% recovering after legal uncertainties.
- Tezos (XTZ) surged +55.5% driven by whale activity and regulatory clarity.
- BNB broke above $800, setting a new all-time high and surpassing SOL in market capitalization, underscoring its dominant position among exchange tokens.
- PENGU gained over 40% in the past week and continued its momentum in the last 24 hours with an additional 21% increase.
- These movements have contributed to a decrease in Bitcoin dominance down to roughly 61%, signaling greater interest in altcoins and diversification in market allocation.
Despite broad gains, some sectors saw softer performances. Privacy coins were the only sector posting declines, reflecting ongoing regulatory scrutiny. However, the passage of the GENIUS Act in the U.S. and favorable macroeconomic conditions have further bolstered market sentiment and helped sustain the rally across diverse crypto sectors. Traders and investors are advised to closely monitor sectoral dynamics and regulatory developments as these factors continue to shape the direction of the crypto market.
On-Chain Analysis
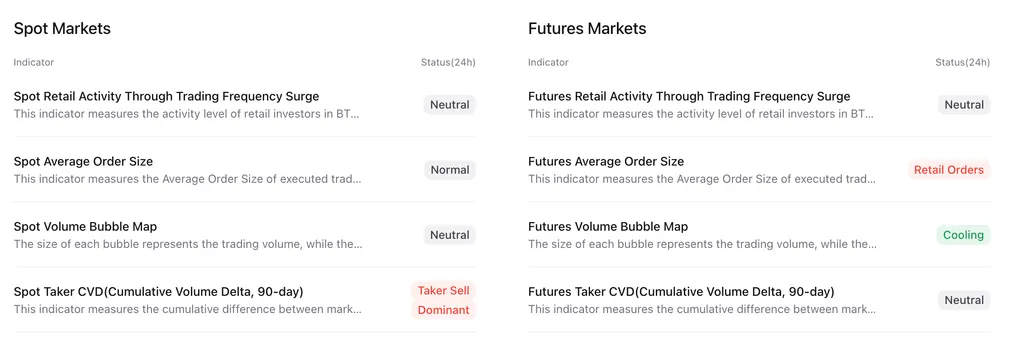
News About Altcoins
- U.S. Bitcoin and Ethereum ETFs See Significant Outflows in August Following Record July. U.S.-based spot Bitcoin and Ethereum ETFs experienced significant outflows at the start of August, reversing the record-breaking inflows seen in July. Bitcoin funds saw a combined $812.3 million in outflows, marking their worst day since February. Notably, while BlackRock’s IBIT fund saw minimal losses, other major funds like Fidelity’s FBTC and Ark & 21 Shares’ ARKB suffered significant outflows of around $330 million each. Ethereum ETFs mirrored this trend, with $152.3 million in outflows, the worst day for the funds since January. Despite these reversals, BlackRock’s IBIT and ETHA funds remain the largest in their respective categories. Fund issuers are now turning their attention to spot Solana ETFs, with new filings indicating potential future offerings.
News from the Crypto World in the Past Week
- The GENIUS Act: Bridging Regulatory Clarity and Web3 Usability. The GENIUS Act, signed into law in mid-July, marks a significant step forward in regulating stablecoins, removing much of the uncertainty surrounding their use in the U.S. financial system. However, the real challenge lies not in regulation but in the usability of Web3 technology. While stablecoins are now legally recognized, most Web3 tools remain complex and unintelligible to the average user, hindering widespread adoption. The future of Web3 hinges on creating programmable infrastructure that simplifies processes, making it more accessible and efficient for businesses and individuals, ultimately driving real-world applications and user adoption.
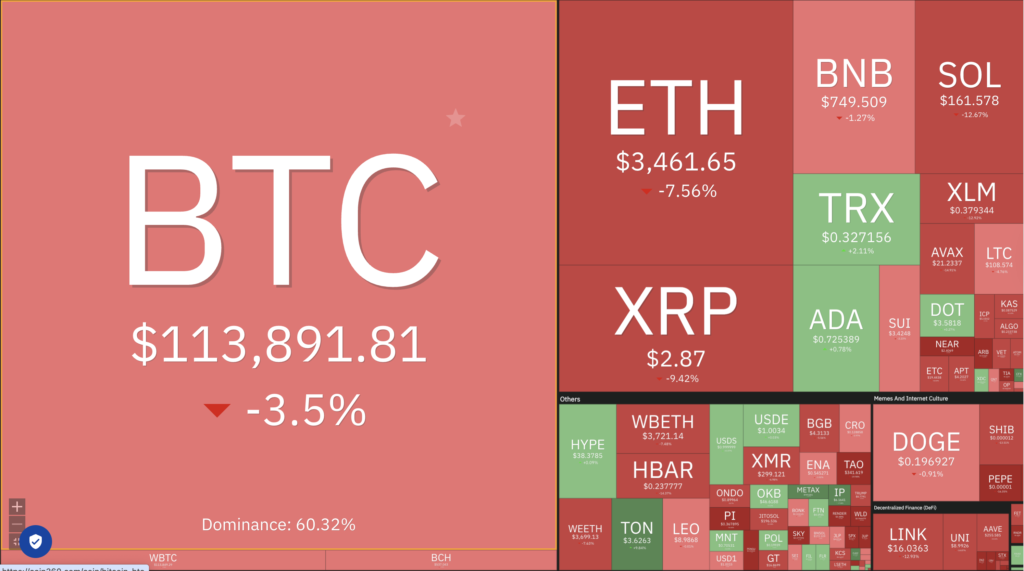
Cryptocurrencies Market Price Over the Past Week
Cryptocurrencies With the Best Performance
- Conflux (CFX) +13.90%
- Story (IP) +12.46%
- Four (FORM) +11.86%
- Toncoin (TON) +8.39%
Cryptocurrencies With the Worst Performance
- Fartcoin (FARTCOIN) -30.36%
- Bonk (BONK) -28.62%
- Virtuals Protocol (VIRTUAL) -23.71%
- Jupiter (JUP) -21.20%
References
- Porter Stowell, Stablecoins Are Finally Legal—Now Comes the Hard Part, decrypt, accessed on 3 August 2025.
- Zack Abrams, US crypto ETFs open August with largest outflows in months following record-breaking July, theblock, accessed on 3 August 2025.
