
Crypto investors are celebrating as Ethereum (ETH) reaches $4000. This surge has fueled optimism that the altcoin season (Altseason) might have officially started this August. Read the full analysis from Pintu’s Trader Team in the article below.
Market Analysis Summary
- 🟢 Technically, BTC price action formed an inverse head-and-shoulders pattern with a neckline near $115,000, suggesting a potential bullish.
- 🚀 ETH price has demonstrated a bullish structure with the 100-day moving average accelerating above the 200-day moving average, forming a “golden cross,” a common bullish signal.
- 💼 In July 2025, the U.S. unemployment rate (U-3) edged up to 4.2%, reflecting a subtle rise from 4.1% in June.
- 📈 In July 2025, U.S. nonfarm payroll employment increased by only 73,000 jobs, sharply missing market expectations of around 110,000 and highlighting a notable slowdown in job creation.
- 🏭 The S&P Global US Manufacturing PMI for July 2025 was revised slightly higher to 49.8 from a preliminary estimate of 49.5. The July 2025 ISM Manufacturing Index (PMI) registered 48.0, down from 49.0 in June.
Macroeconomic Analysis
Unemployment Rate
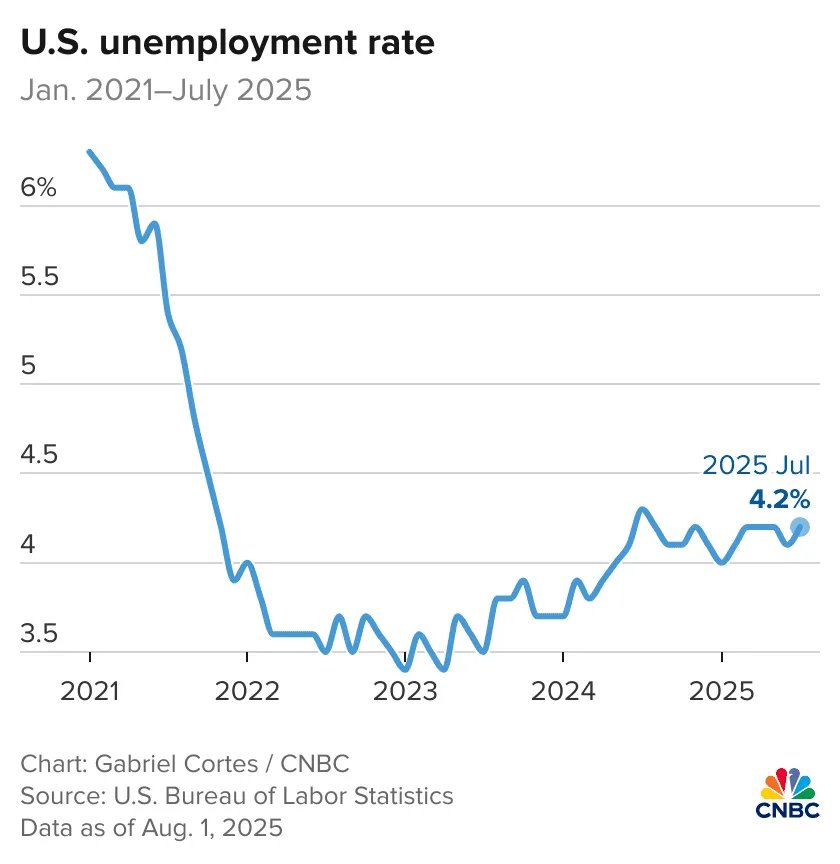
In July 2025, the U.S. unemployment rate (U-3) edged up to 4.2%, reflecting a subtle rise from 4.1% in June. This change, while modest, is notable because it coincided with persistently slow job creation—only 73,000 new jobs were added, falling short of expectations and prompting economists to revise previous months’ employment gains downward. This trend suggests that the labor market, though still stable, has lost some momentum and is showing the first hints of weakness following a long stretch of relative strength.
Alongside the rise in the headline unemployment figure, the broader U-6 unemployment rate climbed to 7.9% in July 2025 from 7.7% in June. Since the U-6 rate flags economic distress beyond the traditional unemployment measure, its uptick can signal deeper labor market challenges than the U-3 rate alone might indicate.
On the production side, persistently high unemployment reveals that an economy is operating below its potential. Idle labor means that the nation is not maximizing its output of goods and services, which directly hampers GDP growth. Firms may respond cautiously by deferring expansion plans, reducing investment in capital and innovation, and trimming overall capacity. Governments also experience fiscal strain, as lower tax revenues coincide with increased demand for unemployment benefits and social services, putting pressure on public finances.
Other Economic Indicators
- Non-Farm Payrolls: In July 2025, U.S. nonfarm payroll employment increased by only 73,000 jobs, sharply missing market expectations of around 110,000 and highlighting a notable slowdown in job creation.
- Manufacturing Index: The S&P Global US Manufacturing PMI for July 2025 was revised slightly higher to 49.8 from a preliminary estimate of 49.5, but it remained below the 50 mark, signaling a contraction in the manufacturing sector.
- Michigan Consumer Sentiment: In July 2025, the University of Michigan’s Consumer Sentiment Index for the U.S. rose slightly to 61.7 from 60.7 in June, marking the second consecutive monthly increase and reaching its highest level since February 2025.
- Services Index: In July 2025, the U.S. services sector revealed a complex picture through two major indicators, the S&P Global U.S. Services PMI rose to 55.7, revised upward from a flash estimate of 55.2, signaling the strongest expansion in the services sector this year. S&P’s data suggests the services sector is contributing significantly to a GDP growth rate approaching 2.5% annualized, up from the 1.25% growth seen earlier in the year.
BTC Price Analysis
In the past week leading up to early August 2025, BTC showed notable price volatility but maintained a relatively strong position around the $110,000 to $115,000 range. Starting from a high near $115,000 at the close of July—its highest monthly close ever—BTC dipped to about $109,600 by mid-August before slightly rebounding to around $111,000. This retracement involved a sharp correction from the July peak but stayed above key support levels near $114,000 identified by market analysts earlier.
BTC Technical Analysis
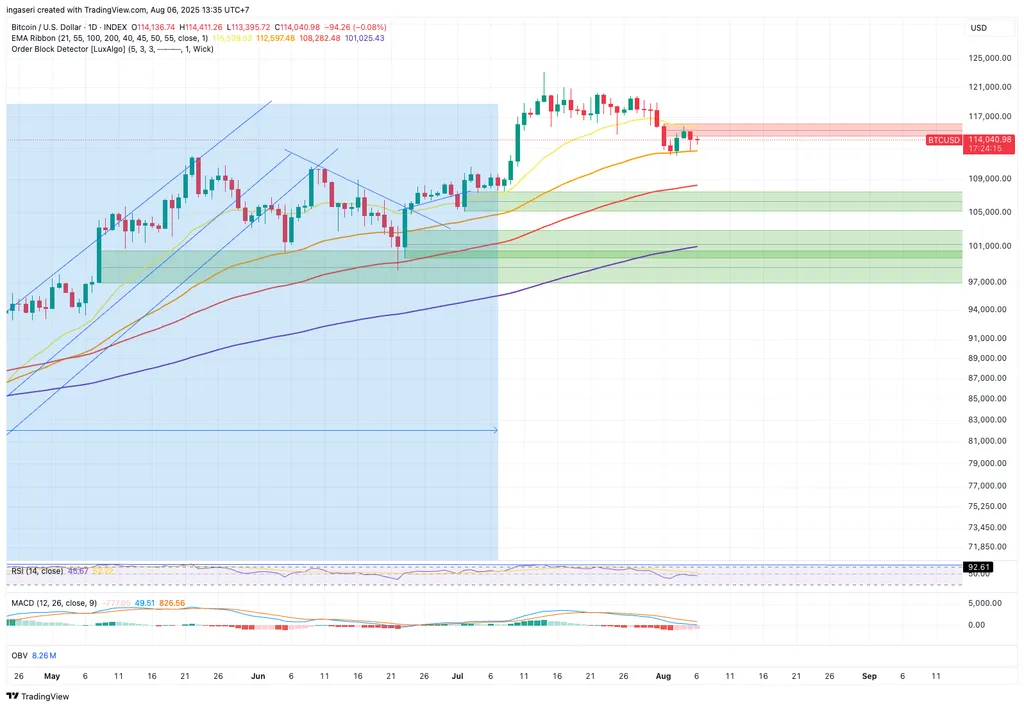
Technically, the price action formed an inverse head-and-shoulders pattern with a neckline near $115,000, suggesting a potential bullish continuation if BTC reclaims that threshold decisively. Traders view the $114,000 level as key support after closing the CME futures gap at that point, a phenomenon historically followed by rebounds. However, failure to hold above this support could lead to declines toward $111,800 or even a more extended retest of the $104,000 level, highlighting some downside risks in the near term.
From a broader perspective, August historically tends to be a modest month for BTC with average gains around 1.6%, but in post-halving years like this one, exceptional rallies are possible, with gains in previous cycles reaching 30-65% in August. Analysts project possible upside targets ranging from $130,000 to $135,000 for August, driven by reduced supply post-halving and renewed investor enthusiasm. Some price models forecast short-term rallies up to $133,300 or $135,000 if bullish patterns hold, even as caution remains due to market volatility.
ETH Price Analysis
In the past week leading into early August 2025, ETH showed a recovery and consolidation phase after tagging the key $4,000 resistance level. After surging past $3,500 and reaching near $4,000, ETH pulled back slightly, retracing toward the $3,500 support zone, which is now being tested as a critical level for maintaining bullish momentum. The recent retracement helped cool overbought conditions indicated by the RSI, which now hovers near 56, allowing room for an upward move if buyers return.
ETH Technical Analysis
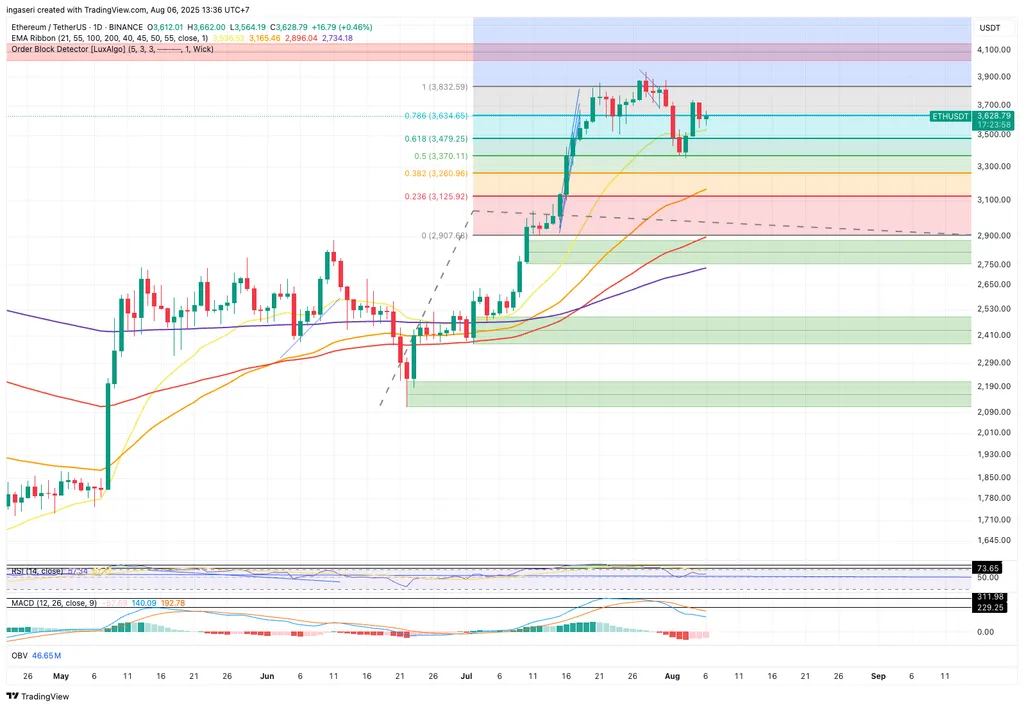
Technically, ETH price has demonstrated a bullish structure with the 100-day moving average accelerating above the 200-day moving average, forming a “golden cross,” a common bullish signal. As long as ETH holds above $3,500, traders expect the market to remain positive. Should ETH reclaim and hold above $3,700, it opens the possibility to retest the highs around $4,100, which, if broken, could trigger a move toward $4,400–$4,500. Key support levels include $3,600-3,620, whose successful retest would keep the bullish structure intact and pave the way for short-term targets around $3,720 and $3,800.
On shorter time frames, ETH has faced resistance near $3,720, coinciding with the Bollinger Band upper limit and the 20 EMA cap, leading to some trading range consolidation. The price action shows mounting exchange outflows and relatively soft intraday momentum, pointing to cautious trader sentiment. Support levels at around $3,624 (50 EMA), $3,576 (100 EMA), and $3,360 (200 EMA) are being closely watched to gauge the strength of the current recovery phase.
Altcoin Analysis
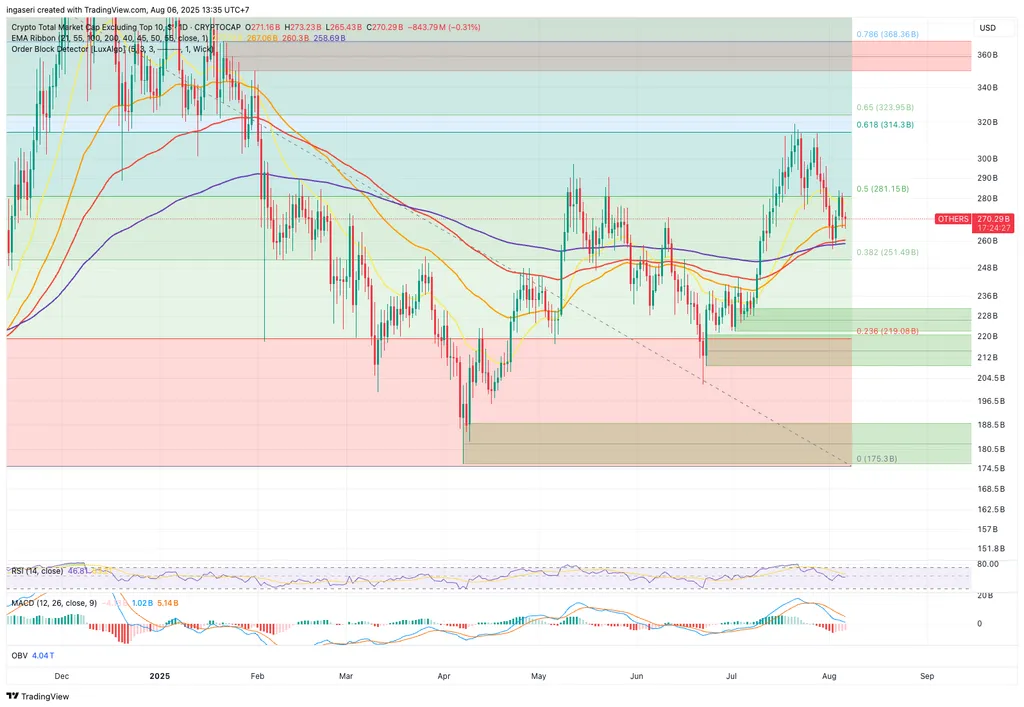
In the past week leading into early August 2025, the wider crypto market has shown signs of renewed strength with a mixture of rebounds and promising momentum in several altcoins. The global crypto market capitalization increased by about 1.54% to approximately $3.95 trillion, accompanied by a robust increase in trading volume of over 34%, highlighting rising investor activity and interest. This positive momentum is driven by factors such as regulatory clarity brought on by the GENIUS Act and significant inflows into Ethereum-related ETFs, which have had positive spillover effects on altcoins.
However, the Altcoin Season Index remains below the threshold for a full altseason, currently at 42/100, indicating the market is still early in this phase. From a price perspective, many major altcoins experienced rallies alongside BTC’s modest rebound. XRP, for instance, showed strong gains following legal clarity on regulatory issues, while tokens like SOL and DOT, and others posted notable daily gains between 2.5% and 8%.
Analysts provide a cautious outlook, highlighting that altcoin rallies in the short term may remain fragile and vulnerable to broader market pullbacks. While retail interest in altcoins has increased—evidenced by Google search trends overtaking Bitcoin for the first time since late 2024—structural demand and sustained capital rotation are still lacking to sustain a major breakout.
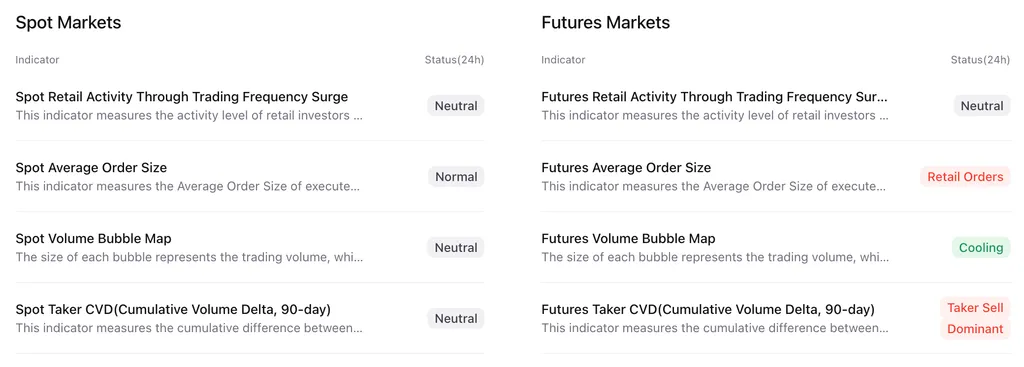
On-Chain Analysis
News About Altcoins
- Pendle Finance Reaches $8 Billion TVL, Driven by Boros Yield Marketplace. Pendle Finance has reached an all-time high of $8 billion in total value locked (TVL), propelled by the success of its newly launched yield marketplace, Boros. The platform’s native token, PENDLE, has surged 45% over the past week, outperforming broader market trends. Boros enables traders to speculate on or hedge against crypto funding rates through on-chain assets called Yield Units (YUs). The platform quickly attracted over $1.85 million in BTC and ETH deposits in just 48 hours and has seen a significant rise in activity on Pendle’s Arbitrum deployment. With plans to expand into staking rewards and tokenized Treasury bill yields, Pendle’s growth continues to accelerate, solidifying its position at the forefront of on-chain yield trading.
News from the Crypto World in the Past Week
- Harvard University’s Investment Portfolio Includes $117 Million in BlackRock’s Bitcoin ETF. Harvard University’s investment portfolio held $117 million worth of shares in BlackRock’s spot Bitcoin ETF at the end of Q2, making it the fifth-largest investment in its portfolio, ahead of Alphabet. The university’s portfolio is managed by Harvard Management Co Inc., with Microsoft being its largest investment at over $310 million. BlackRock’s Bitcoin ETF, IBIT, has grown in popularity, attracting institutional investors, including a sovereign wealth fund from Abu Dhabi that held over $500 million in the fund. Other Bitcoin ETFs, such as the ARK 21Shares Bitcoin ETF, are also seeing increasing institutional interest, with the State of Michigan Retirement System holding nearly $11 million by the end of Q2.
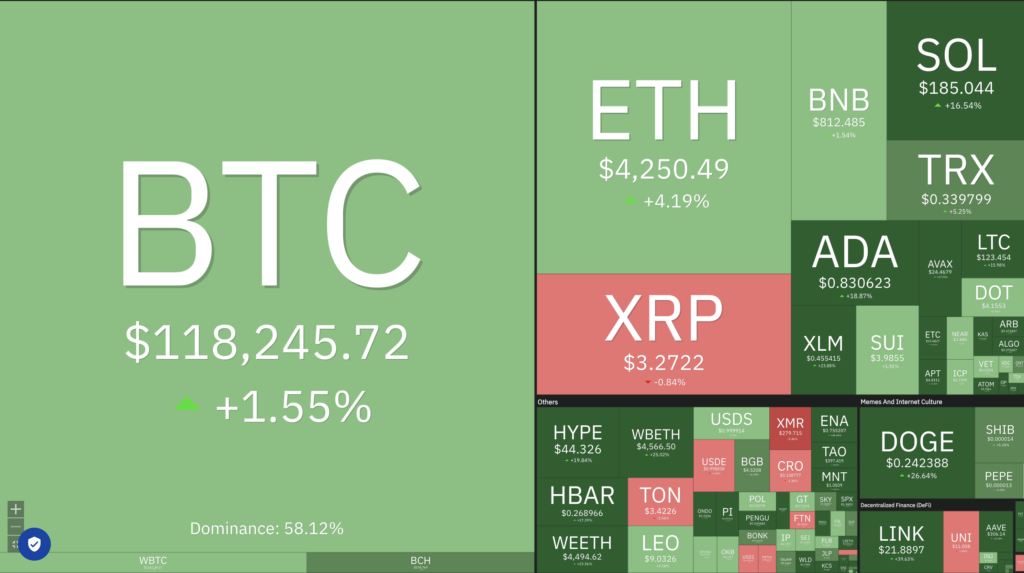
Cryptocurrencies Market Price Over the Past Week
Cryptocurrencies With the Best Performance
- Aerodrome Finance (AERO) +57.70%
- Mantle (MNT) +52.66%
- Lido DAO (LDO) +47.94%
- Pendle (PENDLE) +45.71%
Cryptocurrencies With the Worst Performance
- Monero (XMR) -5.40%
- Toncoin (TON) -3.66%
- XDC Network (XDC) -0.20%
References
- RT Watson, Harvard had more money in BlackRock’s Bitcoin ETF than Google shares at end of last quarter, theblock, accessed on 10 August 2025.
- Alexander Stefanov, Pendle Hits Record TVL as New Yield-Trading Platform Gains Traction, coindoo, accessed on 10 August 2025.