Signal Summary Futures Trading:
- API3 (API3)
- Entry : $0.9093-$1.0932
- Stop Loss [SL] : $0.8861
- Target Profit [TP] :
- TP1: $1.2913
- TP: $1.5093-$1.7698
- Beam [BEAMX]
- Entry : $0.007105
- Stop Loss [SL] : $0.007461
- Target Profit [TP] :
- TP1: $0.006854
- TP2: $0.006360-$0.006478
- Reserve Rights (RSR)
- Entry : $0.008668-$0.008916
- Stop Loss [SL] : $0.008968
- Target Profit [TP] :
- TP1: $0.008360
- TP2: $0.007994-$0.007575
1. API3 (API3)
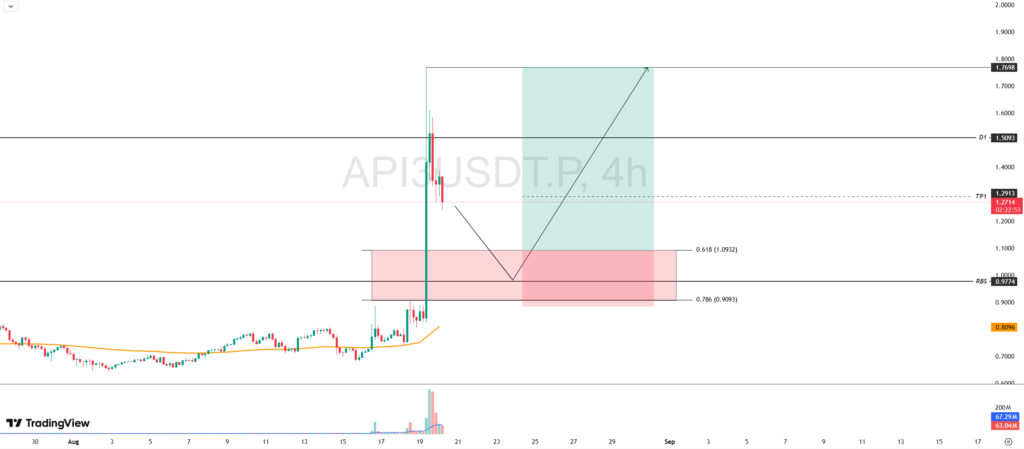
This morning’s daily candle close for API3 sparked positive sentiment among market participants after recording a significant gain of 57.35%.
However, this bullish momentum has not yet been able to break through the key resistance level at the March 23 daily close high of $1.5093, resulting in a rejection.
In the short term, API3’s price is expected to weaken toward the harmonic support area in the range of $0.9093–$1.0932. This zone could become an attractive accumulation area, provided the price is able to demonstrate a valid rebound.

Setup Potensial Buy API3:
Entry : $0.9093-$1.0932
Stop Loss [SL] : $0.8861
Target Profit [TP] : TP1: $1.2913, TP: $1.5093-$1.7698
2. Beam (BEAMX)
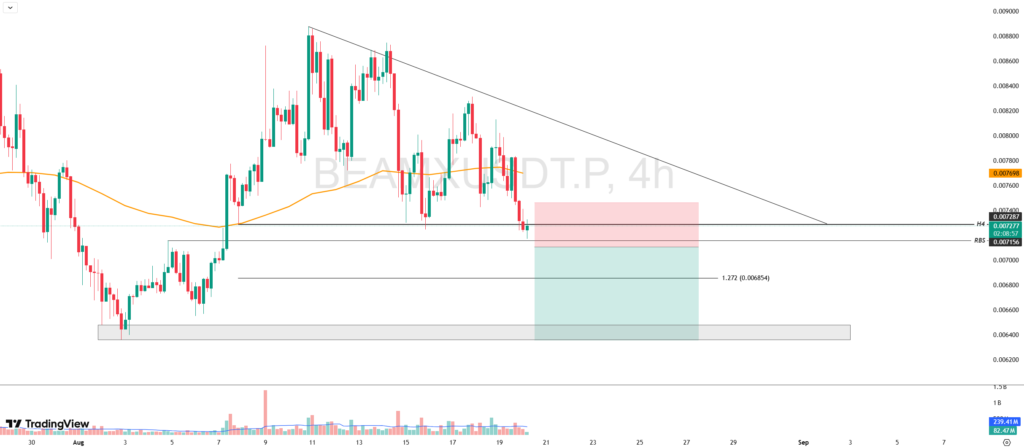
The price movement of BEAMX is showing bearish pressure following a breakdown below the 20-Day EMA on August 19. This condition has triggered further downside momentum, with the potential to break through the key support level at $0.007287.
If this level is breached, it could serve as a valid confirmation of a descending triangle pattern, implying the continuation of the downtrend. The nearest downside target lies at the harmonic support of $0.006854, while the main target is projected in the range of $0.006360–$0.006478.
A sell opportunity may be considered if the price breaks below the RBS (Resistance Become Support) area at $0.007156, which would simultaneously confirm the breakdown of the descending triangle pattern.

Setup Potensial Sell BEAMX:
Entry : $0.007105
Stop Loss [SL] : $0.007461
Target Profit [TP] : TP1: $0.006854, TP2: $0.006360-$0.006478
3. Reserve Rights (RSR)
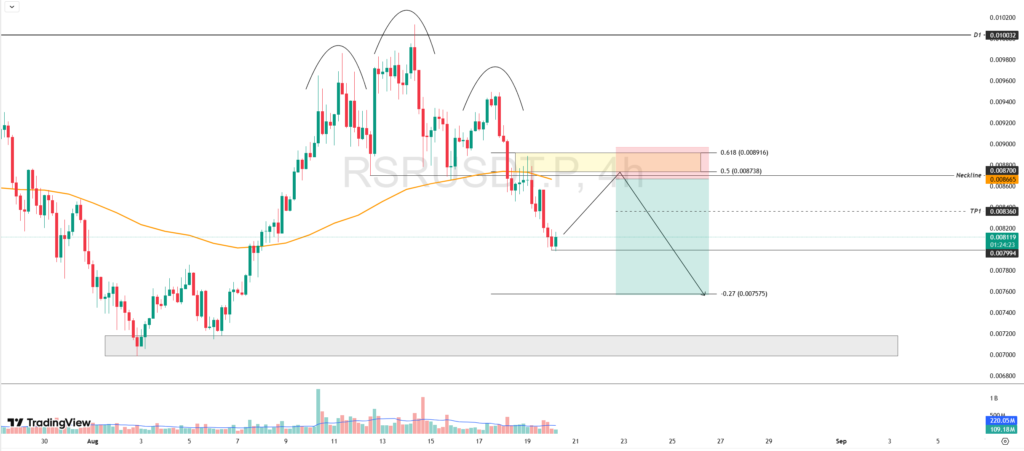
RSR’s bullish momentum has begun to weaken with the formation of a Head & Shoulders pattern, indicating a potential reversal of the main trend. The pattern was validated after the neckline confirmed a breakdown on August 19.
In addition, RSR’s price has been trading below the 20-Day EMA since August 18, which technically adds further bearish pressure.
The zone between $0.008668–$0.008916 is projected as a potential rebound area. However, if a rejection occurs within this zone, a sell opportunity could be considered with lower targets in play.

Setup Potensial Sell RSR:
Entry : $0.008668-$0.008916
Stop Loss [SL] : $0.008968
Target Profit [TP] : TP1: $0.008360, TP2: $0.007994-$0.007575
Important Notes:
Always apply disciplined risk management and capital management. For leveraged trading, it is advisable to risk no more than 1% of total capital per trade.
*Disclaimer: Pintu Futures (cryptocurrency futures trading) is conducted by PT Porto Komoditi Berjangka, a licensed Futures Broker and supervised by Bappebti, and is a member of CFX and KKI. Cryptocurrency futures trading carries high risk, including the risk that leverage can lead to both greater profits and losses.
