
Crypto analysis tools or crypto analytics websites are platforms designed to help investors and traders navigate the digital asset market. From tracking price movements and market trends, analyzing blockchain data, monitoring profitable crypto wallets, to providing predictions — all this information can be easily accessed.
Today, crypto price analysis tools come in various forms with different features. Some focus on real-time price updates and historical data, while others offer in-depth technical analysis complete with charts.
In this article, we’ll explore at least three of the most popular crypto analytics websites for traders and investors in 2025.
The Importance of Data and Analysis in the Crypto World
Blockchain metrics and crypto price analysis tools can be seen as advanced compasses in the vast world of digital assets. With the help of this data, investors and traders can better understand the complex dynamics of the crypto ecosystem and use it to make smarter investment decisions.
So, how exactly do crypto price analysis tools or blockchain analytics platforms support our trading strategies?
- Understanding Market Trends Crypto research tools provide real-time data on price movements, trading volumes, and the market capitalization of various digital assets. This information helps identify patterns and trends, making investment decisions more informed and strategic.
- Technical Analysis With charting features and technical indicators, users can perform in-depth analysis across multiple timeframes. This method is especially popular among derivatives traders, as it helps predict price movements and uncover potential trading opportunities.
- On-Chain Analysis On-chain data like transaction volume, wallet distribution, and Total Value Locked (TVL) can be monitored to assess the health of a blockchain network, dApp activity, and the strength of DeFi protocols.
- Risk Management These tools also help identify risk factors such as market volatility or liquidity levels. With this insight, users can manage their portfolios more safely and minimize potential losses.
- Learning Resources For beginners, these analysis tools also serve as educational platforms. They not only offer insights into the crypto market but also help users understand how blockchain technology works.
<aside> 💡
Read the full article about Blockchain and How It Works on Pintu Academy.
</aside>
3 Popular Crypto Analysis Websites
In the fast-moving world of crypto, access to accurate data and in-depth analysis is crucial. Several platforms have become go-to resources for traders and investors looking to understand market trends, track asset movements, and develop informed investment strategies.
Below are three of the most popular crypto analysis websites widely used by the global community.
1. Artemis
Artemis is one of the most popular crypto analysis websites today. It’s a platform focused on on-chain data analytics, offering institutional-grade access to digital asset data, complete with a wide range of indicators and insights related to blockchain activity.
Whether you’re a trader, investor, or analyst, Artemis is designed for DeFi participants who prefer making data-driven decisions over pure speculation. Currently, Artemis offers three main services: Artemis Terminal, Artemis Sheets, and Artemis Reviews.
Artemis Terminal
Artemis Terminal is a blockchain analytics platform built to explore and analyze data across leading blockchains in the market. With a variety of indicators, users can compare and evaluate blockchain performance side by side.
Some of the key features include developer activity tracking, highlights on top dApps and smart contracts, and customizable interactive charts.
What sets Artemis Terminal apart is its ability to present complex data clearly and in a well-structured format, helping users avoid the typical “data overload” found on other platforms. Its user-friendly interface makes it easier to spot trends and understand broader market behavior.
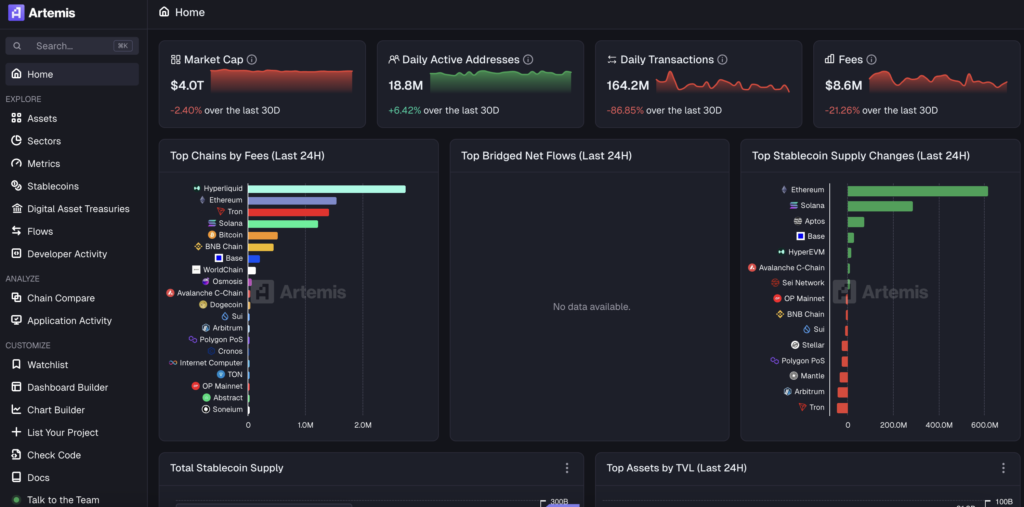
On the main dashboard of Artemis Terminal, you’ll find a summary of on-chain activity across major blockchains. This includes ecosystem TVL (Total Value Locked), active address volume, and the number of transactions in the past 24 hours.
Scroll further down, and you’ll see performance comparison charts for Bitcoin, Ethereum, Gold, Nasdaq, and the S&P500 over various timeframes. It also highlights trending categories, top decentralized applications (dApps), and currently active smart contracts. Key market indicators are also displayed to help users monitor trends and uncover new opportunities.
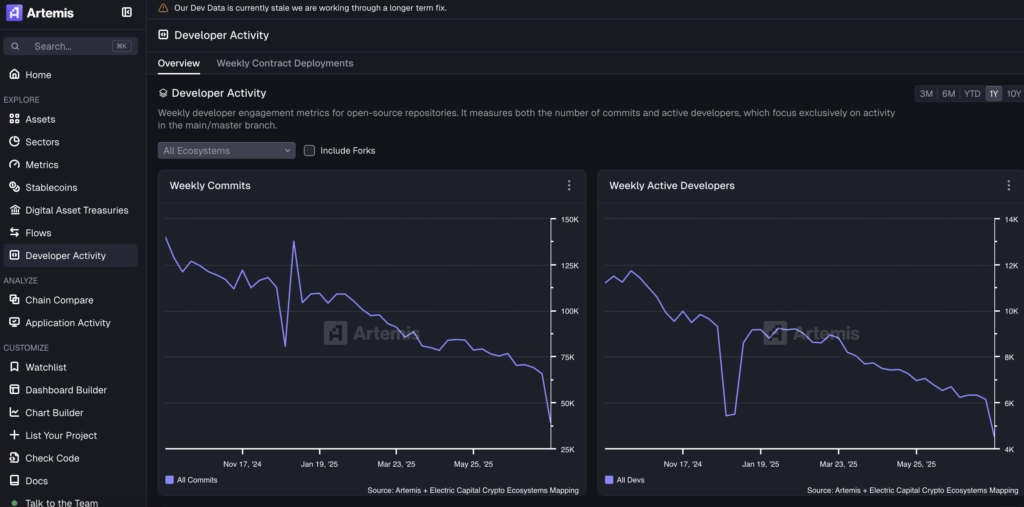
One standout feature is the Developer Activity section. As the name suggests, this tab focuses on tracking development activity across blockchain ecosystems. At the top, a graph shows the number of weekly commits (the smallest unit of developer contribution), along with a count of active developers—defined as those who have made at least one commit during the period.
Below, a detailed table provides insights per blockchain. By selecting the “Contract Deployments” option, users can see how many new smart contracts have been deployed across different chains.
In summary, Artemis Terminal is designed to be accessible for users of all experience levels. You don’t need a technical background to extract meaningful insights. It’s an excellent platform for analyzing the fundamentals of crypto projects, identifying trends, tracking market movements, and forecasting potential shifts in the industry.
Artemis Sheets
Artemis Sheets is an extension you can install on your PC to import blockchain data directly into Google Sheets or Excel. The data updates in real time and can be pulled from Artemis Terminal as well as other sources like CoinGecko, Dune, or Token Terminal. For beginners, free templates are also available to help you get started quickly and easily.
Artemis Reviews
In addition, Artemis offers a weekly roundup called “Crypto Fundamentals“, which covers the latest events in the crypto world. The platform also provides in-depth analysis on both technical topics and current global issues—including politics, economics, and more—that could potentially impact the blockchain ecosystem.
2. DeFiLlama
DeFiLlama has emerged as one of the most popular crypto analysis websites in 2025. It is a free analytics platform used to monitor activity across thousands of decentralized finance (DeFi) protocols and hundreds of blockchains. Since its launch in 2020, DeFiLlama has provided data on Total Value Locked (TVL), protocol rankings, and the performance of various chains—making it easier for users to analyze market trends and DeFi ecosystem activity.
Core Features of DeFiLlama:
- Total Value Locked (TVL): Shows the amount of assets staked or locked in DeFi protocols, reflecting the overall scale and health of the ecosystem.
- Protocols: Ranks DeFi platforms such as Uniswap, Aave, or Curve Finance by TVL or by category (e.g., decentralized exchanges, lending platforms).
- Chains: Tracks metrics for Layer 1 blockchains like Ethereum and Solana, and Layer 2 networks like Arbitrum and Optimism.
- Yields: Displays data on returns from farming or staking pools.
- Oracles & NFTs: Offers insights into price feed services and NFT trading volumes.
- Airdrops: Lists tokenless protocols with high airdrop potential, helping users discover early opportunities.
What Makes DeFiLlama Stand Out? DeFiLlama is free to use, ad-free, and fully open to the public. It also provides a public API, allowing seamless data integration into other tools and platforms. With a strong commitment to transparency and community access, DeFiLlama has become one of the most trusted sources for analyzing the DeFi landscape.
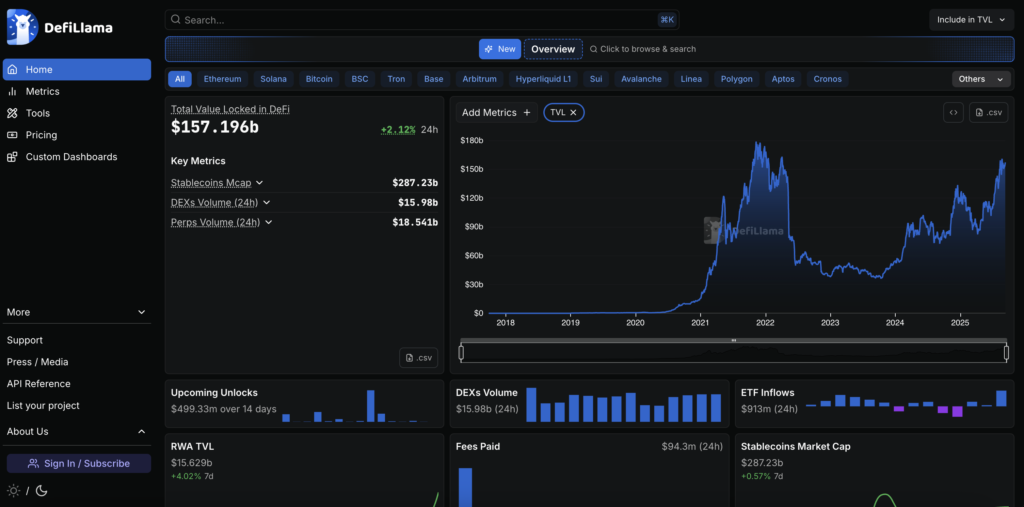
You can visit defillama.com to explore TVL rankings, analyze the performance of various chains, review yield data, and study historical trends in the DeFi market. The platform also offers data export features, making it easier to customize and use the information for your own analysis.
For example, to compare decentralized exchanges (DEXs), go to the “Protocols” menu, apply the “DEX” filter, and sort by TVL. This allows you to quickly identify which platforms are leading in terms of trading volume.
Additionally, DeFiLlama provides a Stablecoin Market Cap chart, where users can view a detailed breakdown of the total market capitalization of stablecoins, categorized by asset and chain.
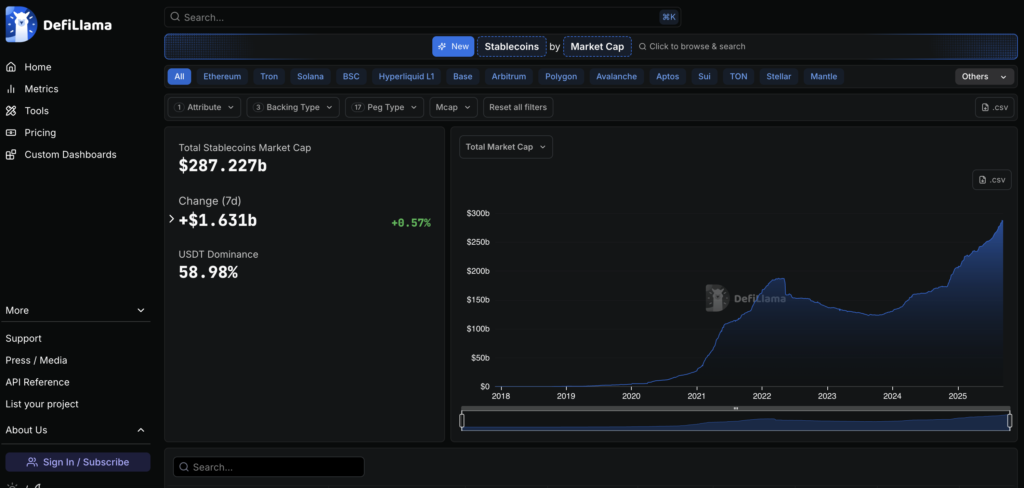
The data includes market cap (MCap), the blockchain where each stablecoin circulates, and the current stablecoin price. These insights give users a clearer picture of the distribution and dominance of various stablecoins across the crypto ecosystem.
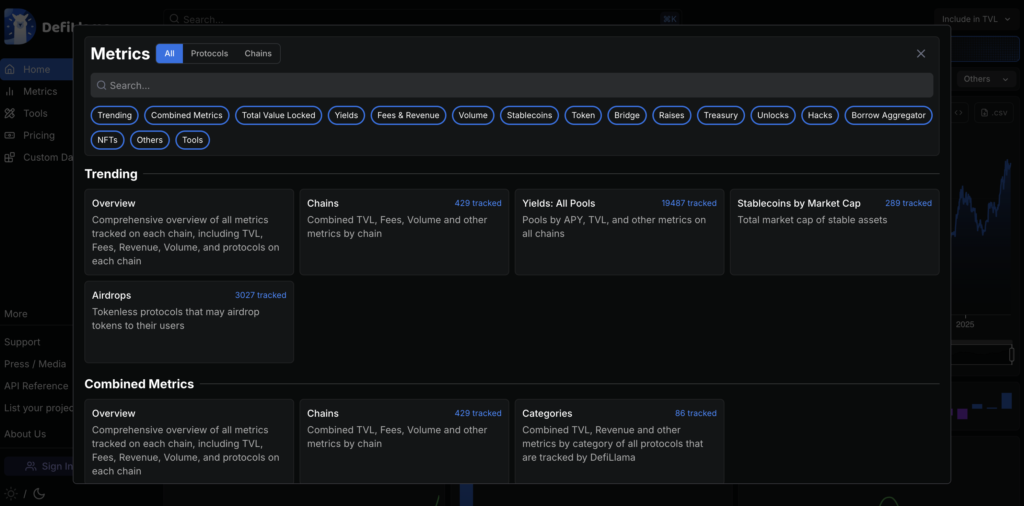
Exploring further, under the “Overview” and “Trending” sections, you’ll also find an “Airdrops” tab. This section highlights a list of tokenless protocols that may potentially launch a token and distribute it to users as part of a future airdrop. It’s a valuable tool for tracking thousands of early-stage projects that might reward users as part of their initial adoption strategy.
Overall, DeFiLlama is one of the most powerful crypto analysis tools for exploring DeFi protocols and blockchains, including their growth, liquidity, and adoption metrics. With access to such reliable data, users can make more informed investment decisions backed by real-time market insights.
3. Bitcoin Magazine Pro
Bitcoin Magazine Pro is a trusted information source offering comprehensive data, analysis, and insights related to Bitcoin. Through its website, the platform provides a wide range of on-chain and market indicators designed to support both beginner and experienced investors in making more informed decisions.
Users can access over 150 detailed Bitcoin charts, along with various investment tools that provide valuable perspectives on market trends and cycles. Whether you want to understand Bitcoin’s performance, monitor future price potential, or gain educational insights, this platform has you covered.
What Makes Bitcoin Magazine Pro Stand Out? The platform delivers a wide array of relevant metrics, including:
- Live Price
- Market Cycles
- Wallet Addresses
- On-chain & Ratio Indicators
- Adoption Trends
- Technical Metrics like Bitcoin Hashrate and Lightning Network Capacity
These metrics are designed to help users gain a deeper understanding of market conditions, adoption patterns, and the overall health of the Bitcoin ecosystem.
<aside> 💡
Hashrate is a unit used to measure the speed at which a computer or mining machine performs hashing operations. Read more here.
</aside>
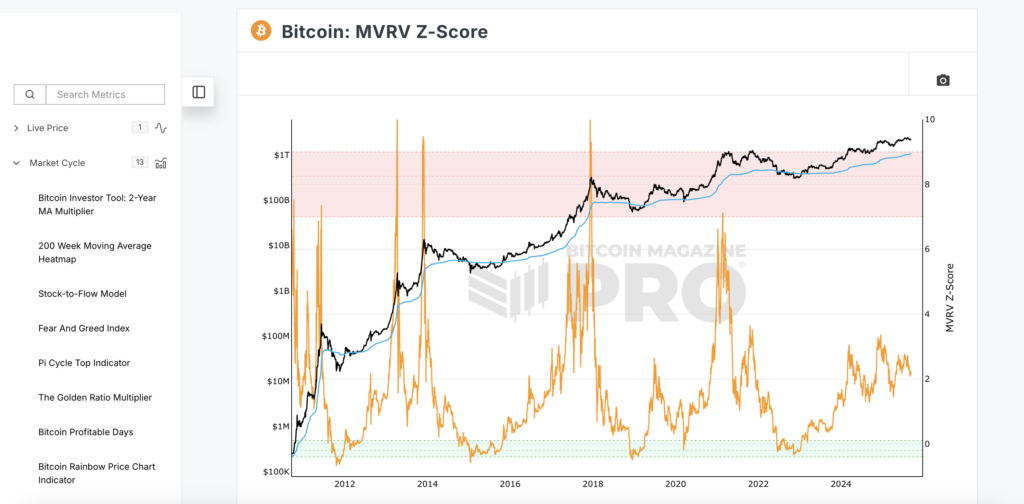
One of the standout tools in the On-chain Indicators section is the MVRV Z-Score chart. This metric leverages blockchain data to identify when Bitcoin’s price is significantly overvalued or undervalued compared to its fair value.
This chart is especially useful for identifying potential price turning points during extreme market conditions. For instance:
- When the MVRV Z-Score enters the red zone at the top, it can signal that Bitcoin may be due for a price correction.
- When it dips into the green zone at the bottom, it typically indicates a potential rally ahead.
Historically, this indicator has proven fairly accurate in identifying Bitcoin market tops—often within just two weeks of the actual peak.
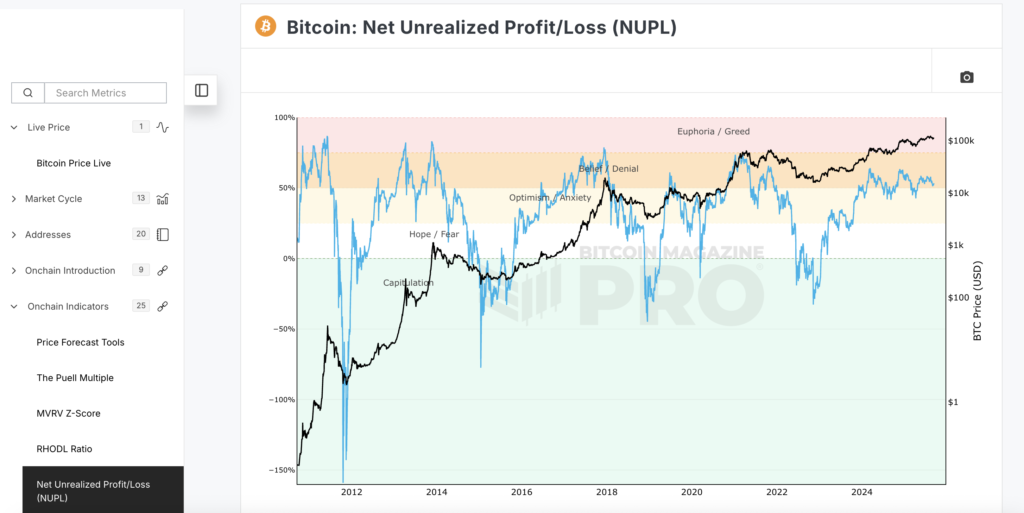
Another important metric is NUPL (Net Unrealized Profit/Loss). This indicator analyzes market participant behavior to help predict when Bitcoin is nearing a major top or bottom.
Using on-chain data, NUPL reflects the emotional state of the market—whether investors are in profit or at a loss—giving valuable insights into potential future price movements and trend shifts.
Overall, Bitcoin Magazine Pro is a deep-dive research and analysis platform dedicated to Bitcoin. By combining on-chain data, macroeconomic analysis, and insights into mining and derivatives, it helps both novice and seasoned investors make more confident and informed investment decisions.
Start Investing in Crypto with Pintu
After exploring various crypto analysis websites and tools, it’s time to take action. You can start investing in crypto easily through the Pintu app. On Pintu, you can buy a wide range of crypto assets—including DeFi tokens, RWA (Real World Assets), Layer-1, Layer-2, and even Meme Coins—all within a single, secure platform that’s perfect for both beginners and experienced investors looking to build a digital asset portfolio.
Here are the steps to buy crypto on Pintu:
- Go to the Pintu homepage.
- Navigate to the Market page.
- Search for and select the crypto asset you’ve analyzed.
- Enter the amount you want to buy, and follow the next steps to complete your purchase.
Conclusion
To sum up, the three crypto analysis platforms discussed above—Artemis, DeFiLlama, and Bitcoin Magazine Pro—each offer their own unique strengths:
- Artemis excels at delivering clear and accessible on-chain data.
- DeFiLlama is a go-to resource for tracking DeFi activity and stablecoins across blockchains.
- Bitcoin Magazine Pro provides deep insight into Bitcoin through on-chain metrics and macroeconomic analysis.
For traders and investors in 2025, combining insights from these three platforms can provide a more well-rounded view of the market, improve risk management, and support the development of a stronger investment strategy in the crypto space.
<aside> 💡
*Disclaimer: All articles from Pintu Academy are intended for educational purposes only and do not constitute financial advice.
</aside>
References:
- Finn Miller. Best Crypto Analysis Tools to Give You an Edge in the Crypto Market. Accessed on September 11, 2025.
- Phemex. DeFi Llama 2025: Guide to Tracking TVL and DeFi Analytics. Accessed on September 11, 2025.
- Raphael Wernert. Artemis: Explore Blockchains with Ease. Accessed on September 11, 2025.
- Vivek Singh. DeFiLlama Review: The Ultimate Guide. Accessed on September 11, 2025.