Chart patterns are one of the key pieces of information for traders to identify price movements and determine areas to open positions. In crypto futures trading, traders can take advantage of both bullish and bearish market conditions. When the market is in bearish trend, downtrend chart patterns can be used as a reference to open short positions. In this article, we will discuss five downtrend chart patterns that need to be understood to determine short positions.
Article Summary
- 📉The downtrend chart pattern is visual information on the chart that can help identify the direction of a bearish trend on a crypto asset.
- 📊Double Top, Head and Shoulders, Descending Triangle, Bearish Flag, and Bearish Pennant are five common downtrend chart patterns that traders use as a reference in determining short selling positions.
- 🥷Trading techniques such as scalping and swing trading can be applied to some of these patterns, such as Double Top, Descending Triangle, and Bearish Pennant, as each pattern has different price movement characteristics and consolidation duration.
What is Downtrend Chart Pattern?
Downtrend chart pattern is candlesticks that form a pattern that can be identified as a sign of downward. This downtrend chart pattern is often utilized by futures traders in determining short positions. The most common downtrend chart patterns are the Double Top, Head and Shoulders, Descending Triangle, Bearish Flag, and Bearish Pennant.
It should be noted that the patterns formed may give false signals. Therefore, traders cannot rely on this one pattern alone as the main reference in determining short selling positions. Risk management remains the most important cornerstone of trading decisions.
Basically, understanding downtrend chart patterns is part of technical analysis that can help traders gain additional information about market conditions. Therefore, traders need to first understand the basic concepts of technical analysis as well as how to apply them in order to identify these patterns correctly.
Read: Introduction to Technical Analysis in Cryptocurrency
1. Double Top
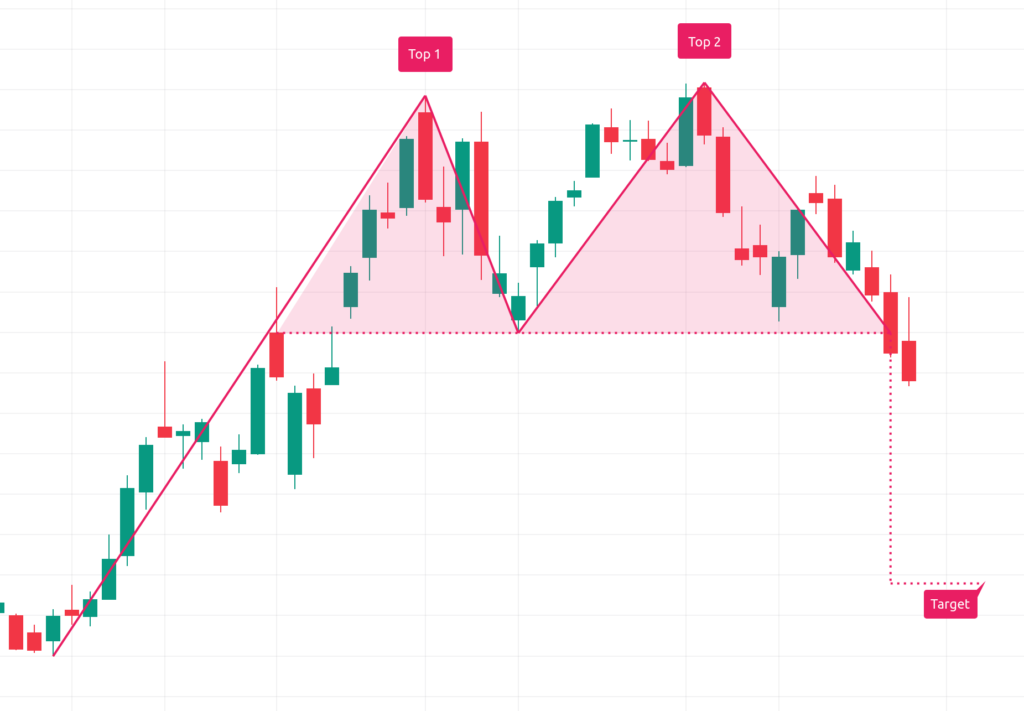
Double Top is a bearish pattern that forms when the price experiences two rising tops and fails to break through the same resistance level. This pattern reflects weakening buying momentum, which is generally characterized by lower transaction volume at the second peak.
Meanwhile, the neckline or flat support is the lowest level formed after the first peak (Top 1). The neckline level plays an important role as a confirmation area, where a price break below this level strengthens the validity of the Double Top bearish pattern.
The image above shows an example of a confirmed Double Top pattern, characterized by a continued price drop and a candlestick closing below the neckline after the price failed to break the resistance at the second peak (Top 2).
How To Use A Double Top In A Short Position?
The Double Top pattern can be combined with swing trading techniques, where the decision to open a short selling position is based on the confirmation of the pattern on higher timeframes to capture potential price movements in the medium to long term. Here’s the strategy:
- Entry: Entry can be considered during the formation of a Top 2 pattern or after the price breaks the neckline. Entry at Top 2 is more aggressive and carries higher risk and thus requires strict risk management, while entry after the neckline breakdown is more conservative as the price drop has been confirmed.
- Stop Loss: The placement of the stop loss price can be considered above the previous resistance level, which is around the top of Top 1 or Top 2. This placement aims to limit the risk if the price moves up again and the Double Top pattern fails to form.
- Profit Target: The price placement of take profit can be considered after the Double Top is confirmed which is supported by the neckline break . For reference, you can analyze the nearest support distance after the neckline break and can consider that area as a target.
2. Head and Shoulders
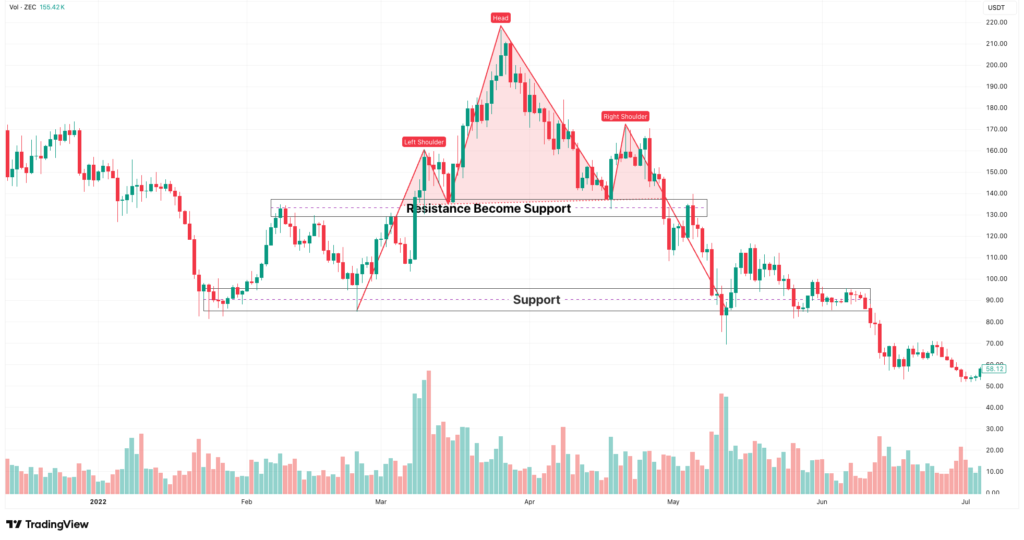
Head and Shoulders is a bearish pattern that seems to form “2 shoulders and 1 head”. Where the swing high or peak areas of the left and right shoulders are approximately the same height while the swing high of the head is higher than the swing high of the left and right shoulders.
This pattern has characteristics that can be recognized by looking at the proximity of the swing high distance at the first (left shoulder), second (head), and third (right shoulder) peaks which can be confirmed by looking at the relationship between the price decline area after the first and second peaks are in the same area, then there is a rejection of the price increase at the third peak in approximately the same area as the first peak increase.
That same area of price decline forms a support which can also be referred to as a neckline. The neckline becomes the basis for traders to see the price reaction after the rejection of the price increase at the third peak because traders can gauge the potential of how far it can fall.
How To Use Head and Shoulders In A Short Position?
Generally, the formation of the Head and Shoulders pattern takes longer to validate than the Double Top pattern. Therefore, this pattern is more suitable for traders who are patient and wait for confirmation of the pattern before making a decision. Here’s the strategy:
- Entry: Short selling position placement is generally done after the price experiences a bullish rejection on the right shoulder. You can place an entry after the price drops through the neckline or support as in the example image above.
- Stop Loss: The placement of the stop loss price is determined based on the height of the swing high or the peak area of the left and right shoulders. That way, if the price reclaims and continues to rise to the swing high of the shoulders and head, then this pattern is not so valid and you have anticipated by placing a stop loss in that area.
Notes:
The risk tolerance level of each trade can be adjusted according to your risk management. The amount of loss incurred may vary based on the value of the position opened in perpetual futures.

Therefore, you need to prioritize your risk management to avoid large losses if the price does not go according to plan.

Read: Managing Risk in Futures Trading With 25x Leverage
- Profit Target: You can analyze the level that has the potential to become the next support after the neckline is broken. The support level can be used as one of the references as a target to be more directed. However, it should be noted that the target can be determined based on your strategy.
3. Descending Triangle
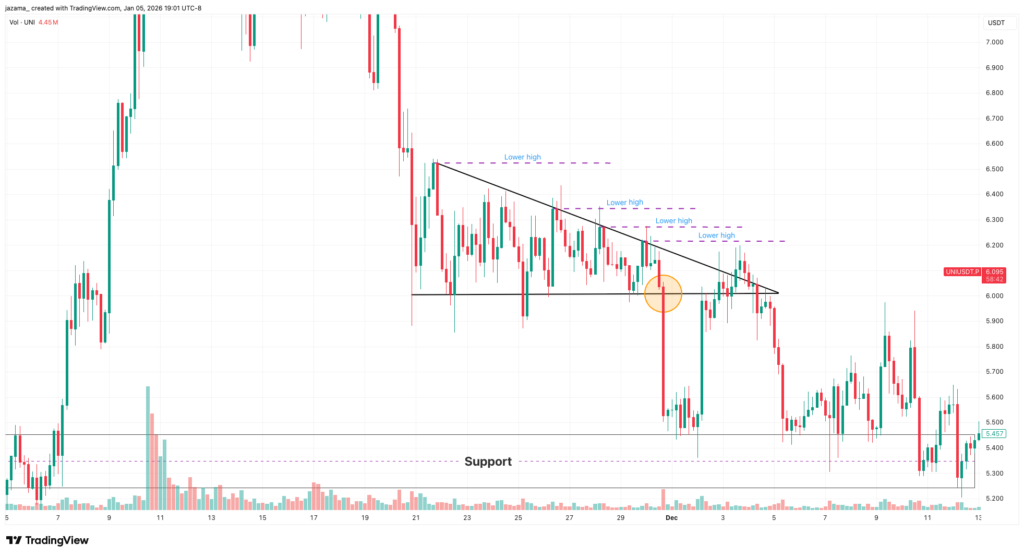
Descending Triangle is a price consolidation pattern that indicates a bearish signal . This pattern has one flat side that forms as support and is characterized by a lower high price structure or the highest price peak that is lower than the previous price peak.
Unlike the Double Top pattern which is relatively easy to identify visually, this pattern requires more precision to observe a series of price bounces from flat support as well as price rejection on each rise as confirmation of the pattern.
If the flat support level and the series of lower highs are connected by a line, a descending triangle pattern will be formed. This pattern can be used as a reference signal for traders to open short selling positions, as it indicates a continuation of the downward trend, where the flat support is potentially broken and the diagonal line acts as resistance.
How To Use Descending Triangle In A Short Position?
Descending Triangle is perfect for traders who use scalping techniques, as the volatility that arises when prices retest flat support or diagonal resistance levels can be utilized to take short-term trading opportunities. Here’s the strategy:
- Entry: The sloping diagonal resistance can be used as an entry reference. The validation of the pattern is strengthened when the price retests the resistance several times but fails to break through and still forms a lower high.
- Stop Loss: Place the stop loss above the previous price peak. A close above this level signals the failure of the pattern and this approach is conservative as the risk is minimized by the relatively close distance of the stop loss.
- Target Profit: Take profit can be placed at the flat support level that this pattern is based on. For a more aggressive approach, the take profit target can also be placed slightly above the next support level, assuming that the flat support has been successfully broken.
4. Bearish Flag
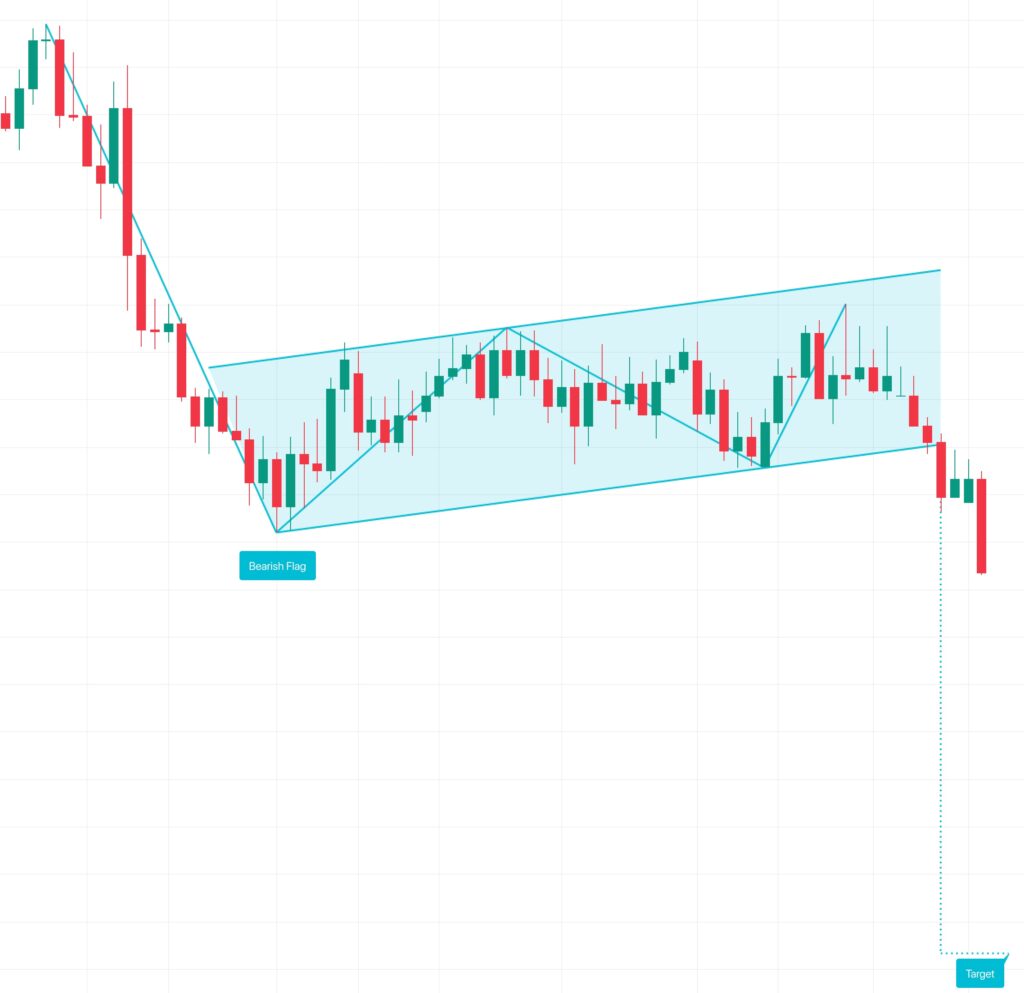
Bearish Flag is a pattern that indicates the continuation of a downward trend and generally forms after a sharp price movement. It is characterized by a price bounce and a temporary consolidation phase, which reflects a pause before a potential continuation of the downtrend.
This pattern is called the Bearish Flag because it visually resembles a “pole and flag” shape. Flag pole represents the previous sharp price drop, while flag depicts the consolidation phase of the price after the correction. Price tends to form higher lows and higher highs, where lowest and highest points move higher than the previous levels.
Beginner traders are often fooled into thinking that the Bearish Flag is a signal of price recovery. In fact, the validation of this pattern can be seen when there is a breakdown of the higher low, which indicates a continuation of the downtrend.
How To Use Bearish Flag In A Short Position?
- Entry: You can use trendlines to identify higher lows and higher highs. Furthermore, the higher low that has undergone several retests, such as the second or third retest, can be used as an entry reference, as it shows an increasingly defined consolidation area.
- Stop Loss: The higher high level can be a reference as a stop loss placement. That way, you have anticipated if the price continues to rise and the Bearish Flag pattern is not so valid.
- Profit Target: Profit targets can be placed at the area of the most recent price drop as the primary approach.
5. Bearish Pennant
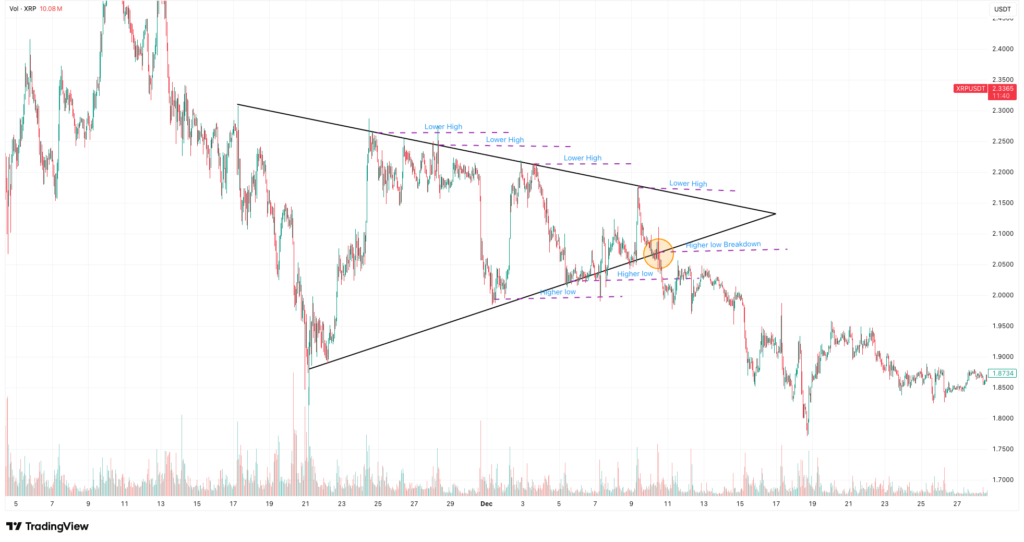
Bearish Pennant and Descending Triangle are similar in that they are continuation patterns of a downward trend. The main difference between them lies in the support and resistance structures that make up the pattern.
In Descending Triangle, support tends to be flat, while resistance is formed from a series of lower highs. In contrast, a Bearish Pennant is formed from a higher low as support and a lower high as resistance, thus forming a symmetrical triangle structure.
Bearish Pennants generally appear after a sharp price drop. The formation of higher lows and lower highs in this phase reflects a temporary consolidation after the correction, before prices potentially resume their downward trend.
How To Use Bearish Pennant In A Short Position?
The Bearish Pennant is suitable for scalping techniques, as the consolidation phase of this pattern generally lasts relatively short before the price resumes its correction. Here’s the strategy:
- Entry: The diagonal resistance of the Bearish Pennant pattern can be used as an entry reference. This area is considered more directional because it reflects the upper limit of consolidation, where prices often experience rejection before continuing the downward trend.
- Stop Loss: Stop loss can be placed above the last price peak (swing high) of the consolidation phase. If the price breaks and closes the candle above that level, then the Bearish Pennant pattern is considered invalid.
- Profit Target: The profit target can be placed at the lowest point of the previous sharp decline (flagpole low) as a conservative approach. Also, you can adjust the target at the next support level according to your scalping plan and market volatility conditions.
Trading Futures on Pintu Pro Web
After knowing the various downtrend chart patterns, you can open short positions such as BTC, SOL, and others directly through Pintu Pro Web. On Pintu Pro Web, you can trade Futures and spot right away!
How to trade Crypto Futures on Pintu Pro Web:
- Go to https://pintu.co.id/
- Click the Open Pro on Desktop button at the top center.
- Register or log in to Pintu Pro Web.
- Go to the Futures section.
- Trade BTC and other cryptocurrencies.
In addition to trading, Pintu also lets you learn more about crypto through various articles on Pintu Academy, updated weekly!
Disclaimer: All articles from Pintu Academy are intended for educational purposes and do not constitute financial advice.
Conclusion
Downtrend chart patterns that can be used as additional references for traders in determining short selling positions in futures trading. The determination of entry, stop loss, and profit targets discussed earlier is intended as educational information, not an invitation or suggestion to make transactions. Keep in mind that the chart patterns formed have the potential to produce false signals, so it is not recommended to make it the only reference in making trading decisions. To increase the validity of the analysis, traders are advised to conduct other additional confirmations such as fundamental analysis.