
In the past week, the overall crypto market showed a steady rally with little volatility, where Bitcoin (BTC) and other major assets saw significant gains despite pressure from macro and regulatory factors. The total crypto market capitalization stands at around $3.2-3.3 trillion USD, with BTC dominating at around 57-60%. Market sentiment is shifting from”Fear” to “Normal” ( Fear & Greed index is at 49 as of writing), driven by ETF inflows and institutional adoption, but limited by geopolitical and regulatory uncertainty.
Overall, market sentiment indicates that the market is consolidating after the rally formed in the past week. Currently, the focus will be on technical analysis where prices of assets with large market capitalization are facing resistance.
Article Summary
- Trump Threatens 8 Countries with Tariffs: The United States plans to impose a 10% tariff on Denmark, Germany, France, the Netherlands, Belgium, Sweden, Norway and Finland.
- Technical Analysis of BTC, ETH, and SOL: Bitcoin formed a lower high price pattern which is an indication of a downtrend on the 1-week timeframe, Ethereum failed to break the $3,400 resistance level, and Solana has a potential bearish trend after failing to break the $147 resistance level.
- Investor Confidence Remains High in Decentralized Finance Sector: In contrast to the crypto market, DeFi’s Total Value Locked (TVL) has relatively increased from US$120 billion to US$130 billion.
This Week’s Potential News

Market volatility and uncertainty could occur because US President Donald Trump threatened to impose a 10% tariff on 8 European countries: Denmark, Germany, France, the Netherlands, Belgium, Sweden, Norway and Finland. Not only that, tariffs could be raised to 25% if the United States’ desire to control Greenland is not met.
BTC Analysis
Upside Hindered by 21 EMA Indicator
Last week, Bitcoin showed its strength by breaking the resistance level at $94,000 and reaching almost $98,000. However, Bitcoin experienced a significant drop this morning after a rejection from the 1-week timeframe 21 EMA indicator. At the time of writing, Bitcoin is trading at $93,365, lower than the resistance broken in last week’s rally.
Some crucial aspects to consider:
Bitcoin 1 Week Timeframe
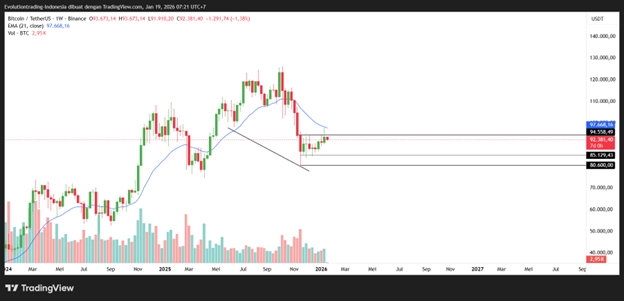
- On the 1-week timeframe, Bitcoin is showing upward momentum that is being blocked by resistance.
- Structurally, on the 1-week timeframe, Bitcoin formed a lower high, which is part of the downtrend market structure.
Bitcoin 1 Day Timeframe
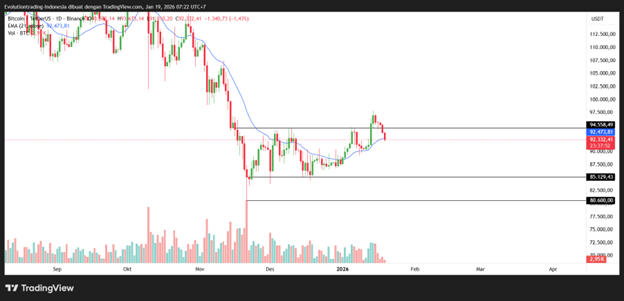
- On the 1-day timeframe, Bitcoin was seen testing the 21 EMA indicator, but fell back below the resistance at $94,000.
- The nearest Support levels are around $85,000 and $80,000.
Bitcoin is predicted this week to decline to around $85,000 amid regulatory and geopolitical pressures, unless a catalyst occurs that could make the market bullish again.
ETH Analysis
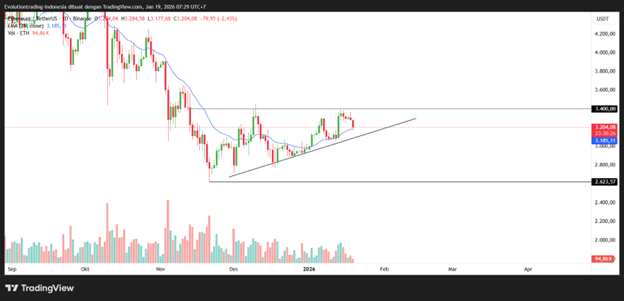
Similar to Bitcoin, Ethereum experienced a significant drop earlier this week. Ethereum experienced a rejection from the $3,400 resistance level and is currently testing the 21 EMA on the 1-day timeframe.
If Ethereum cannot stay above the 21 EMA on the 1-day timeframe, it is likely that Ethereum could drop to the $2,600-$2,700 price area which is its daily support.
SOL Analysis
Strong Rejection of Resistance
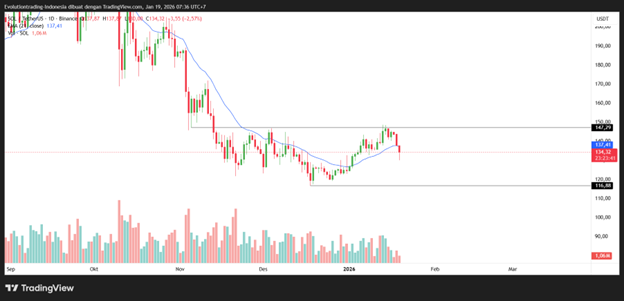
Solana also experienced a significant drop earlier this week. Solana experienced a rejection from the $147 resistance level and broke the 21 EMA on the 1-day timeframe, which could be an early indication of bearish momentum. The closest support for Solana is in the $116-$117 area.
In addition, Solana’s bearish condition may bring its ecosystems, such as RAY tokens, JUP, and others, to the downside.
On-Chain Analysis
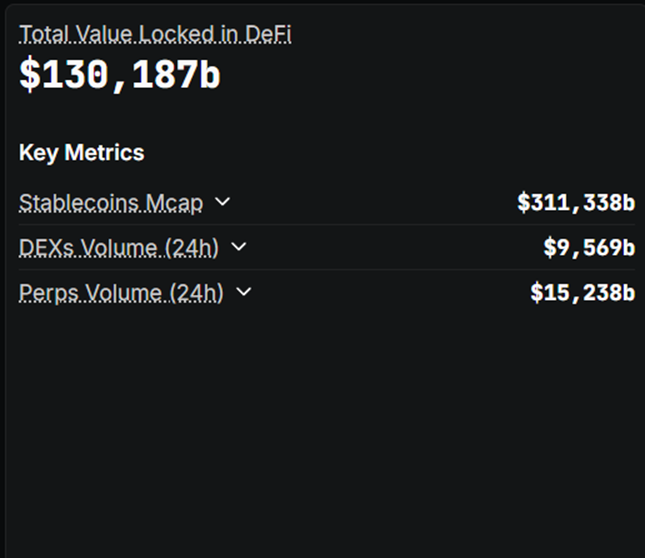
In the past week, the locked value (TVL) across all decentralized finance networks has risen relatively from around US$120 billion to US$130 billion today. The increase in locked value indicates that investors still have confidence in decentralized finance, but relatively do not play aggressively because they prioritize income from DeFi instead of capital gains from traded crypto assets.
Macroeconomic Analysis
The crypto market is heavily influenced by global macro conditions, where digital assets like BTC and ETH are considered as”alternative stores of value” amid fiat instability. Here are the main factors of the past week:
- US Inflation and Monetary Policy: US CPI inflation rose 0.3% month-on-month (2.7% YoY), in line with expectations, prompting BTC to briefly surge to $92,500. However, Fed rate cut expectations slowed, with potential rates falling to 3% by end-2026. This pressured risk assets, although Fed liquidity supported the rebound.
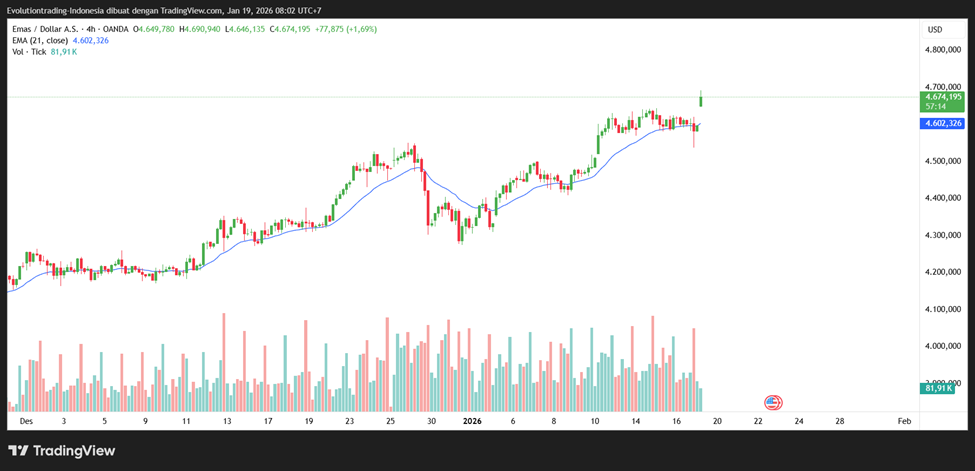
- Global Debt and Inflation: High US debt is driving demand for scarce assets like BTC and gold (gold rose to $4,640/oz).”Sticky” inflation and central bank policy divergence (e.g., China cut interest rates by 0.25%) made cryptocurrencies highly volatile, but sent gold much higher.
Crypto Asset Performance in the Last Week
Top Performing Crypto Assets
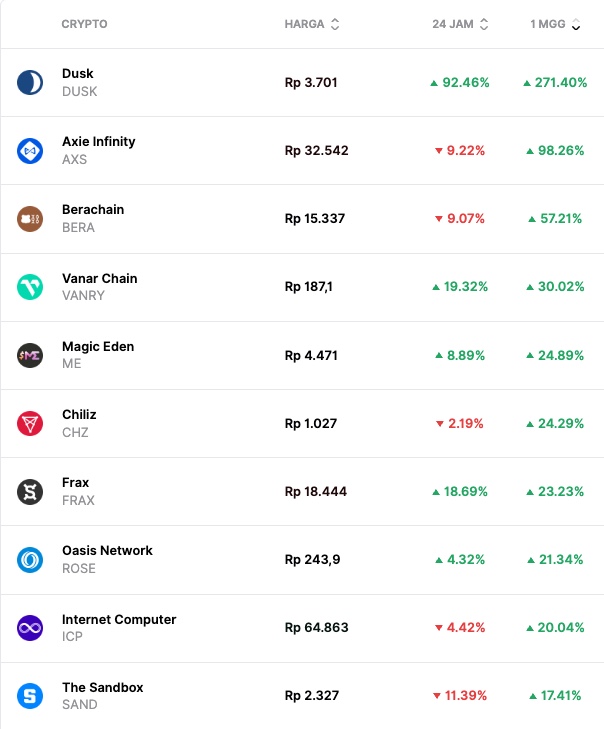
- Dusk ($DUSK) +271.40%
- Axie Infinity ($AXS) +98.26%
- Berachain ($BERA) +57.21%
- Vanar Chain ($VANRY) +30.02%
Worst Performing Crypto Assets
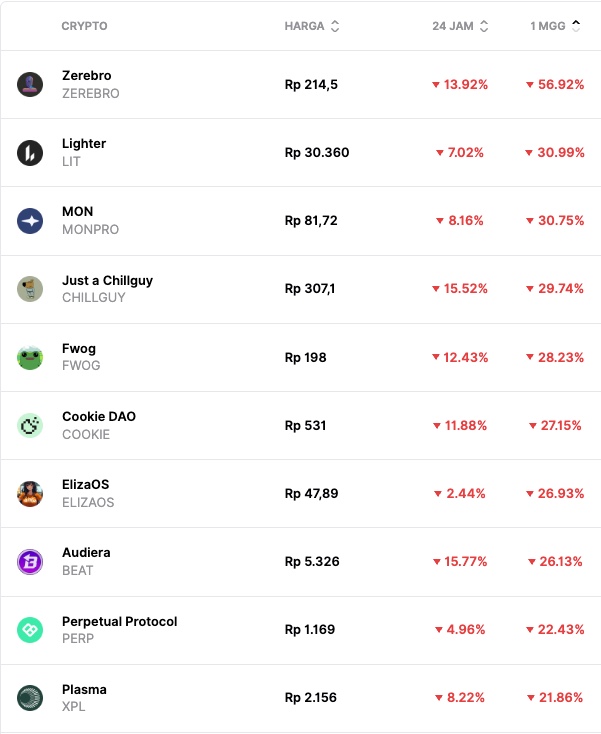
- Zerebro ($ZEREBRO) -56.92%
- Lighter ($LIT) -30.99%
- MON ($MONPRO) -30.75%
- Just a Chillguy ($CHILLGUY) -29.74%
Disclaimer: All articles published on Pintu Academy are for educational purposes and do not constitute financial advice.