
The crypto market faced significant pressure this week. Sentiment indicators point to heightened fear among market participants, coinciding with outflows from institutional investment products. Furthermore, investors are anticipating a packed macroeconomic agenda, particularly the Fed’s interest rate decision.
Key Takeaways
- Deteriorating Market Sentiment: Market psychology has shifted drastically towards the negative, marked by the Fear & Greed Index dropping to 29 (Fear zone), far lower than the neutral position seen last week.
- Technical Pressure on Major Assets: Bitcoin faced rejection at the $97,076 level with the potential to drop to the $80,600–$85,129 support range, while Ethereum and Solana are also at risk of correction if they fail to maintain their respective crucial support areas.
- Institutional Fund Outflows: Institutional investors are showing a cautious stance, evidenced by consistent net outflows from Bitcoin Spot ETFs since mid-January, including a significant outflow (-8.02K BTC) on January 21.
- Anticipation of Macroeconomic Volatility: The market is bracing for high volatility this week (January 26–30, 2026) due to a packed economic agenda, with a primary focus on the Fed’s interest rate decision and the US President’s speech.
Market Sentiment: Fear Dominates the Market
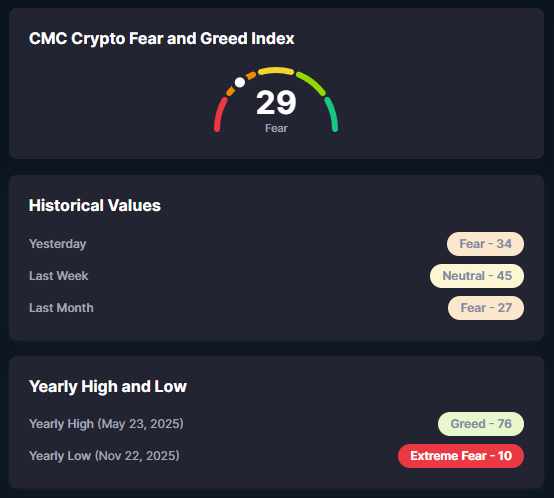
The market psychology has changed drastically compared to last week.
- TheFear & Greed Index is currently at 29, which is categorized as the fear zone.
- This figure shows a sharp drop in sentiment compared to last week, when the index was at a neutral level with a score of 45.
- For historical comparison, the annual high has touched 76 (greed), while the low was 10 (extreme fear).
Technical Analysis of BTC, ETH, and SOL
Bitcoin (BTC/USDT)
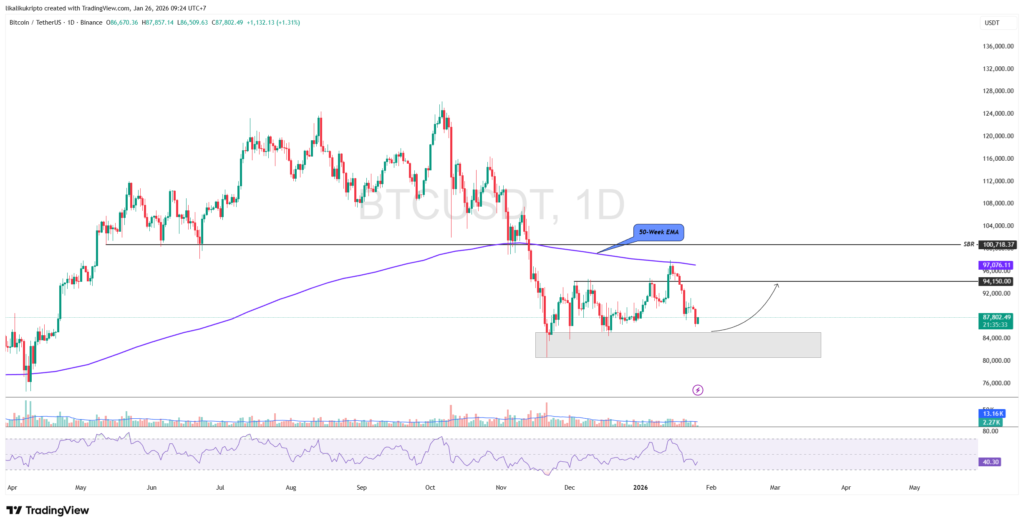
- Current Conditions: Bitcoin’s upward trajectory stalled and experienced rejection when it touched the dynamic resistance of the 50-Week EMA at $97,076.
- Downside Potential: As a result of the rejection, the price has the potential to weaken to the support area of $80,600 – $85,129. This zone is considered a solid stronghold at the moment.
- Bullish Scenario: The price reaction at the support area will be decisive; if it is able to rebound, Bitcoin is expected to rise slowly with the main target at $94,150 (December 3, 2025, high).
On Support and resistance in crypto trading: Understanding Support and Resistance in Crypto Trading – Pintu Academy.
Ethereum (ETH/USDT)
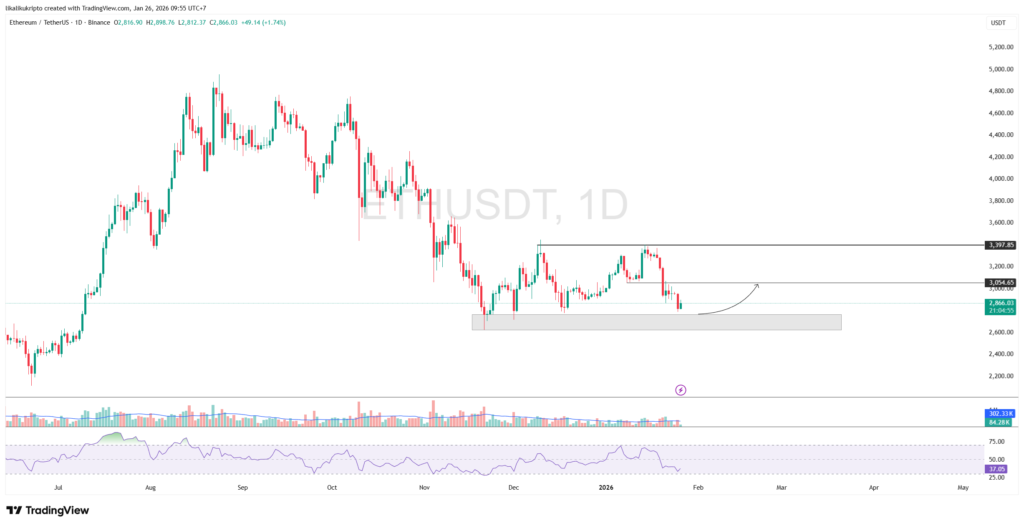
- Current Conditions: High selling pressure emerged when ETH touched the $3,397 resistance, causing a price drop in the past week.
- Support Area: The current decline is almost touching the support area at $2,623 – $2,765.
- Projection: Rebound opportunities are still open as long as the price is able to stay above the support area. If it manages to rise, the upside target is at the psychological level of $3,000, which also serves as the SBR (Support Become Resistance) level.
Solana (SOL/USDT)
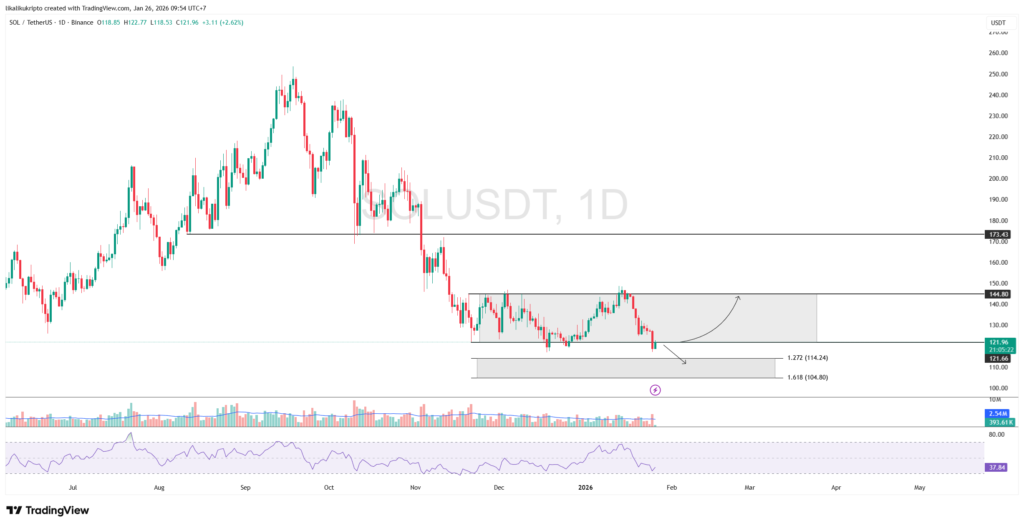
- Current Conditions: SOL’s daily candle close this morning gives an unfavorable signal as it is below the lower boundary of the consolidation area($122.17).
- Critical Zone: SOL price needs to move above the $122.17 level again to avoid negative market sentiment and provide a rebound opportunity.
- Downside Risk: If the price continues to stay below this level, the decline could potentially continue towards the next support in the range of $108.80 – $114.24.
Onchain Analysis: Institutional & Exchange Funds Flow into Crypto
Fund flows showed cautious signals from both large investors and the market in general.
Bitcoin Spot ETF Netflow (Institution)
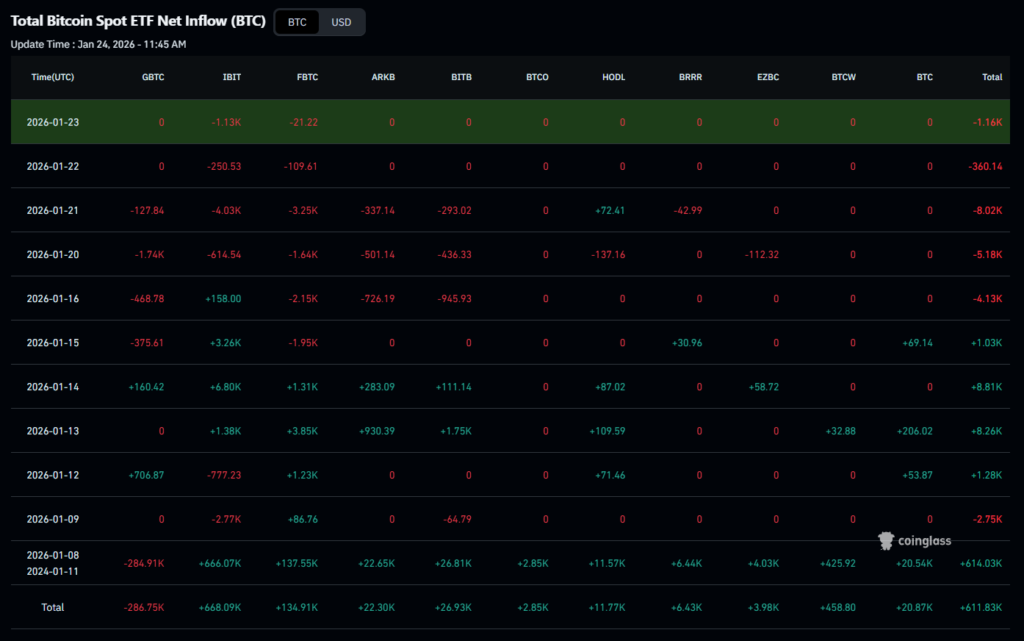
A negative trend was seen from institutional investment products with consistent net outflows towards the end of January:
- January 23rd: Total outflow of -1.16K BTC.
- January 21: The biggest selling pressure of the week, with outflows reaching -8.02K BTC.
- Since January 16, ETFs have continued to record outflows, reversing the positive trend at the beginning of the month.
Bitcoin Exchange Netflow (On-Chain)
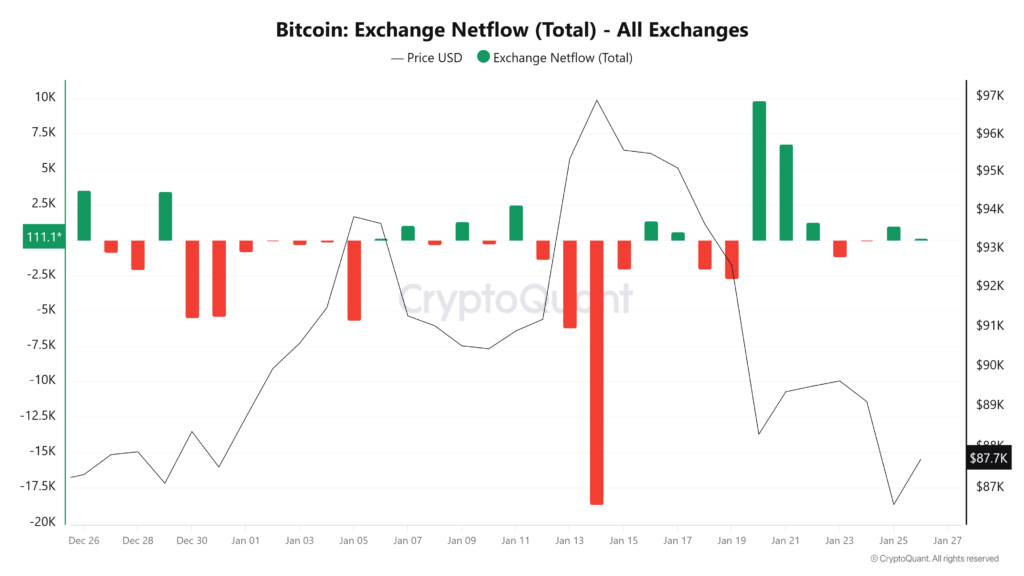
The Exchange Netflow chart is also an important highlight of the week. Amidst falling prices, the movement of funds on exchanges showed volatility that needs to be watched out for.
If Netflow shows a high positive number (inflow), there is selling pressure from market participants. Conversely, an outflow would be an early signal that investors are starting to accumulate.
Important Economic Calendar (January 26-30, 2026)
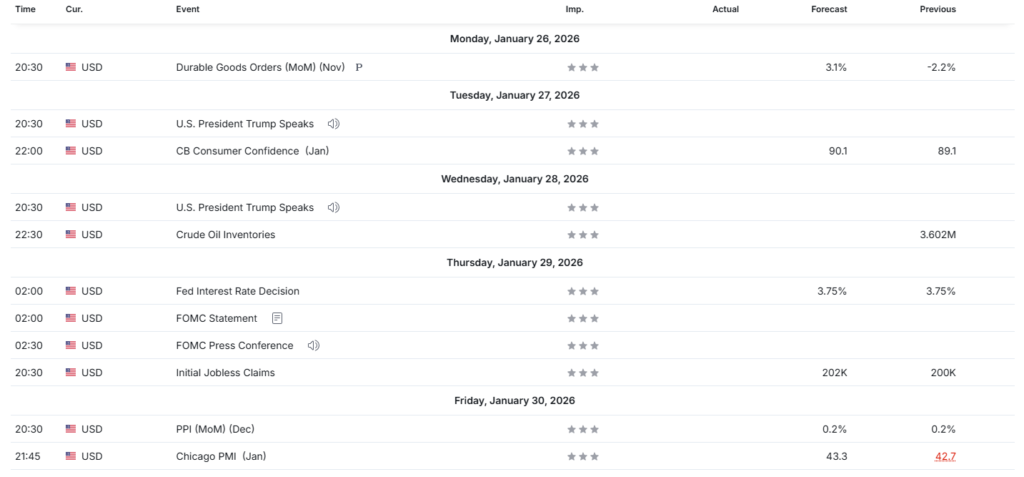
Market volatility is expected to peak this week due to a series of macroeconomic agendas in the United States:
- Tuesday & Wednesday, January 27-28: Market participants will be monitoring a speech from US President Donald Trump.
- Wednesday, January 28th: Crude Oil Inventories data release.
- Thursday, January 29 (Key Moment): The main focus will be on the Fed Interest Rate Decision at 02:00, followed by the FOMC Statement and Press Conference. On the same day, Initial Jobless Claims data will also be released.
- Friday, January 30: Release of monthly PPI (Producer Price Index) data.