
At the start of a bear market, everyone always asks the same question: when will the bear market end, and what is the bottom price? This is also the case in 2026. With Bitcoin already correcting more than 40%, investors and traders have already accepted that we are in a bear market. However, many are still caught off guard, as we’ve seen several high-volume liquidations since the 10th October event in 2025. So, will the crypto bear market end in 2026? What is the price when Bitcoin bottoms? This article will break it down in detail.
Key Takeaways
- We Are in the Deepest Stages of the Cycle: Bitcoin is currently in a confirmed bear market, trading approximately 46% below its October 2025 peak and sitting below the crucial 200-week EMA. However, historical four-year cycle data suggests the ultimate market bottom will likely form between March and October 2026.
- Institutions Are Softening the Blow: Unlike the brutal 80% drawdowns seen in the 2018 and 2022 bear markets, the massive presence of Wall Street and spot Bitcoin ETFs is acting as a liquidity shock absorber, which may prevent the market from falling to those historical extremes.
- Three Potential Bottom Scenarios: Depending on market strength, Bitcoin’s accumulation zone will likely land in one of three ranges: holding the current $60,000 to $65,000 level, dropping to the mid-level support of $50,000 to $55,000, or a final capitulation to $40,000 to $44,000 (which perfectly aligns with the current Long-Term Holder average buy price).
- The Fed is the Ultimate Catalyst: The transition from a bear market to a new bull phase heavily depends on global liquidity. Anticipated interest rate cuts by the Federal Reserve in the second half of 2026 are expected to be the primary trigger for market recovery.
The Current State of the Crypto Bear Market in 2026
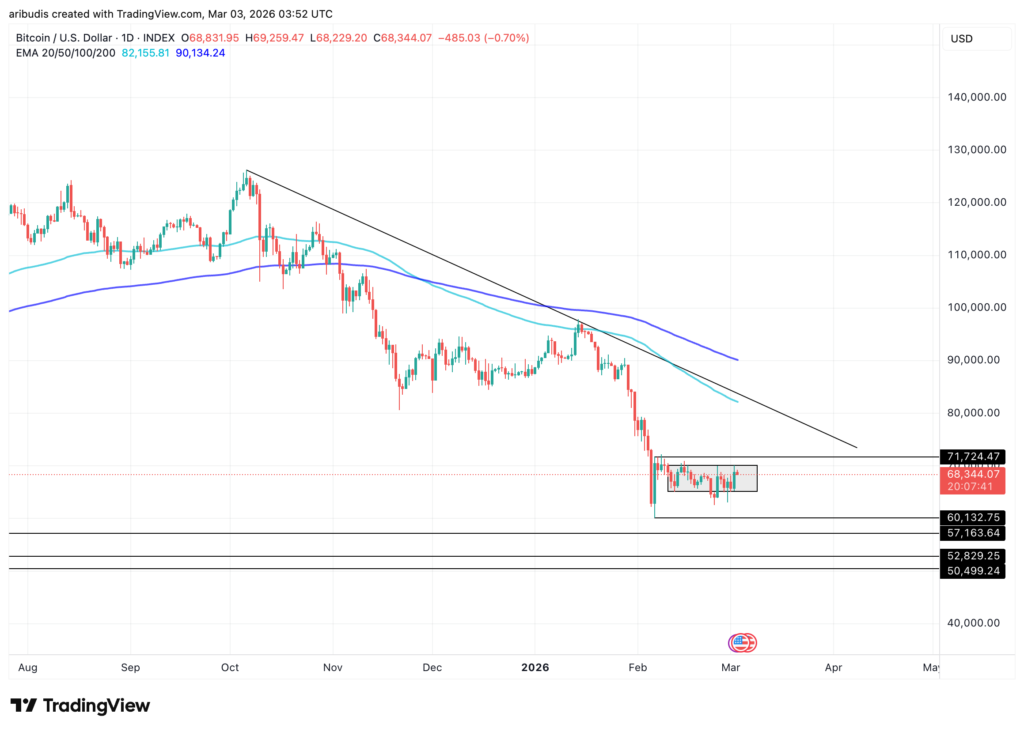
Currently, Bitcoin is -46% from its top in October 2025. The 10th October liquidation event became the start of Bitcoin’s downtrend. In early January, Bitcoin finally made its lower high at around $97k. However, it is now in a small consolidation phase around the $65k to $70k range since the start of February.
Additionally, Bitcoin has tried to break through the $70k resistance three times. It spiked toward $70K before getting sharply rejected near the end of February. Interestingly, there is a similar pattern in Q1 during previous bear markets.
- 2018: Feb low, March rally, April dump.
- 2022: Feb low, March rally, May dump.
- 2026: We have the February low around $60k.
Bitcoin has also lost one of the major high-timeframe signals, which is the EMA 200 weeks. This has been a pretty accurate signal for a bull and bear market. Bitcoin broke through the 200-week EMA in the third week of February. During the last bear market (2022), Bitcoin spent almost 9 months below the 200-week EMA.
Bitcoin Bottoms and Tops: 2026 Bear Market
Bitcoin 4-Year Cycle Analysis
The Bitcoin four-year cycle is a theory that Bitcoin moves in a four-year interval, specifically the bull market tops and bear market lows. Some people think that this pattern is imagined and that the context surrounding the cycle matters more. Strong proponents against the theory argue that the theory is no longer valid as Bitcoin now has new kinds of participants: institutional investors from TradFi. However, the fact remains that Bitcoin has yet to deviate from the historical four-year cycle.
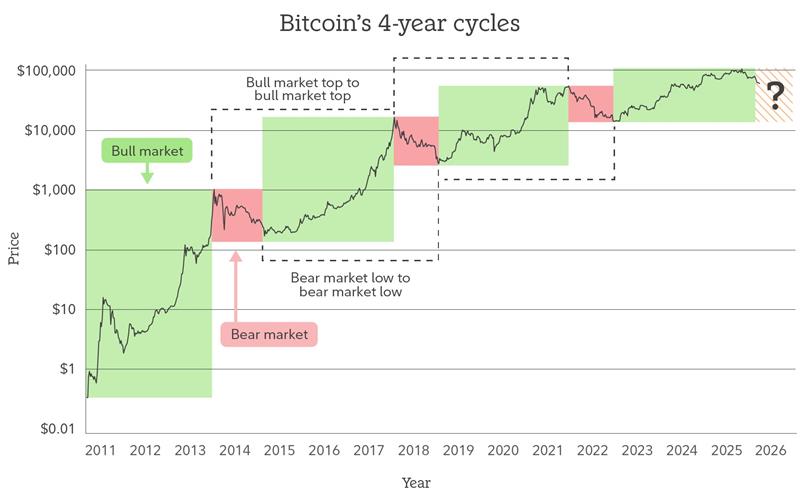
Bitcoin 4-year cycle chart. Source: Fidelity.
The image above visualizes Bitcoin’s four-year cycle pattern since 2011. Even though there are always a couple of months of deviation in each cycle, the patterns seem to more or less repeat. However, as Fidelity explained in the article, the four-year cycle theory should be one of the many reference points, not as a framework for your strategy.
The Bitcoin four-year cycle centers around a major event: Bitcoin halving. Every 4 years, Bitcoin’s supply is halved, so the supply will keep decreasing. The pattern is usually similar: Bitcoin’s bear market low occurs 1 to 1.5 years before halving, while the bull market top usually happens 1.5 years after halving.
Bitcoin four-year cycle phases:
| Bitcoin Halving | Post-Halving ATH | Post-ATH Bear Market Phase | Bear Market Low to Bear Market Low |
| November 2012 | $1,160 (November 2013) | December 2013 to August 2015. Lowest price: $152 (-86% from ATH) | November 2011 to August 2015 is 1368 days (3 years 9 months). |
| July 2016 | $19,666 (December 2017) | January 2018 to December 2018. Lowest price: $3,122 (-83% from ATH) | August 2015 to December 2018 is 1214 days (3 years and 4 months). |
| May 2020 | $69,000 (November 2021) | December 2021 to November 2022. Lowest price: $15,478 (-78% from ATH) | December 2018 to November 2022 is 1438 days (3 years 11 months). |
| April 2024 | $126,200 (October 2025) | November 2025 to 2026. Lowest price: $59,900 (-53% from ATH) – still ongoing | November 2022 to 2026? |
The latest cycle is really similar to 2021 when it comes to the bull market top after halving. If we extrapolate the previous bear market low to the potential bear market low in the current cycle, we will find the bottom around March (similar period to the 2014 cycle) or August to October 2026 (similar to the 2011 and 2019 cycle).
On-Chain Data and Metrics
Besides the historical four-year cycle, many investors and traders turn to Bitcoin on-chain data. Through Bitcoin’s network on-chain metrics, you can analyze the movement of long-term holders, calculate miners’ revenue, the average entry of holders, etc. Some of the most popular Bitcoin on-chain data are Net Unrealized Profit/Loss (NUPL), MVRV Score, and Puell Multiple. During past cycles, these on-chain data can be helpful in identifying tops and bottoms.
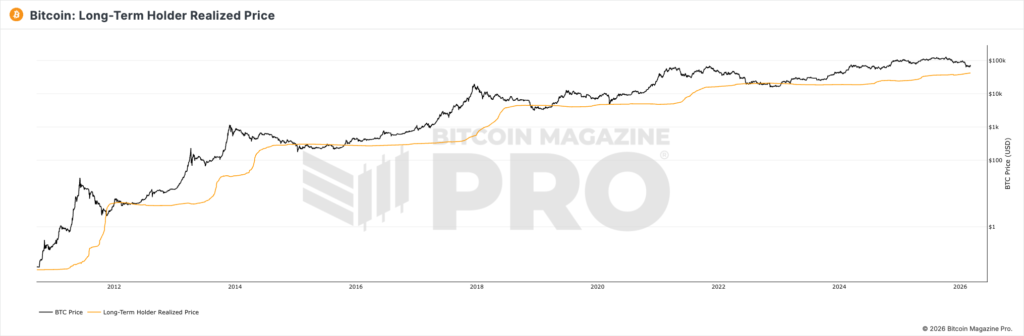
Long-term holder realized price. Source: Bitcoin Magazine Pro.
According to Bitcoin Magazine Pro, Long-term Holder Realized price is an indicator that calculates the average buy price of long-term investors of Bitcoin (155 days or more). This metric reflects the conviction of long-term holders who tend to accumulate and hold through volatility, viewing Bitcoin as a long-term investment.
The LTH Realized Price can act as an indicator of strong support levels during bear markets, as these are prices where long-term holders buy and hold. During the 2022 bear market, Bitcoin spent around 9 months around the LTH Realized Price, while it only spent around 4 months in the 2018 bear market. The current LTH Realized Price is around $42,269 (9 March 2026).
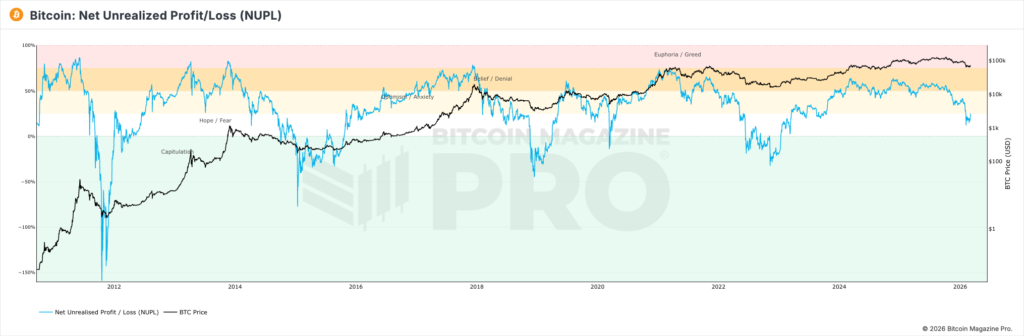
Source: Bitcoin Magazine Pro.
NUPL or Net Unrealized Profit Loss is an on-chain indicator that estimates the total unrealized profits/losses in Bitcoin held by investors. The key principle of this tool is in the ratio between price and Bitcoin investors taking profit. When the price rises much faster than profit taking, we see that the market is overheating, where investors are greedy (red band).
Currently, Bitcoin is still in the fear zone. The unique thing is that during the 2023-2025 bull market, Bitcoin never touches the euphoria/greed zone. This is because most investors now know to take profit when Bitcoin is increasing, which is a sign of maturing market participants.
Source: Bitcoin Magazine Pro.
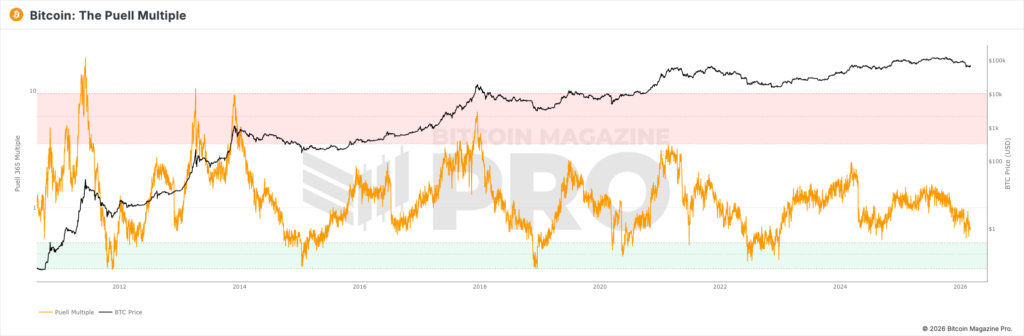
The Puell Multiple is an on-chain indicator that looks at the supply side of Bitcoin’s economy. It explores market cycles from a mining revenue perspective. Bitcoin miners are compulsory sellers because they need to cover the costs of mining hardware. During peak mania, miners’ profits are higher than usual. Conversely, miners’ profits are at an all-time low during bear markets.
Although it has failed to touch the red box in the two previous bull markets, The Puell Multiple accurately identified the bottom in the 2022 bear market, the 2018 bear market, and the Covid crash. So, its accuracy at spotting market bottoms is still excellent.
Macroeconomic Environment Influencing Crypto in 2026
Bitcoin is inherently a “risk-on” asset. When borrowing money is cheap and cash is abundant, investors are willing to take risks on volatile assets like cryptocurrency. Conversely, when capital tightens, risk assets are the first to be sold off.
Here are the key things to watch out for BTC:
- The Fed’s Balancing Act: Throughout this bear market, the US Federal Reserve and other central banks have been closely monitoring inflation and employment data. The timing of the Bitcoin bottom depends heavily on when the Fed definitively pivots toward a more accommodative monetary policy (cutting interest rates).
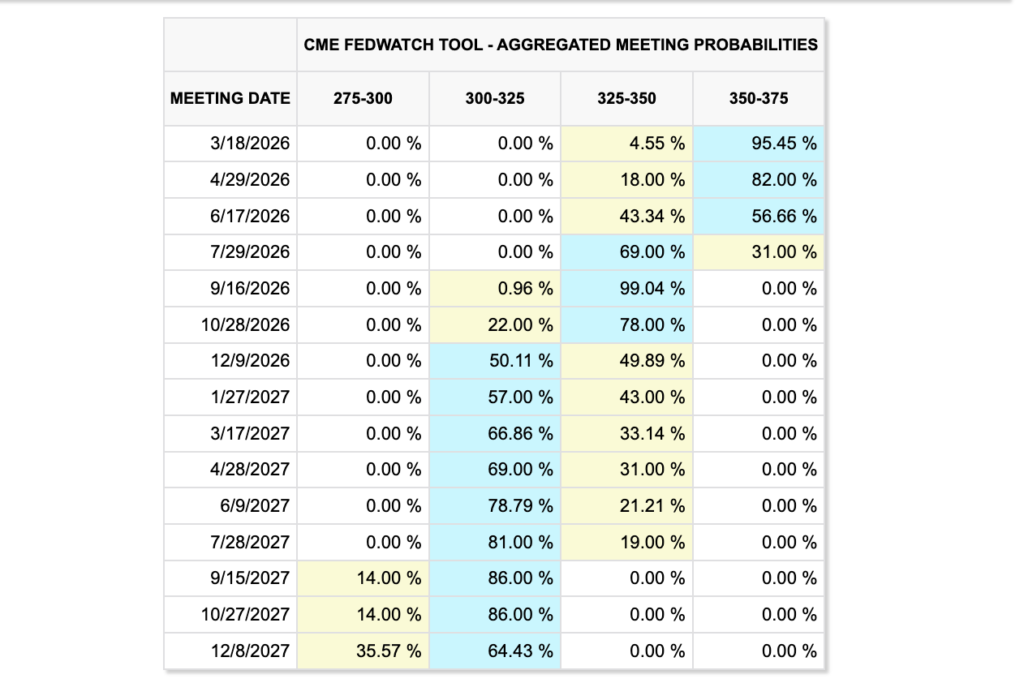
- Rate Cuts in 2026: The latest data (March 10) shows that the Fed will likely only cut rates once in 2026. However, according to the CME Group data, the Fed will cut interest rates on July’s FOMC meeting. After that, economists expect a 50% chance for the Fed to cut rates in December 2026. All of this will likely depend on economic data in the coming months and how the Iran conflict unfolds.
- Gold vs. BTC: Gold and Bitcoin are usually inversely correlated. However, the past three years have shown that they can move in tandem. The key difference between gold and Bitcoin is that gold moves in a longer timeframe. When Bitcoin moves, it moves quickly within a short timeframe (usually 1-2 years). On the contrary, gold has been constantly rising since the bottom in 2015.
Institutional Adoption and Regulatory Clarity
The landscape of the 2026 crypto bear market is fundamentally different from the crashes of 2018 or 2022, largely due to who is holding the asset. Wall Street is now fully entrenched in the space. BlackRock, Citadel, VanEck, Visa, etc., are now active players in the crypto industry. Many of the big companies are no longer watching from the sidelines.
The approval and maturation of spot Bitcoin ETFs have fundamentally altered market dynamics. While retail investors might panic-sell during a bear market, institutional managers operate on longer time horizons. ETF inflows and outflows create a massive layer of liquidity that acts as a shock absorber, preventing the catastrophic 80% drawdowns seen in previous cycles. Large inflows and outflows will likely be a key catalyst for Bitcoin.
Could Bitcoin Drop Further? Where is the Bottom?
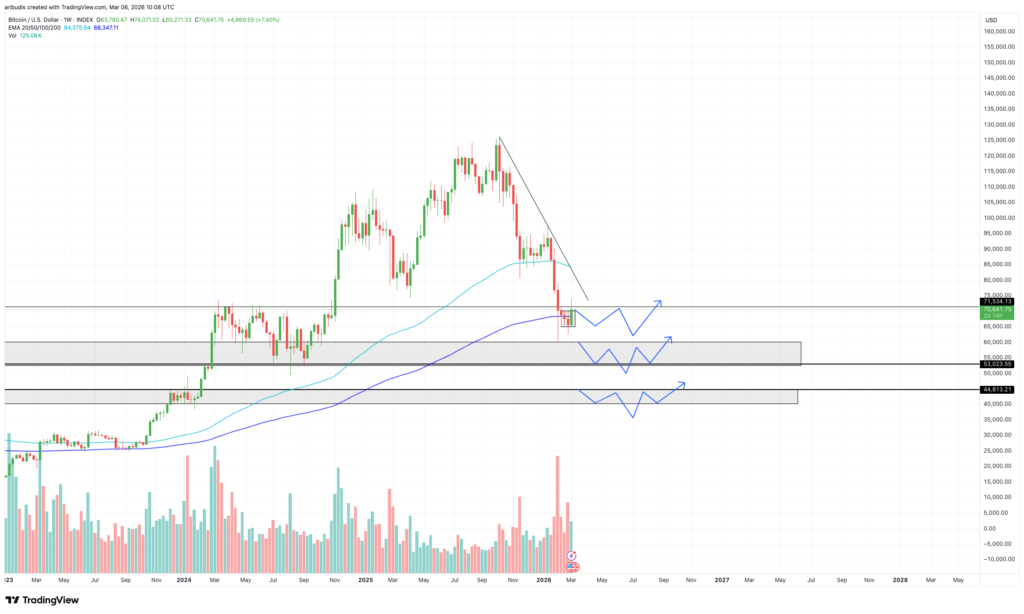
If we are looking at high-timeframe price charts like above (weekly charts), there are three scenarios and three price ranges that could potentially serve as Bitcoin’s accumulation areas for this year’s bear market:
- Scenario #1: The $60,000—$65,000 accumulation area. If the current consolidation zone holds, Bitcoin has entered its accumulation phase and is no longer in a downtrend. If it breaks $60k and continues lower, this scenario is invalidated.
- Scenario #2: The $50,000—$55,000 accumulation area. This is the next strong support zone if the $60,000 level fails to hold. This price range acted as a strong support during the 2024 bull market and was a crucial price level throughout 2021 and 2022.
- Scenario #3: The $40,000—$44,000 accumulation area. This price range is the final support zone before Bitcoin enters dangerous territory. It was also a significant accumulation area in 2023 before Bitcoin rallied back to its 2021 ATH (All-Time High).
If we define a bear market as starting when BTC drops below the 200-week EMA, this period typically lasts for about 5 to 9 months (based on the previous two bear markets). A good framework to identify market bottoms is to look out for patterns such as a rounding bottom or a Wyckoff accumulation phase. Market bottoms don’t happen overnight; it is a process that takes time as more buyers step in.
Additionally, Dollar-Cost Averaging (DCA) is a very effective strategy during the bear market to ensure investors are ready when the next bull market comes. Combine DCA with identifying accumulation phases, and you will be set to buy Bitcoin on the cheap.
Conclusion: Will the Crypto Bear Market End This Year?
Will the crypto bear market end in 2026? Based on the convergence of historical cycles, on-chain metrics, and shifting macroeconomic tides, all signs point to yes. It will likely end by late 2026. While the exact week or month of the ultimate Bitcoin bottom is impossible to pinpoint, the data clearly shows we are in the deepest stages of the value zone.
However, the speed of the recovery will ultimately depend on global liquidity. If central banks begin easing interest rates in the latter half of 2026 as projected, that injection of capital will likely act as the catalyst needed to transition the market from a downtrend into the accumulation phase.
Trying to perfectly time the bottom is a risky game that often leaves retail investors sidelined. Instead of waiting for a magical technical signal, the smartest play right now is to use a Dollar-Cost Averaging (DCA) strategy. Accumulating fundamentally strong assets like Bitcoin while the broader market is fearful is historically the most reliable way to position yourself for massive gains in the coming bull market.
Frequently Asked Questions (FAQs)
What is the lowest price Bitcoin will hit in 2026?
While no one can predict the exact bottom, historical cycle data suggests Bitcoin could find its ultimate floor between $50,000 and $55,000 in 2026. A worst-case scenario could temporarily push prices toward the $37,000 to $40,000 range. However, heavy institutional ETF support makes a drop of that magnitude much less likely today than in past crypto winters.
How long do crypto bear markets typically last?
Historically, a cryptocurrency bear market lasts anywhere from 10 to 18 months. For Bitcoin, the timeline usually stretches roughly one year from its previous all-time high before finding a bottom. If the current cycle follows historical precedent, the market should establish a solid foundation by late 2026 before beginning its next structural recovery.
What are the best altcoins to buy during a bear market?
During a bear market, it is crucial to focus on altcoins with strong fundamentals and a growing and active ecosystem. Historically, Ethereum (ETH) and Solana (SOL) have shown the highest resilience and bounce-back potential. However, there will always be some altcoins that came out of the bear market as the winner.
When to buy Bitcoin during a bear market?
The safest and most effective strategy for buying Bitcoin during a downturn is Dollar-Cost Averaging (DCA). Instead of trying to perfectly time the absolute bottom, invest a fixed amount of money at regular intervals (such as weekly or monthly). Data consistently shows that accumulating Bitcoin when it is down 50% or more from its all-time high yields massive returns for investors willing to hold.
What is a crypto bear market?
A crypto bear market is a prolonged period where cryptocurrency prices decline by 40% or more from their recent highs and remain suppressed for months or even years. It is characterized by extreme negative investor sentiment (“Extreme Fear”), low trading volume, and macroeconomic pressures. Unlike a quick, short-term price correction, a bear market effectively flushes out speculative hype and resets the market cycle.
References
- @Jesseolson, “On Oct 10, 2025, I posted this #Bitcoin bear market road map.”, X, accessed on March 3, 2026.
- Fidelity, “Bitcoin’s 4-year cycles explained”, accessed on March 4, 2026.
- Decentralized Dog, “VanEck CEO Says Bitcoin Bear Market Bottom Is Forming in 2026”, CoinMarketCap, accessed on March 5, 2026.