
The cryptocurrency market is entering mid-December with a cautious mood. After considerable volatility at the beginning of the month, market participants are now faced with a tug-of-war between selling pressure and price recovery efforts. Here is an in-depth analysis of this week’s market conditions.
Article Summary
- The Fear and Greed Index is consistently at the same level as last week at 24, much better than last month.
- This week has been a busy period for the US government, with back-to-back macroeconomic data releases on December 16, 18, and 19, 2025.
- Bitcoin is still on the uptrend line despite experiencing considerable volatility in recent days.
Market Psychology: Fear Still Dominates
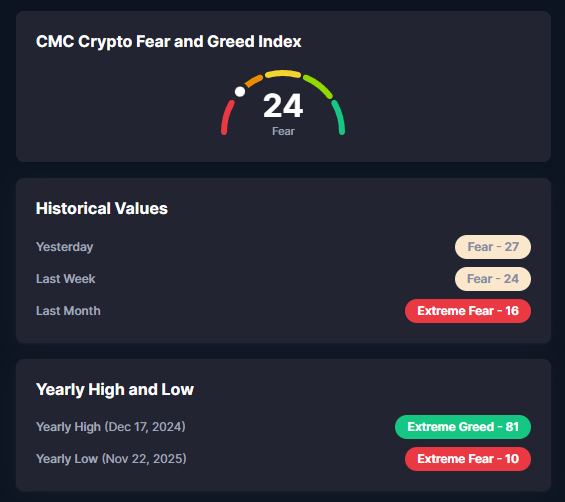
Starting this week, global investor sentiment has not fully recovered. Based on Fear & Greed Index data, the market is still stuck in the Fear zone with a score of 24. This figure is stagnant compared to last week which was also at the 24 level, but shows a slight improvement compared to last month which had touched the Extreme Fear level at 16.
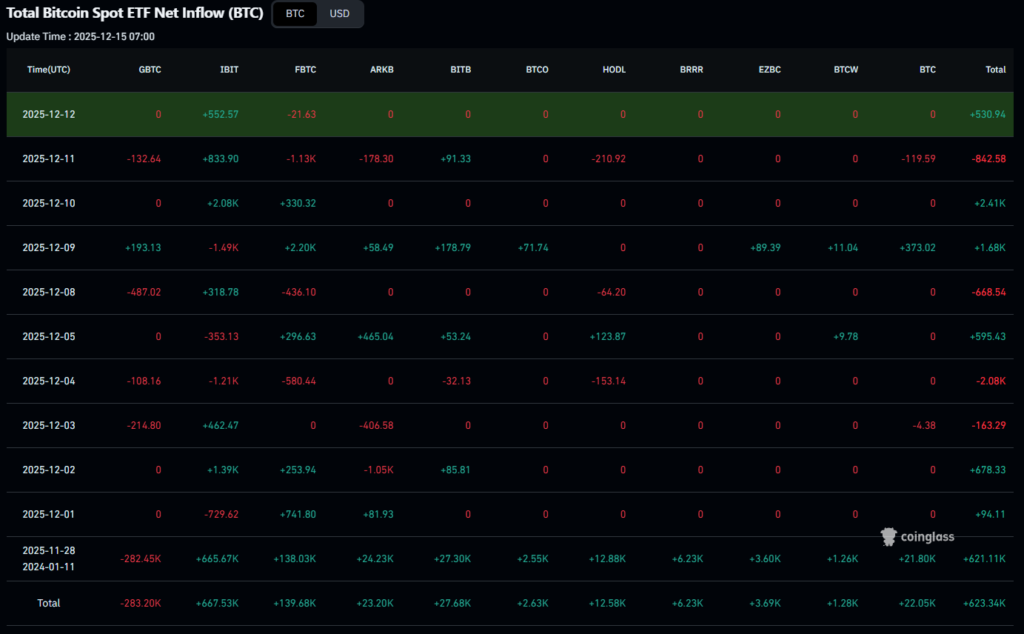
This uncertainty is also reflected in institutional fund flows. Bitcoin Spot ETF Net Inflow data shows sharp volatility after experiencing a massive outflow of -842.58 BTC on December 11. The market was surprised by positive inflows (+530.94 BTC) on December 12, 2025. This drastic change in a short period of time indicates that large institutions are still weighing the next direction of the market.
Macroeconomic Highlights: A Busy Week
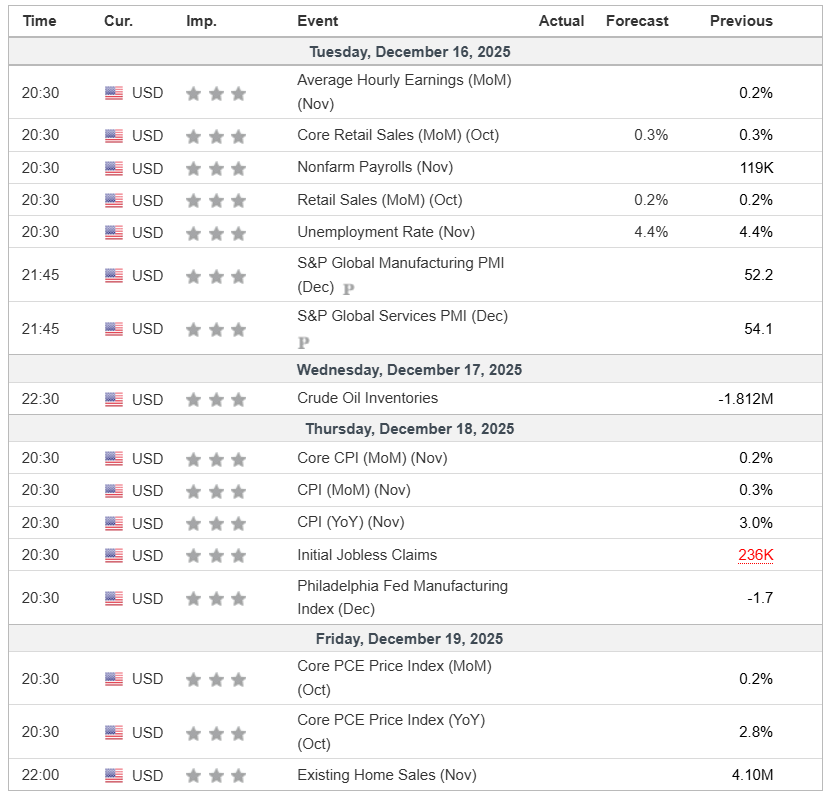
Volatility is expected to increase this week, driven by the release of a series of important economic data from the United States that often catalyze price movements in risk assets. Based on the economic calendar, market participants should monitor the following dates:
- Tuesday, December 16
The release ofRetail Sales and Nonfarm Payrolls data will provide a snapshot of the health of the US consumer and workforce.
- Thursday, December 18
Monthly and annual Consumer Inflation (CPI) andInitial Jobless Claims data are announced.
- Friday, December 19
The release of the Core PCE Price Index, a key inflation indicator that the Fed references in determining interest rate policy.
Technical Analysis: Key Levels to Watch
1. Bitcoin (BTC): A Battle on the Trendline
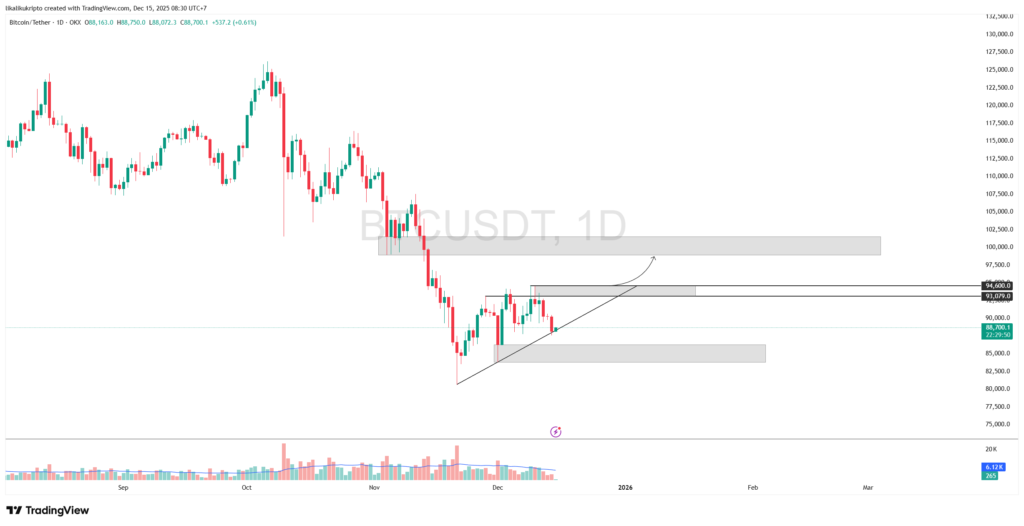
Bitcoin is still moving above the up trend line. This is a positive signal that the rebound rate is still trying to strengthen. However, big challenges lie ahead.
High selling pressure was felt when the price touched the resistance cluster at $93,079 – $94,600. This area became a thick wall that caused the price to correct many times.
- Bullish Scenario: If BTC manages to breakout from this area, the next upside target is quite optimistic, which is in the range of $98,941 – $101,490.
- Bearish Scenario: Conversely, if the price fails to hold and breaks below the trend line, the decline could continue towards the immediate targets at $83.833 – $86.283.
2. Ethereum (ETH): Bullish Potential From Ascending Triangle Pattern
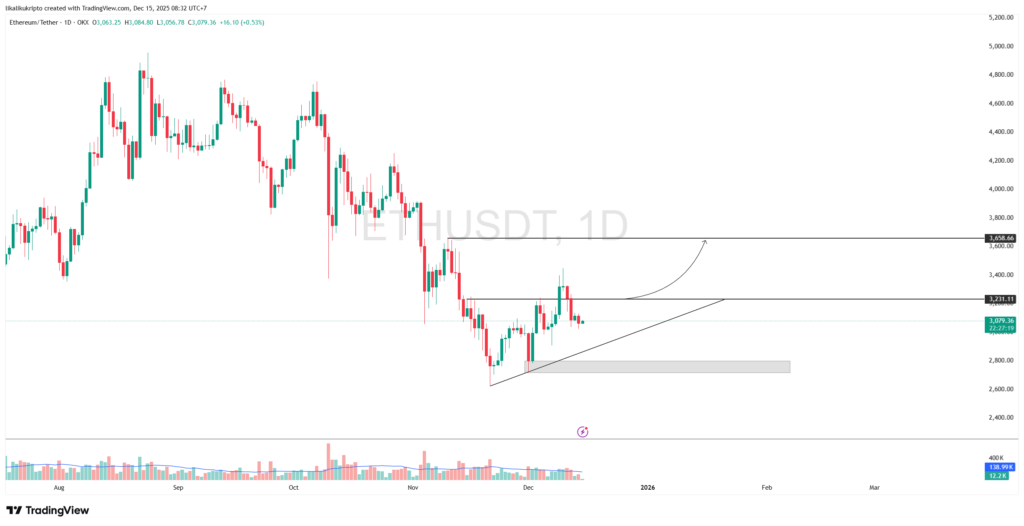
Ethereum experienced a slightly different fate. Following the false break that occurred between December 9-11, the price of ETH fell back below the $3,231 level. However, the market structure shows the potential formation of an ascending triangle pattern which is generally bullishly biased.
If ETH is able to break $3,231 again, it will be a validation of the pattern with a price target towards $3,658. However, investors need to be wary if the price continues to correct away from the uptrend line, as the next support is quite far away in the $2,719 – $2,798 area.
3. Solana (SOL): Accumulation Phase?
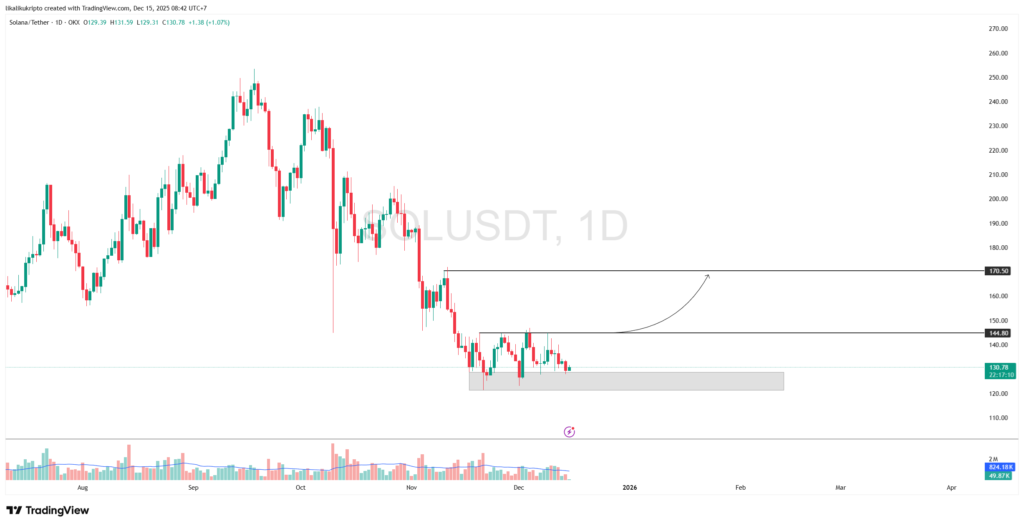
Solana looks quieter than the previous two assets. SOL’s price movement is consistently in a consolidation or sideways phase. The resistance that needs to be broken is $144.80, while the support area is at $121.35 – $128.68.
The key for SOL holders is patience, and a breakout from this consolidation box is required to attract market interest again. If it manages to break out of the $144.80 zone, SOL has a chance to run towards $170.50.
Crypto Performance in the Last Week
Top Performing Crypto Assets
- Tera ($LUNA) +59.59%
- Rats Ordinals ($RATS) +40.31%
- Kryptonite ($SEILOR) +35.07%
- Merlin Chain ($MERL) +30.57%
Worst Performing Crypto Assets
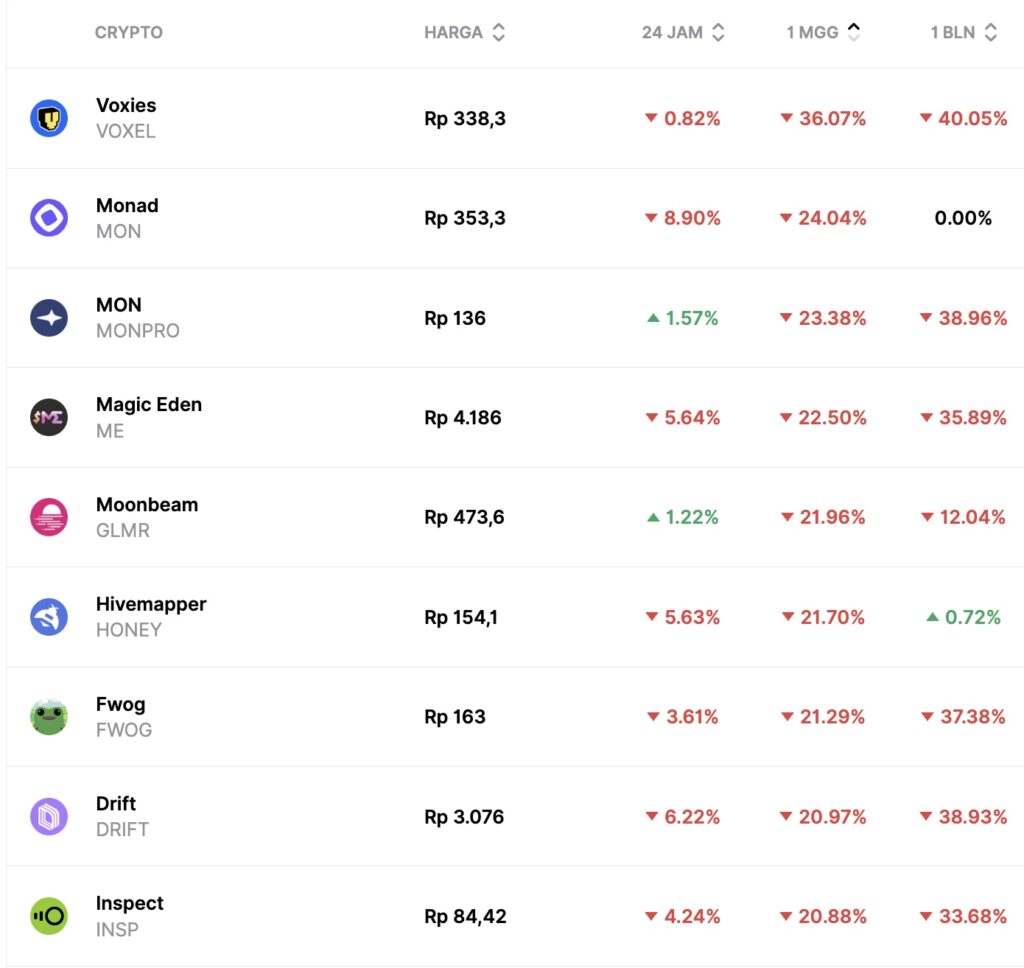
- Voxies ($VOXEL) +36.07%
- Monad ($MON) +24.04%
- MON ($MONPRO) +23.38%
- Magic Eden ($ME) +22.50%
Disclaimer: All articles from Pintu Academy are intended for educational purposes and do not constitute financial advice.
Conclusion
This week was a test of endurance for the crypto market. With sentiment still in the “fear” area and a thick wall of technical resistance on Bitcoin, traders are advised not to get too aggressive until there is a clear confirmation of direction, be it a breakout from a key level or the release of market-supportive US economic data.