
Key Takeaways
- Market Consolidation and Fear: The crypto market is potentially in a prolonged consolidation phase as macroeconomic pressures and low liquidity keep investors cautious heading into the end of 2025.
- Bitcoin’s Potential Reversal: Bitcoin has been range-bound between $84,000 and $94,000 for a month. While technical indicators like RSI divergence suggest a potential bullish reversal, small trading volumes leave these signals unconfirmed.
- Ethereum vs. Solana Divergence: Ethereum is building bullish momentum above $2,780 following its Fusaka upgrade, whereas Solana remains under heavy bearish pressure as it tests a critical support level of $118.
- Holiday Season Slowdown: On-chain activity and DEX volumes are declining (down 3.7% this week) as the market enters the Christmas and New Year period, likely resulting in light trading volume for major assets.
Last week, the crypto market was characterized by continued volatility and a bearish tone. Major assets have not shown significant gains or volumes amid macroeconomic pressures, depleted liquidity, and investor caution. Overall, market capitalization was in the range of $3.07-3.1 trillion, reflecting a modest decline of around 0.5-0.8% in the spot market. This is down from the previous high of over $4 trillion in October.
Many cryptocurrencies tend to consolidate or even drop deeper. This is influenced by a number of factors, such as interest rate hike signals by the Bank of Japan and widespread risk aversion in global markets. Although the short-term mood looks bleak, institutional activity and regulatory developments provide hidden support, hinting at a long-term maturation process.
Market sentiment briefly climbed into”Fear” territory with this week closing at 29, up from last week’s “Extreme Fear” index. This shows the start of confidence amidst a consolidating market. Nonetheless, investors are still showing reluctance in investing aggressively in the crypto market, especially towards the end of 2025.
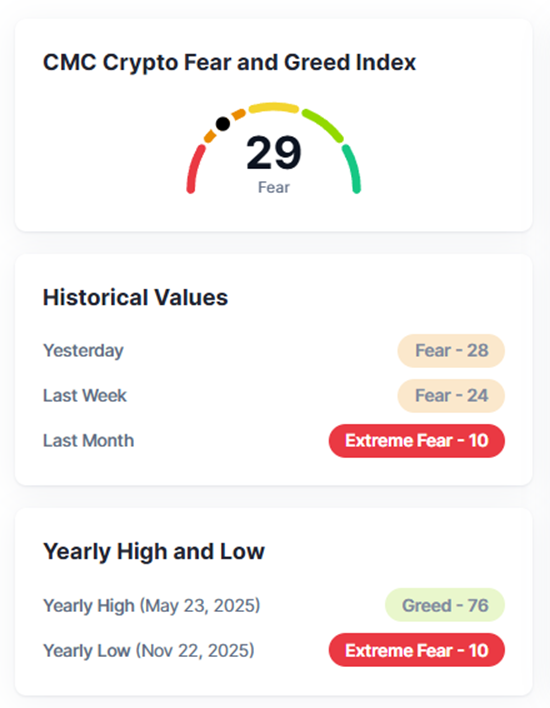
Fear and Greed Index. Source: coinmarketcap.com
Some key points:
- Investor Caution: Public discussions suggest investors are ignoring the potential upside, with traders instead monitoring the potential for further downside despite dip-buying activity. Discussions on social media X (formerly Twitter) reflected this mood – bullish one day, bearish the next. The volume of conversations on X about crypto has dropped dramatically. In fact, X used to be one of the main mediums for crypto conversations.
- Contrarian View: Although short-term bearish, some analysts argue that the current level of fear is not extreme enough to mark a true market bottom. This can be seen from the fact that trading volumes on various exchanges are not as large as they were a few weeks or months ago.
Overall, market sentiment indicates the market is range-bound and entering a prolonged consolidation phase, with less euphoria and more focus on fundamentals. In addition, this week will see the Christmas holiday, followed by 1 week into the new year. Trading volumes will likely continue to be light on key assets such as Bitcoin and Ethereum.
Bitcoin (BTC) Analysis
Consolidation and Bottom Determination
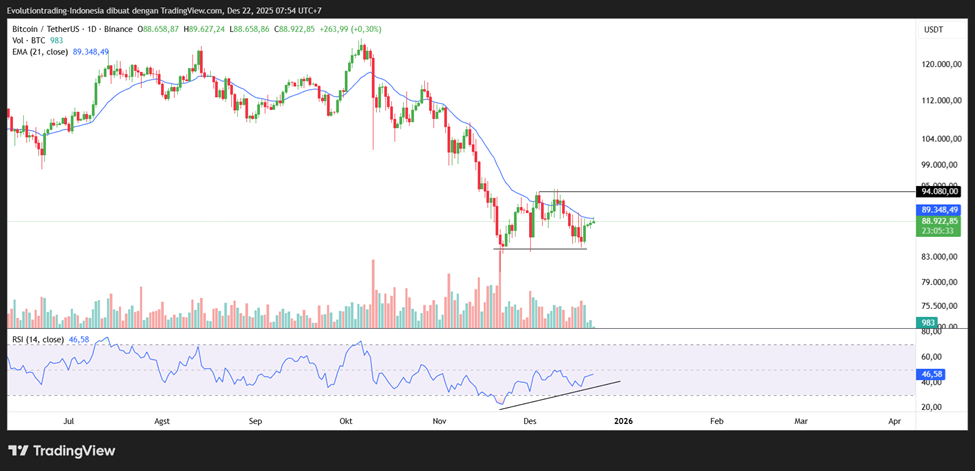
After a “brutal” decline since October 10, 2025, Bitcoin was seen consolidating for quite a while in the area around $84,000 and $94,000 for more than 1 month from November 21, 2025, to today, December 22, 2025.
Technically, there is potential for Bitcoin to go up, at this “bottom”, with some crucial aspects that we can pay attention to:
- The $84,000 acts as a support that has held the price down several times.
- A bullish candle formed on December 19, 2025.
- There is a bullish divergence pattern on the RSI indicator which indicates a potential reversal to the bullish direction.
- Bitcoin is currently testing the 21 Exponential Moving Average (EMA) line, which acts as resistance, and if Bitcoin manages to break through, it will provide significant upside potential.
However, it should be noted that the above signals are unconfirmed indications. Especially at the end of the year, when trading volumes are still relatively small.
Ethereum (ETH) Analysis
Bullish Momentum Building
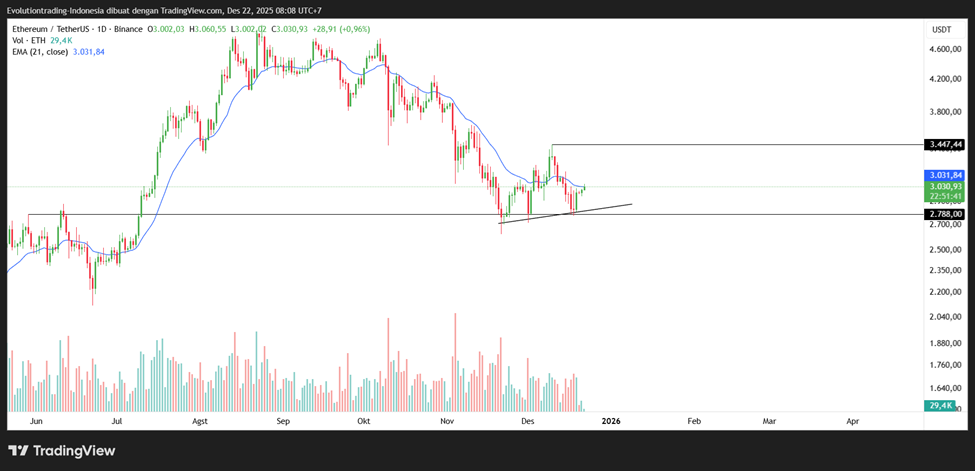
Similar to Bitcoin, Ethereum is seen forming some bullish signals on its daily timeframe. It can be seen by the formation of a “higher low” in the area around $2780, which acts as support.
Ethereum needs to break the 21-day EMA indicator to confirm its bullish momentum, with the target of testing its last “high” in the $3400 area formed on December 10, 2025.
Ethereum is still experiencing positive sentiment with the launch of the Fusaka upgrade since December 3, 2025. Analyst and investor Tom Lee suggested that Ethereum could reach a price of 62,000 US dollars.
Solana Analysis (SOL)
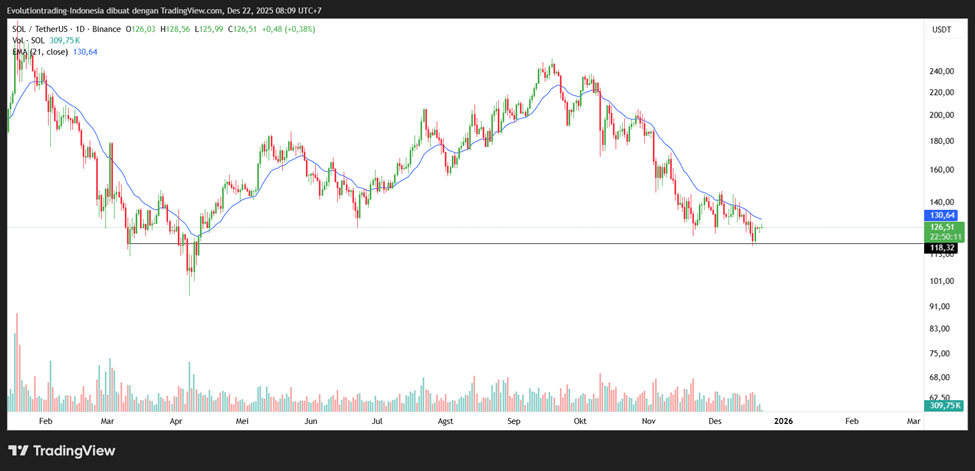
Bearish pressure is still dominant in Solana. Solana is currently testing its important support in the $118 area. However, the candlestick formation shows Solana’s price action is not convincing, especially with Solana below the 21-day EMA indicator.
The $118 level needs to hold as support. If this level can be broken, then Solana has the potential to drop to its psychological level of $100.
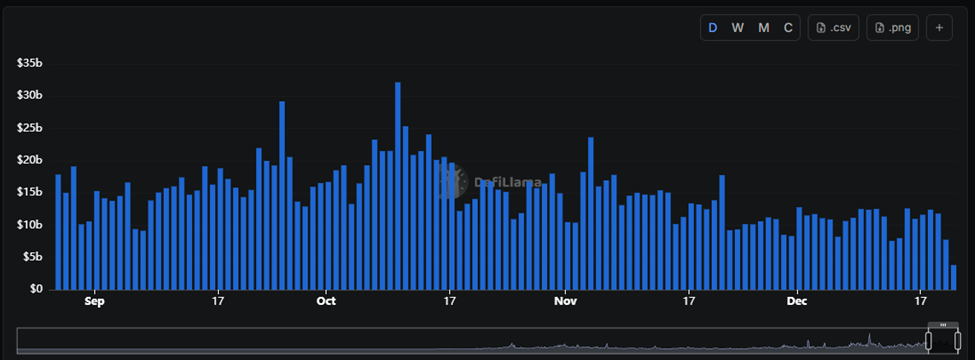
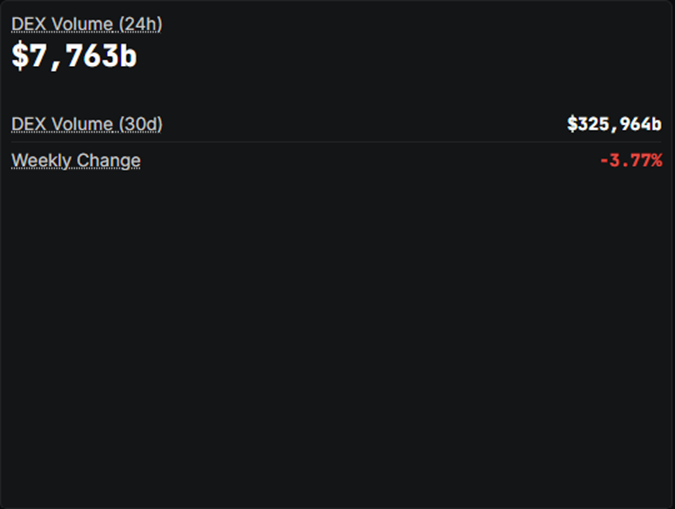
On-Chain Analysis: Decreased Activity Ahead of Christmas
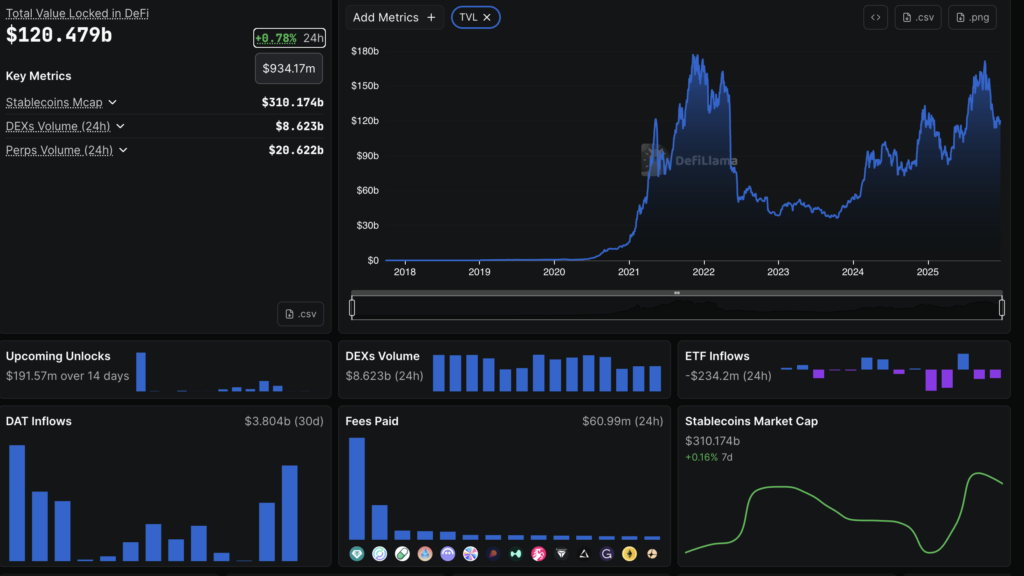
On-chain metrics. Source: Defillama.com
The volume of decentralized exchanges (DEXs) has seen a decline in the past few days. Overall, 1 week back, the trading volume on DEXs was down 3.7% at $7.73 billion. This indicates that on-chain activity has seen a decline in investor interest in recent days.
Cryptocurrency Performance in the Last Week
Top Performing Cryptocurrencies
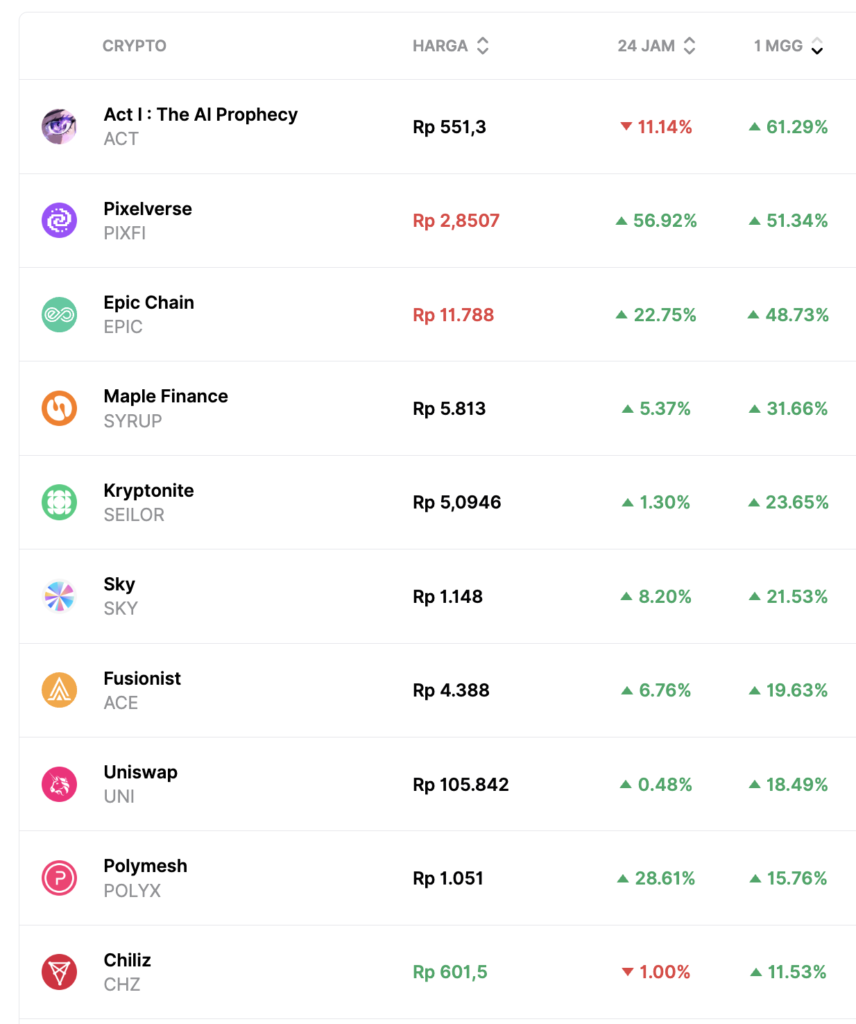
- ACT I: The AI Prophecy ($ACT) +61.2%
- Pixelverse ($PIXFI) +51.3%
- Epic Chain ($EPIC) +48.7%
- Maple Finance ($SYRUP) +31.6%
Worst Performing Cryptocurrencies
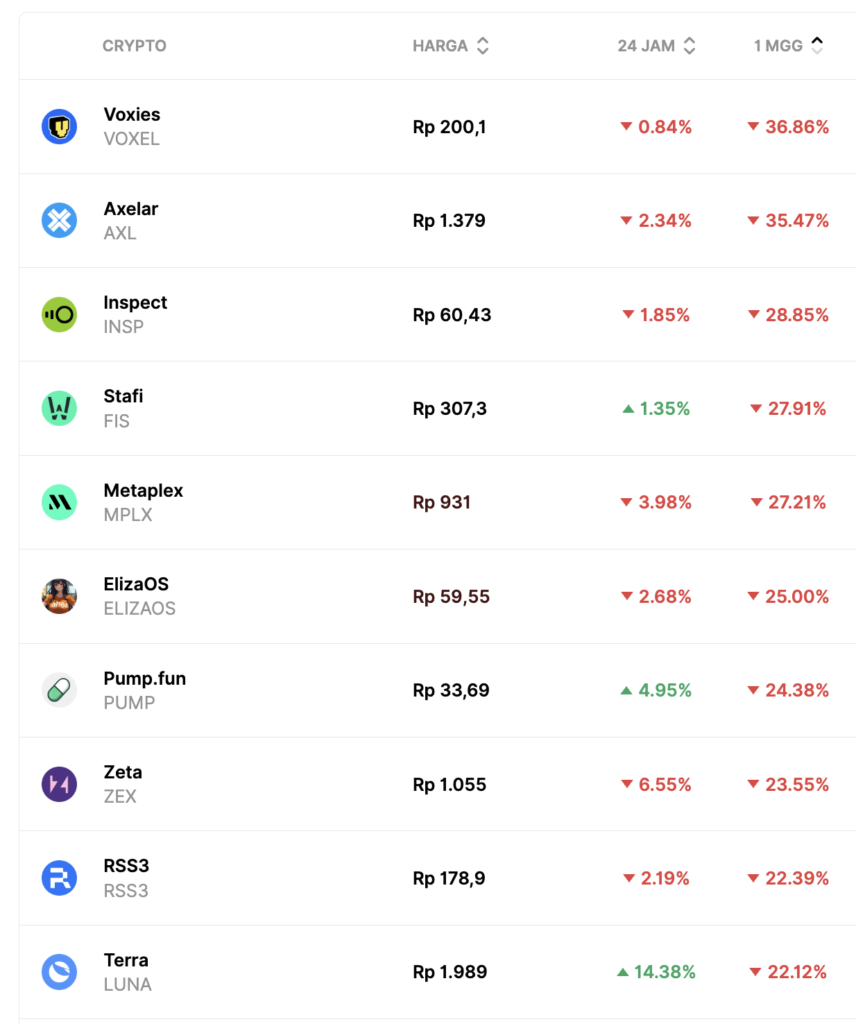
- Voxies ($VOXEL) -36.8%
- Axelar ($AXL) -35.4%
- Inspect ($INSP) -28.8%
- Stafi ($FIS) -27.9%