
This week there will be significant economic events, namely CPI and Initial Jobless Claim which reflect the strength of the United States economy and can affect risky assets such as crypto. In addition, the price movements of BTC, ETH, and SOL are also on the verge of crucial levels.
The weekly crypto market analysis was made by traders and analysts in Volubit for educational purposes only, not as financial advise.
Currently, the crypto market is at a decisive point between a recovery or a journey towards a bear market. Judging from its price movement, Bitcoin is currently at the 50 Exponential Moving Average (EMA) of the 1-week timeframe, which is an important technical support. However, judging from the candlestick formation, there is a strong bearish potential. This week will see the release of some news that could increase market volatility, so we need to be careful especially in risk management.
Bitcoin Technical Analysis
Tricky Market Movements
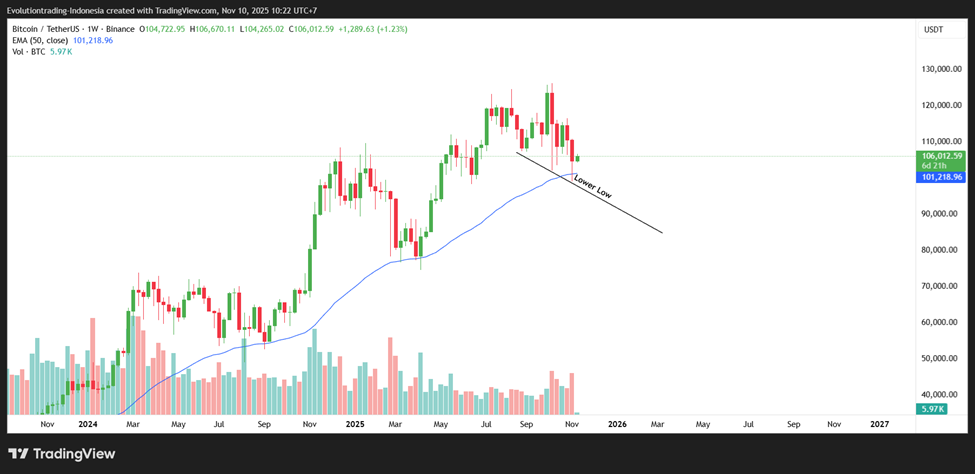
Bitcoin took center stage this week with the formation of a bearish candlestick on the 1-week timeframe and the formation of a lower low signaling an indication of a downtrend. However, Bitcoin also showed a strong bounce at the 50 EMA technical indicator on the 1-week timeframe.
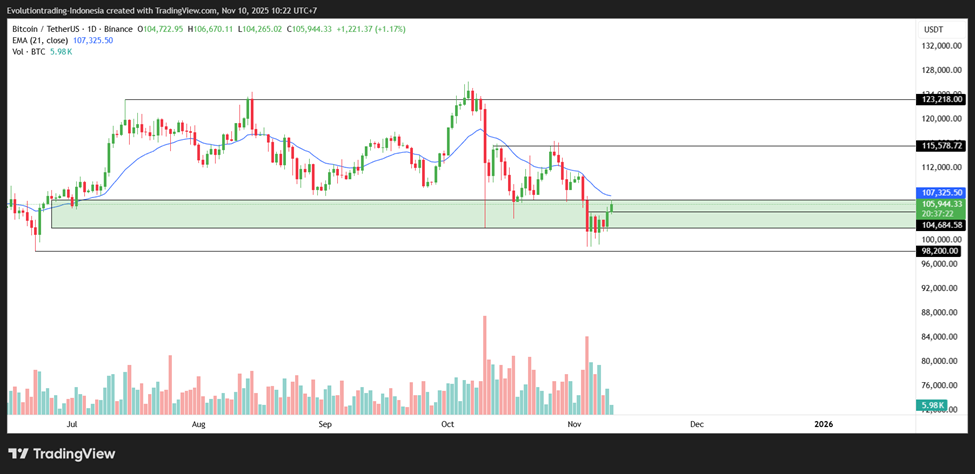
On the 1-day timeframe, Bitcoin is already below the 200 EMA. However, there is currently a bullish signal with the breakout of the $104,800 resistance level and approaching another technical indicator, the 21 EMA of the 1-day timeframe, which if successfully broken, then opens up the potential for Bitcoin to continue its upward momentum to $115,000 and even $120,000. However, if Bitcoin fails to break this technical indicator, it could signal a decline for Bitcoin.
Some factors to consider for Bitcoin:
- Bearish Pattern on the 1-Week Timeframe: A candlestick pattern that forms a lower-low indicates a bearish trend.
- Bounce off the 50 EMA 1 Week Timeframe: The bounce from the weekly timeframe 50 EMA indicator, which is one of the strong indicators to show the long-term trend, showed a bullish indication.
- Bullish Momentum on the 1-Day Timeframe: $104,800 is the resistance that has been broken indicating a potential upside for Bitcoin. However, Bitcoin is still below the 21 EMA and 200 EMA on the 1-day timeframe.
- Upside and Downside Projections: If the price of Bitcoin is able to break the 21 EMA of the 1-day timeframe, the opportunity to continue the post-recovery increase is high, with the closest targets being at the level of $115,000, $121,000 and there is potential to test the highest price (ATH). However, if it cannot break the level, then the potential for Bitcoin to fall below $100,000 is getting bigger.
Ethereum Technical Analysis
Ethereum’s Recovery Potential
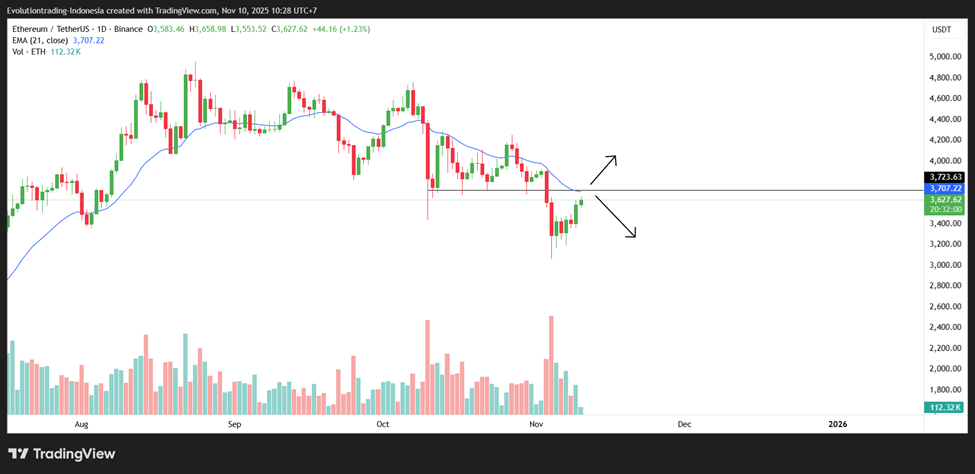
Apart from Bitcoin, Ethereum is also in the spotlight with a breakout from a consolidation pattern. Currently, Ethereum will test the 21 EMA on the 1-day timeframe. The level is also adjacent to the Resistance Become Support level at $3707.
In other words, this will act as the closest resistance for Ethereum. If successfully reclaimed, this will bring bullish momentum for Ethereum with a potential rise to $4000. However, if it fails to break, it will create a lower-high for Ethereum, which is a confirmation of a continued downtrend.
Solana Technical Analysis
Solana Price Movement Scenario
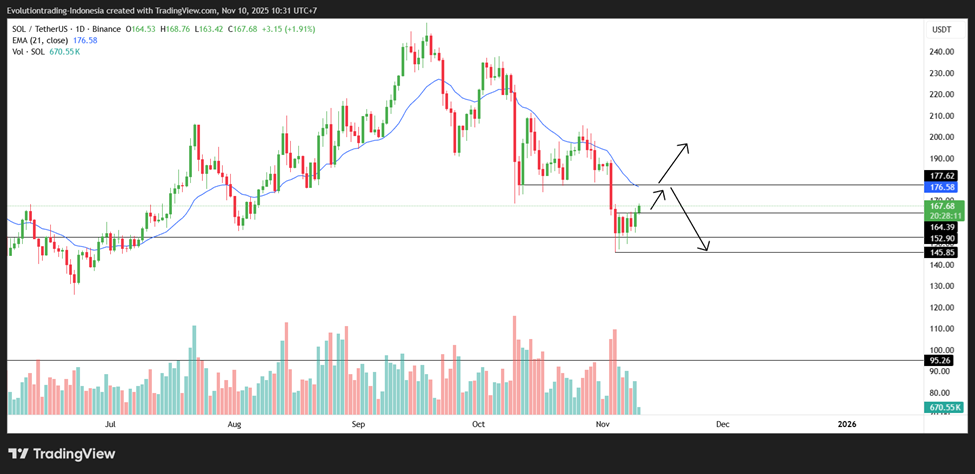
Solana is forming a price movement almost identical to Ethereum. Solana looks to have a breakout from the consolidation pattern and will test the 21 EMA on the 1-day timeframe, which is also adjacent to the Resistance Become Support level at $176.
This area will act as the closest resistance for Solana, which if successfully reclaimed, will bring bullish momentum for Solana with a potential increase up to $200. However, if it fails to be broken, it will create a lower-high for Solana, which is a confirmation of a continued downtrend.
Factors Supporting Price Recovery
On-Chain Analysis: Relatively Stable
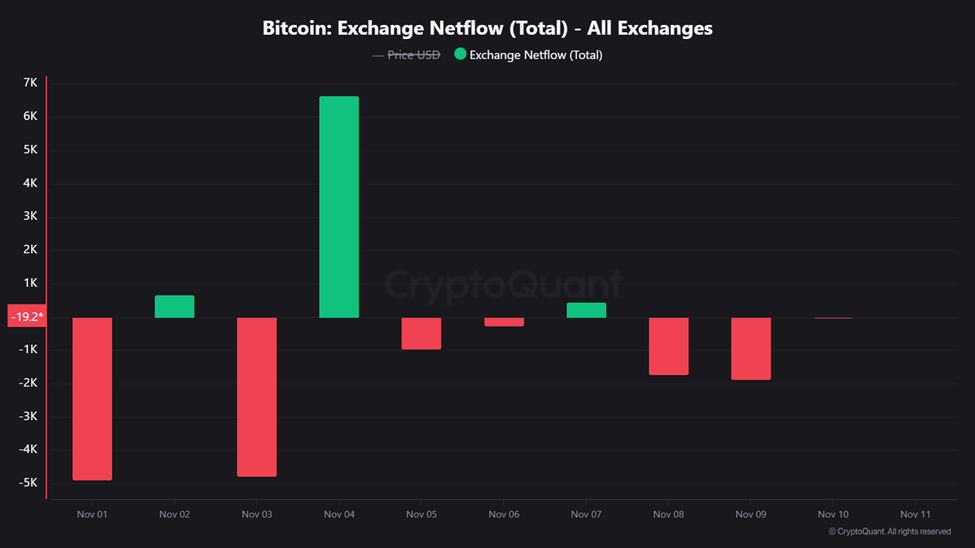
Besides that, Exchange Netflow data shows an interesting market sentiment. Over the past week, Bitcoin’s movement has been dominated by Bitcoin outflows from exchanges. Both inflow and outflow did not show significant differences, with the exception of a significant inflow on November 4. This indicates a bullish sentiment as it can be seen that holders are slowly moving their Bitcoin outside the exchange to be held in the long term.
Macroeconomic Analysis of the Week
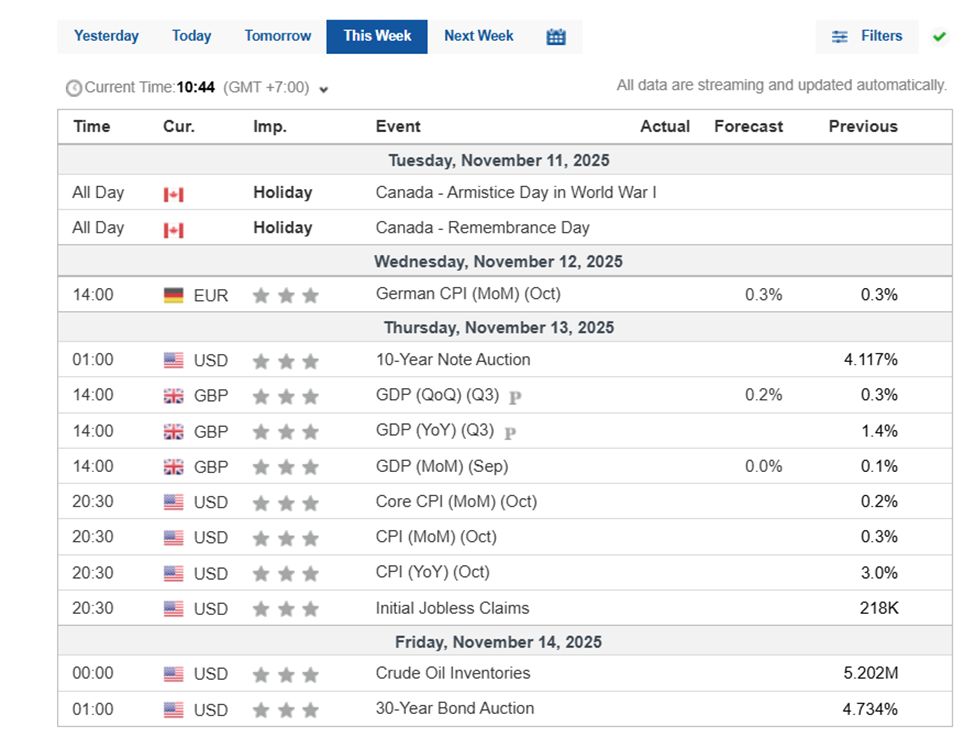
The focus of global markets this week will be on the economic event of the CPI (Consumer Price Index) which is one of the economic indicators of the United States. High CPI values can create momentary bearish momentum in the crypto market, while low CPI values can create bullish momentum.
In addition, there are rumors on social media that the President of the United States will provide a stimulus check similar to the one during the Covid pandemic. Furthermore, This has sparked debate on social media. Some argue that this is fundamentally different from a stimulus check, others argue that this could be bullish for crypto.
Crypto Asset Performance in the Last Week
Top Performing Crypto Assets
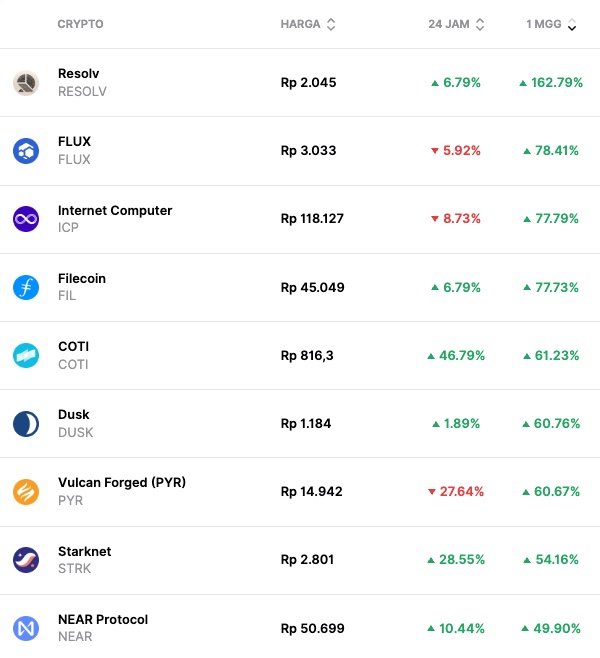
- Resolv (RESOLV) +162.79%
- FLUX (FLUX) +78.41%
- Internet Computer (ICP) +77.79%
Worst Performing Crypto Assets
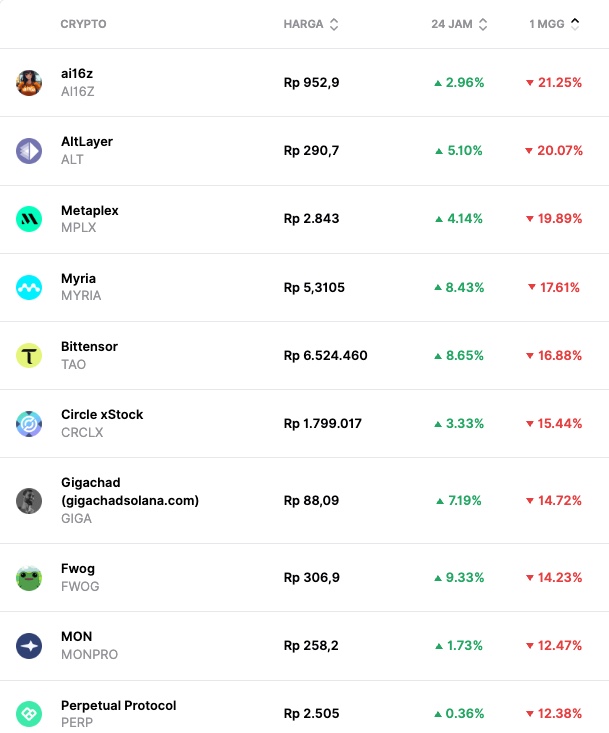
- ai16 (AI16Z) -21.25%
- AltLayer (ALT) -20.07%
- Metaplex (MPLX) -19.89%