
The cryptocurrency market experienced significant pressure throughout the week, characterized by price declines in key assets and a deterioration in overall market sentiment. Here is a summary of technical and on-chain analysis for the week.
The weekly crypto market analysis was made by traders and analysts in Volubit for educational purposes only, not as financial advise.
BTC Sentiment is Declining: Oversold?
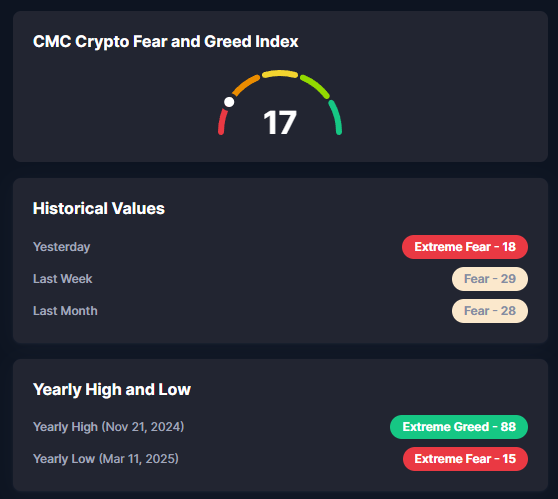
The Crypto Fear and Greed Index currently stands at 17, which indicates an “Extreme Fear” condition. This figure shows a decrease in sentiment compared to last week which was at 29 (Fear) and last month at 28 (Fear).
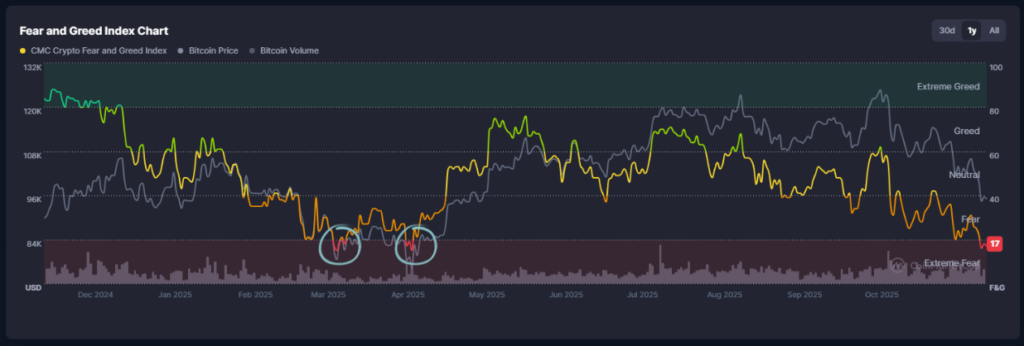
Similar conditions occurred on March 13 and April 7, where the Crypto Fear and Greed Index at this time was at levels 15-17. However, after the price drop at that time, the price of Bitcoin slowly recovered and managed to rebound.
BTC Technical Analysis
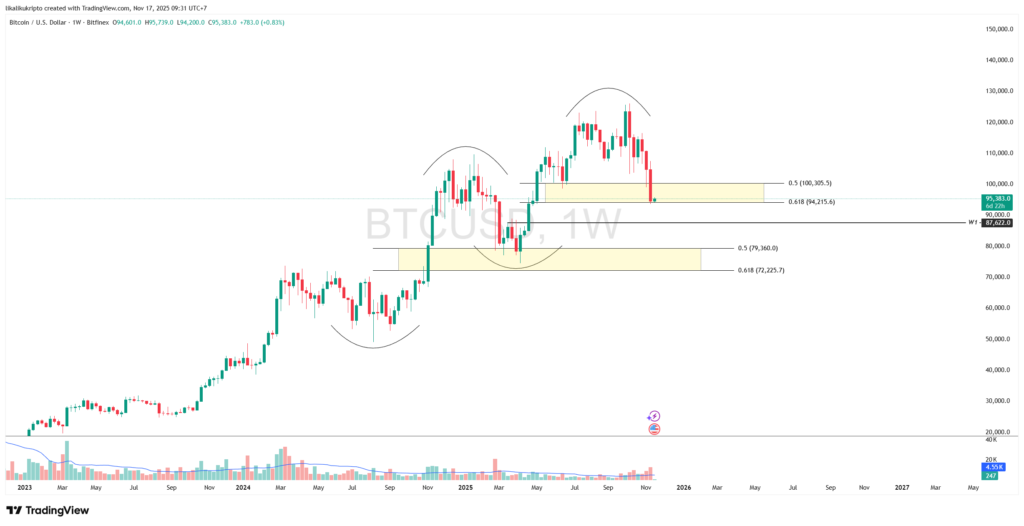
Bitcoin closed the weekly candle with a sharp correction of 9.72%. This drop brought the price to the harmonic support area (Fibonacci golden pocket) in the range of $94,215 – $100,305.
- Bullish Scenario: If the price is able to rebound from this area, Bitcoin is expected to test the psychological level of $100,000 again.
- Bearish Scenario: In case of a breakdown, the price has the potential to continue weakening towards the next support at $87.622.
ETH Technical Analysis
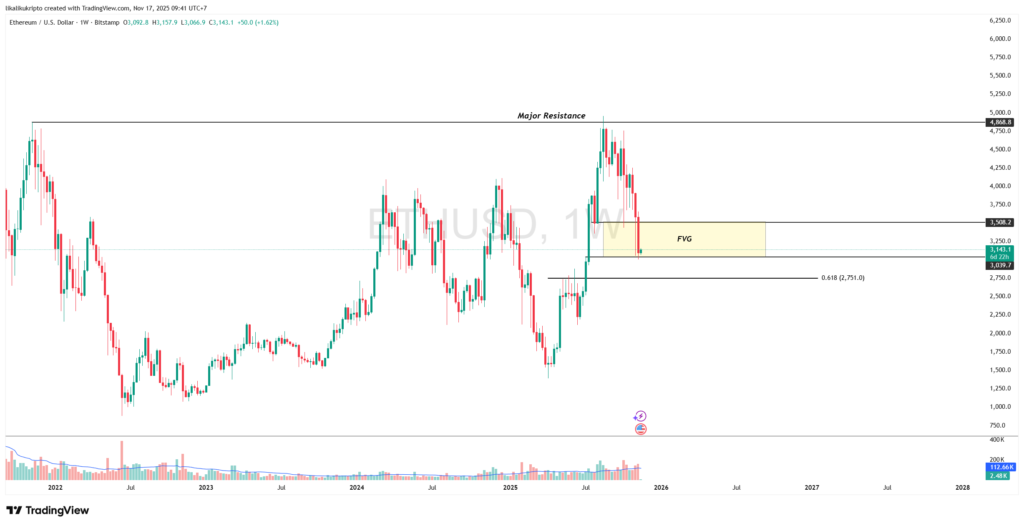
Ethereum continued its correction trend with a weekly decline of 13.67%. The price is now entering the Fair Value Gap (FVG) area which serves as support at $3,039 – $3,508.
- Bullish Scenario: If successful in rebound, the nearest upside target is to retest the $3,508 level (support becomes resistance).
- Bearish Scenario: On the contrary, if it drops below the FVG, the next support is at $2,751.
SOL Technical Analysis
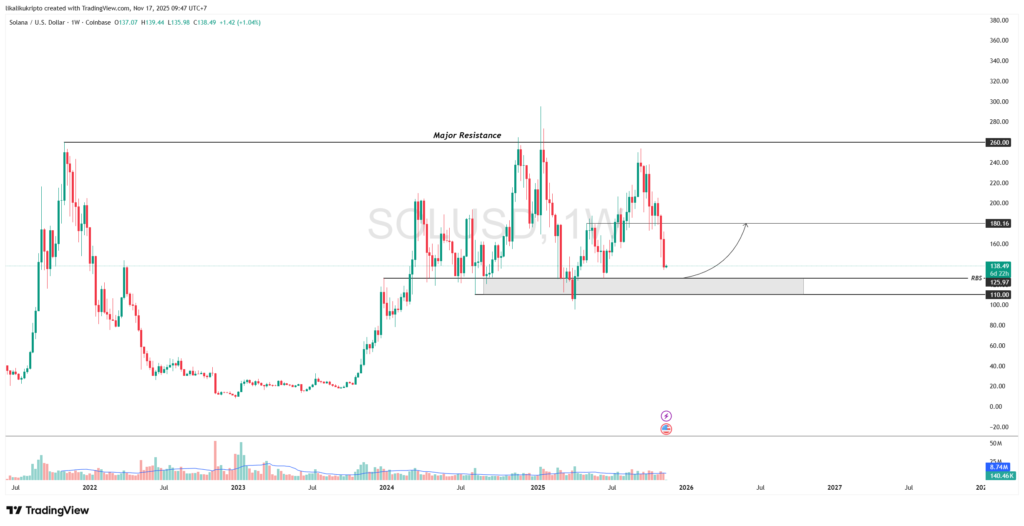
Solana is also under selling pressure, with prices approaching an important support cluster in the $110 – $125.97 area. Based on historical data, this area has repeatedly been a strong stronghold that reversed the trend direction since April 2024.
- If this support holds, SOL has a chance to rebound towards resistance at $180.
Metrics Analysis: Understanding BTC Sentiment
1. BTC Holder Profit & Loss Ratio
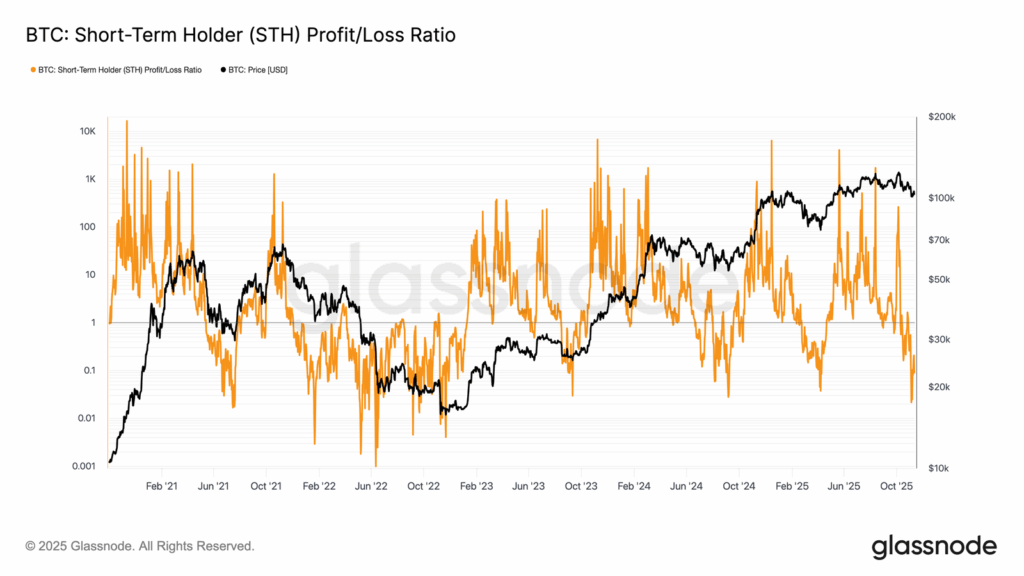
The STH Realized Profit-Loss ratio has plummeted below 0.21, which means more than 80% of current transactions are realized losses. This phenomenon indicates that many investors are trapped at the top price (“top heavy”).
2. Accumulation Activity

Although the big trend is bearish, there is an increase in buying activity (accumulation) in the area below $100,000. New investors are starting to absorb selling pressure from capitulating investors.
3. ETF Net Flows

Bitcoin Spot ETFs in the US have recorded increased outflows in recent weeks, signaling a lull phase in institutional accumulation. The market is likely to remain on the defensive until fund flows turn significantly positive again.
Crypto Asset Performance in the Last Week
Top Performing Crypto Assets
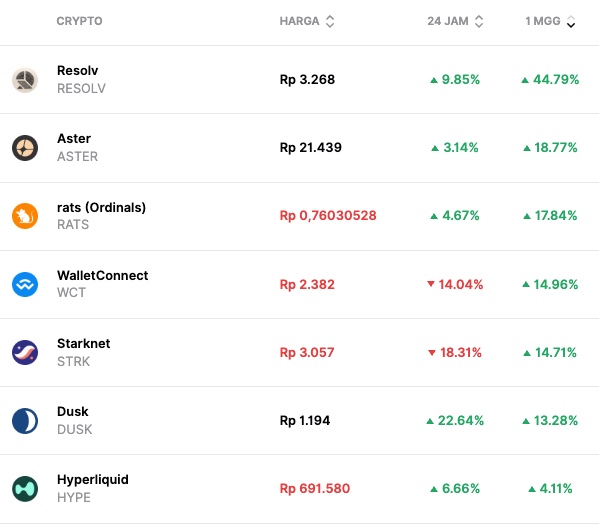
- Resolv (RESOLV) +44.79%
- Aster (ASTER) +18.77%
- rats ordinals (RATS) +17.84%
Worst Performing Crypto Assets
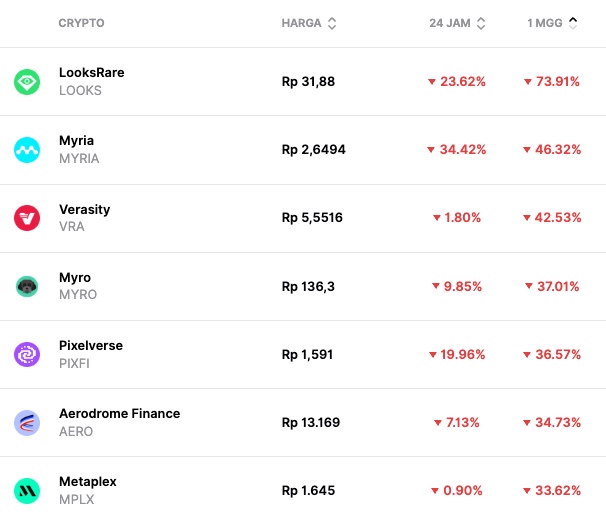
- LooksRare (LOOKS) -73.91%
- Myria (MYRIA) -46.32%
- Verasity (VRA) -42.53%
Conclusion
The market is currently at a crossroads. Technically, major assets such as BTC, ETH, and SOL are testing their crucial support levels. Meanwhile, on-chain data shows a combination of sellers’ capitulation and premature accumulation at lower levels.
References
- Data Exchange Netflow, CryptoQuant
- Fear and Greed Index data, Coinmarketcap
- Arli Fauzi, “Glassnode: Bitcoin Still Under Pressure, Market Sluggish and Sellers Saturated“, Volubit, accessed on November 18, 2025.