
This report summarizes the latest technical analysis for BTC, ETH, and SOL, as well as market sentiment that could potentially affect price movements in the week ahead.
Article Summary
- Market Overview:
The crypto market began in November 2025 in consolidation after October’s correction. Bitcoin, Ethereum, and Solana are all holding key support levels, indicating continued buying interest despite lower trading volume. However, this can change quickly if prices start to break down. - Technical Highlights:
Bitcoin trades sideways between $107,245–$115,770, awaiting a breakout for direction. Ethereum maintains strength above $3,860, while Solana remains stable around $168.79–$175.69. - Market Drivers:
Sentiment improved slightly (Fear & Greed Index: 37 → 42), while institutional inflows into Bitcoin ETFs is still high. Historical data also suggests that November and December are seasonally strong months for Bitcoin.
The crypto market entered the first week of November 2025 in a state of consolidation after the correction phase that occurred during October. Bitcoin, Ethereum, and Solana all held at key support areas that have been tested repeatedly, signaling that there is still buying interest despite declining trading volumes.
The price structure of these three major assets suggests that the market is in a phase of uncertainty. Market participants are waiting for new catalysts, such as the development of Bitcoin ETFs, global macro conditions, or changes in liquidity.
Bitcoin Technical Analysis
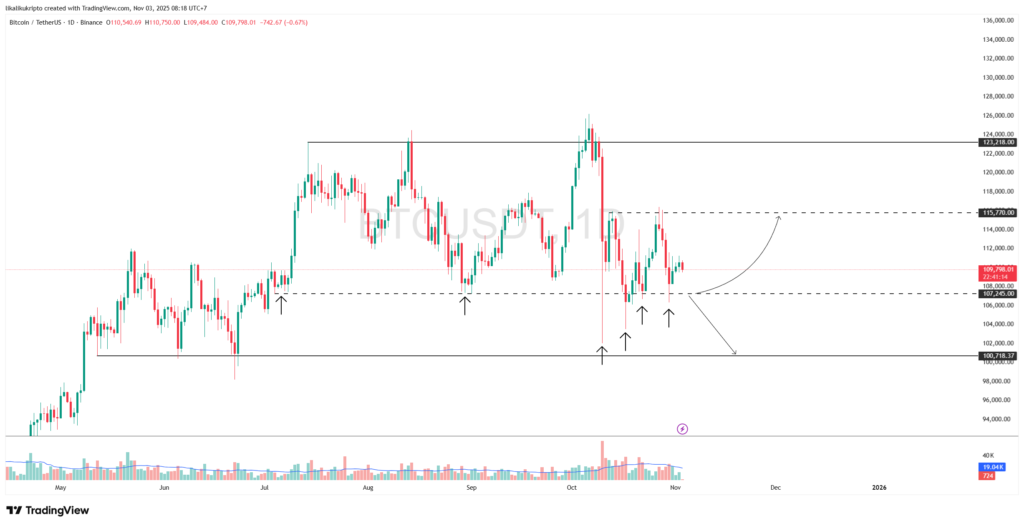
Bitcoin price movements tend to be sideways in the $107,245 – $115,770 area. The support point in the area looks quite solid after more than five times reversing the price direction from down to up.
An upward or downward breakout from the consolidation area will be the reference to determine the next direction.
If the price of Bitcoin can breakout upwards which is the resistance, then the upside is expected to continue with the upside target at the level of $123,218. However, if the Bitcoin price drops, then the target is at the next support at the level of $100,718.
Ethereum Technical Analysis
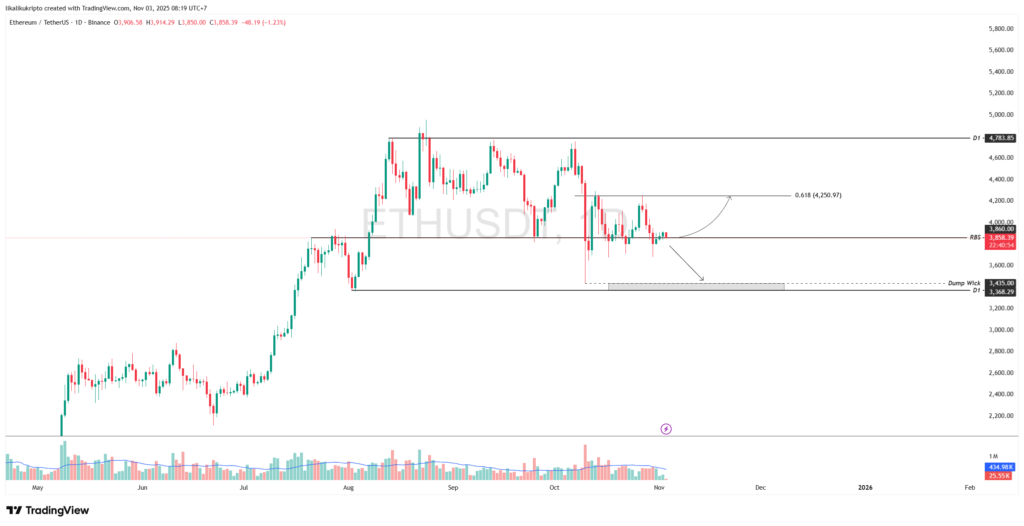
The horizontal level at $3,860, which acts as the RBS (Resistance Becomes Support) area, is a crucial point in maintaining the positive momentum of the Ethereum (ETH) price.
Although this area was breached several times, the price managed to rebound and hold above it, signaling that there is still strong buying interest in the zone. ETH needs to continue moving steadily above this level to maintain the positive sentiment in the market.
If successful, then the harmonic resistance in the range of $4,250 becomes the next upside target. Conversely, if ETH fails to maintain a position above $3,860, the potential for further correction is open, with the next support area being in the range of $3,368-$3,435.
Solana Technical Analysis
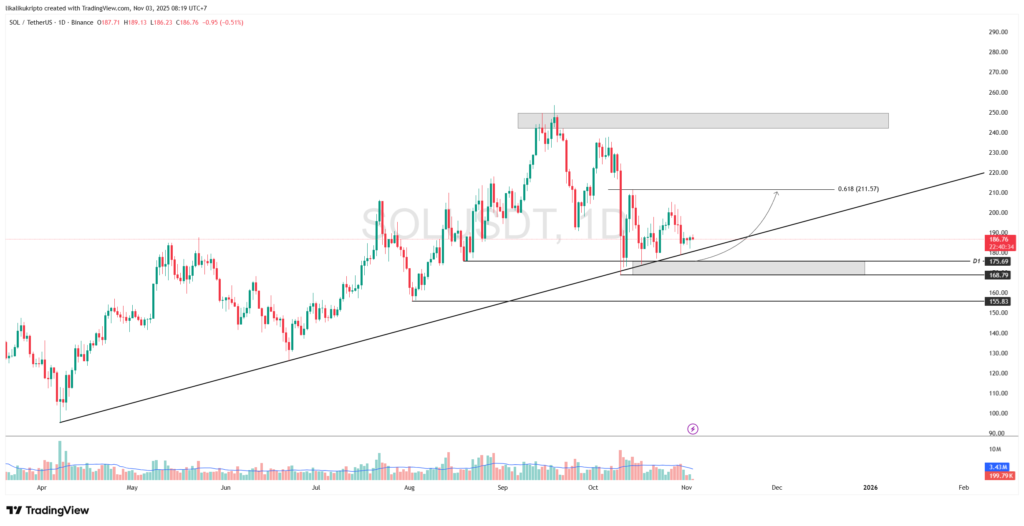
The current price movement of Solana (SOL) shows a wait-and-see attitude towards the direction of Bitcoin’s movement, with a tendency to stay in a positive consolidation pattern.
The market sentiment towards SOL was maintained as the price was able to move above the uptrend line and maintain a position above the immediate support area. The support zone in the range of $168.79-$175.69 acts as a major stronghold that has so far managed to withstand selling pressure.
As long as SOL prices remain stable above this area, the opportunity to continue strengthening is still open, with the nearest upside target being around $211.57.
Analysis of Market Driving Factors
1. Market Sentiment: Fear & Greed Index
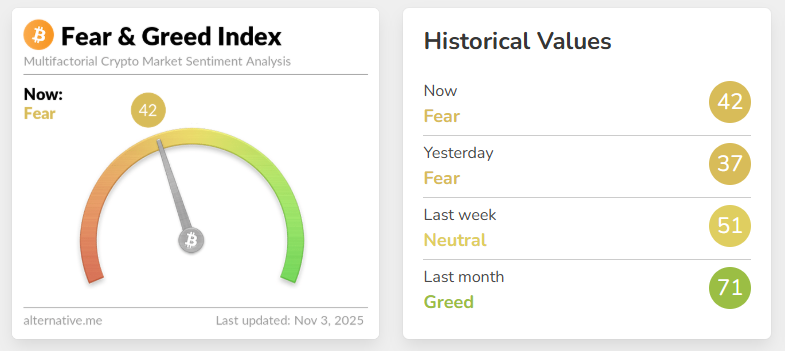
Crypto market sentiment shifted from greed to fear in the past month, signaling an increase in investor concerns. However, the rise from 37 to 42 shows a slight improvement in market confidence ahead of early November. Typically, the “fear” zone is often considered an accumulation phase by long-term investors.
2. Bitcoin Monthly Performance
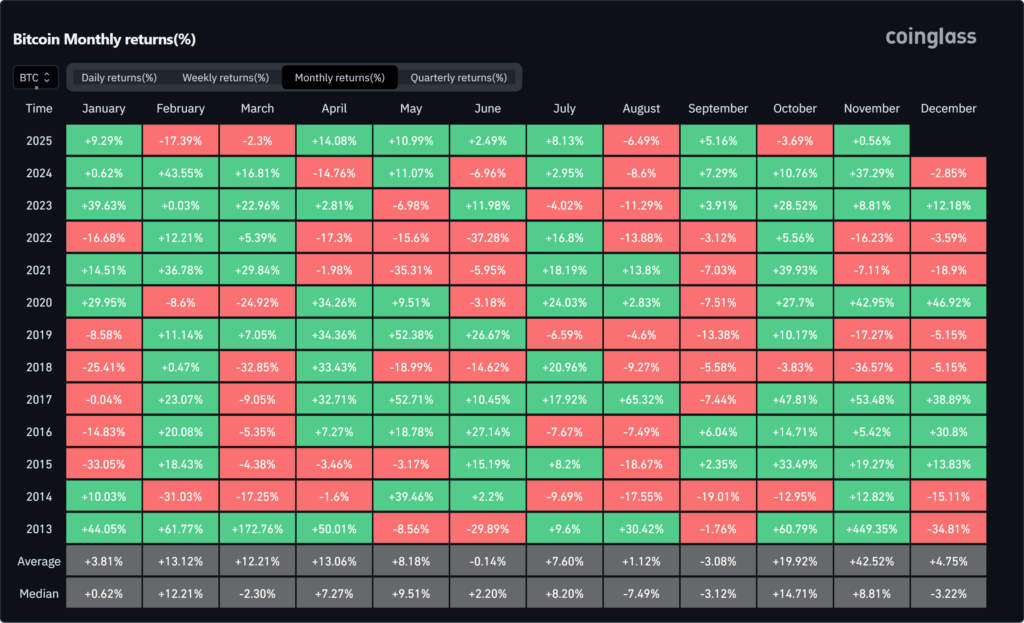
Historically, November and December tend to be positive months for Bitcoin, averaging +42.52% in November and +4.75% in December since 2013. The potential for a recovery rally in mid-November is quite open, especially if buying volumes increase.
3. Bitcoin Netflow Exchange (CryptoQuant)
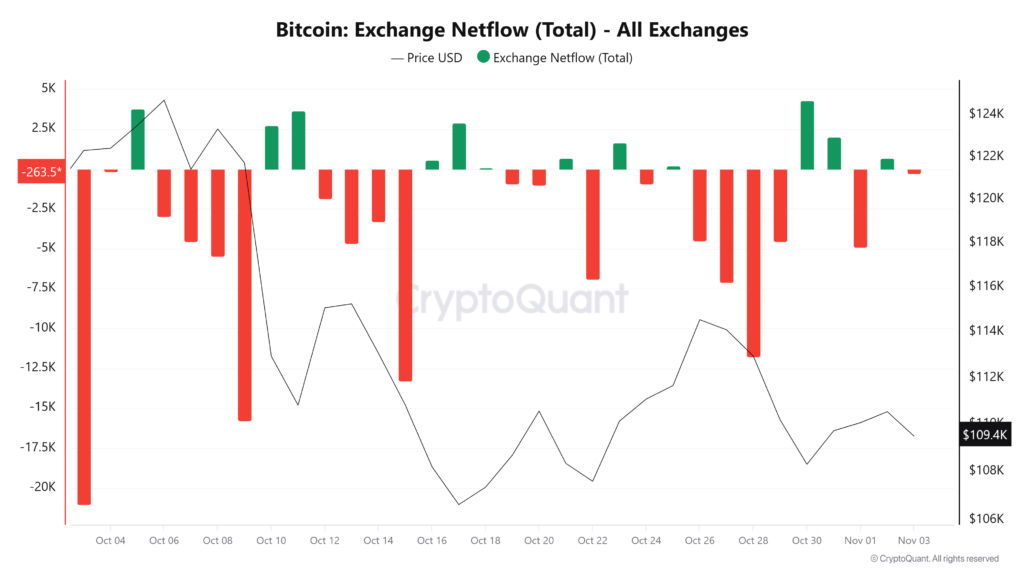
- Data shows the dominance of outflows from exchanges throughout October to early November.
- Significant negative total netflow (red candles ) means that more BTC is leaving the exchange for private wallets.
- The price of BTC (black line) is currently at around $109.4K (in units of the CryptoQuant index).
- Strong outflows are generally interpreted as a sign of accumulation by large market participants (whales), easing selling pressure on the exchange. If this trend continues, it could be a positive signal for price movements in the next few weeks.
4. Entry of institutions and ETFs
- Crypto-based investment products (ETPs/ETFs) recorded significant inflows, particularly for Bitcoin: “Bitcoin dominated with US$931 m inflows … YTD inflows US$30.2 billion“. Source: Coinbureau.
- In the U.S., the crypto ETF approval process has been hampered due to the government shutdown, but some issuers are using the “no delaying amendment” registration mechanism for listing without active approval from the U.S. Securities and Exchange Commission (SEC). Source: Coindesk.
Altcoin Market News
- Chainlink ($LINK): Chainlink Smart Conference will kick off on November 4, 2025. Chainlink’s biggest conference will most likely announce important news at this event.
- Aerodrome ($AERO): Aerodrome will launch two important upgrades next week, namely Slipstream V2 and Autopilot.
- Plasma ($XPL): Plasma (XPL) just hit a new all-time low price of $0.25. Since its launch last month, XPL has declined by around -85%.
Crypto Asset Performance in the Last Week
Top Performing Crypto Assets
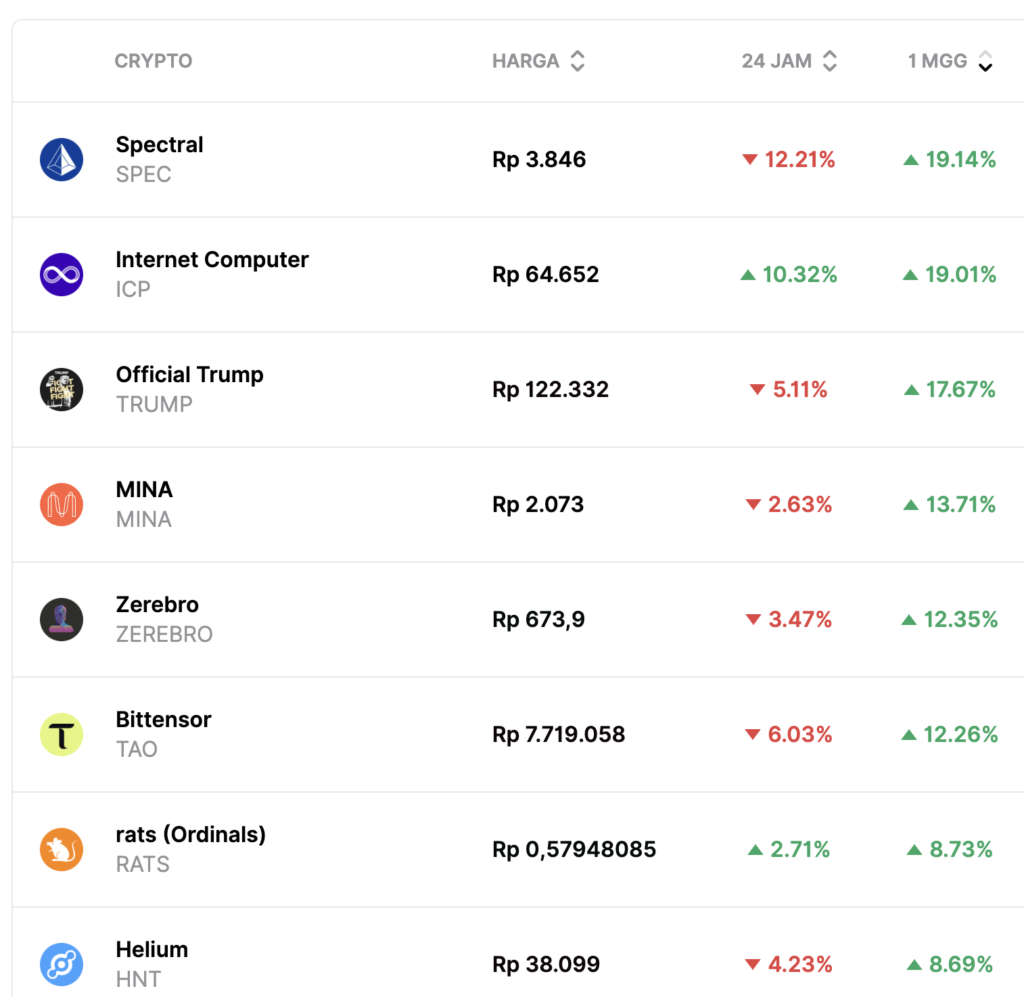
- Spectral (SPEC) +19.14%
- Internet Computer (ICP) + 19.01%
- Official Trump (TRUMP) +17.67%
Worst Performing Crypto Assets
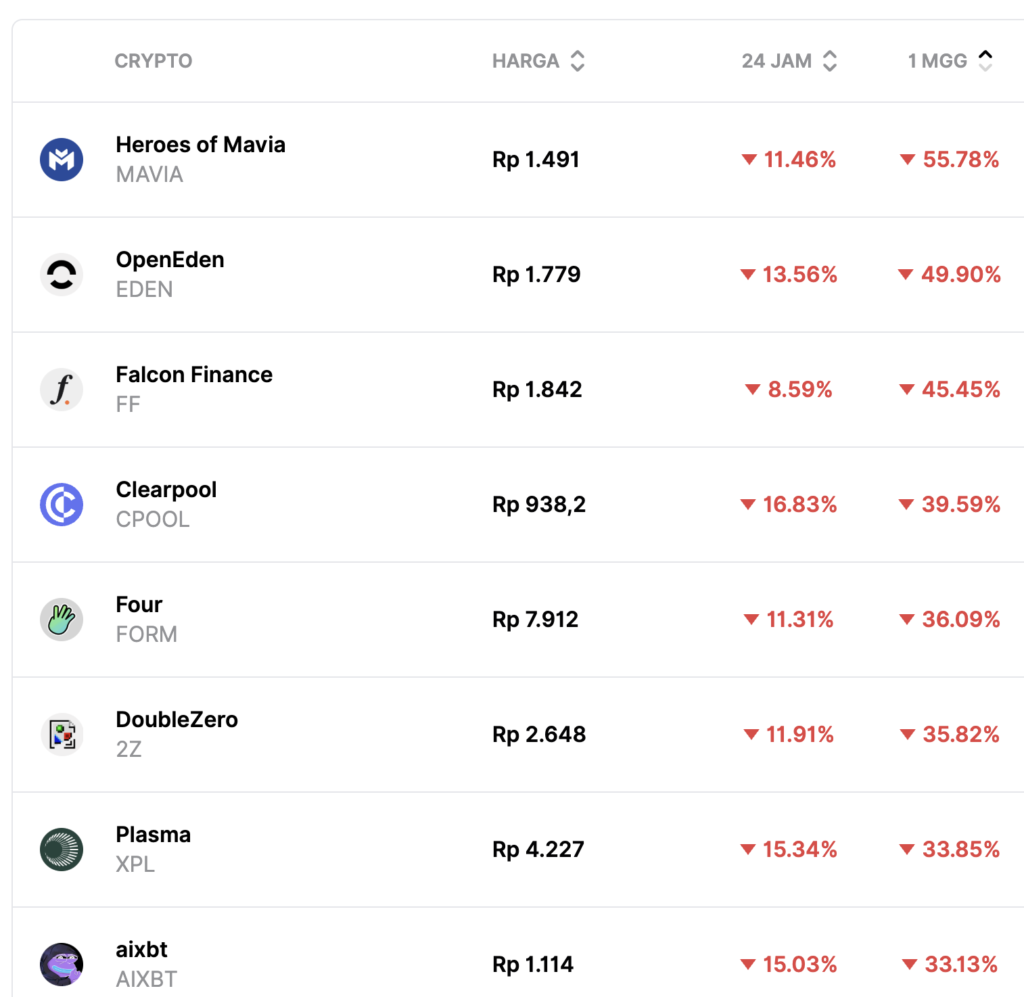
- Heroes of Mavia (MAVIA) -55.78%
- OpenEDEN (EDEN) -49.90%
- Falcon Finance (FF) -45.45%