Risk management is a mandatory aspect that every trader should have. This is done to keep losses and profits under control, so that price movements do not easily trigger emotional decisions. One strategy that supports the implementation of risk management is the use of the Risk Reward Ratio. This ratio is an important parameter for traders to measure potential profits with the risks taken. In this article, we will discuss how using the Risk Reward Ratio can help traders become more consistent and rational when making trading decisions.
Article Summary
- 🔎 Risk Reward Ratio measures how much a position can lose and gain.
- 🧠 Risk Reward Ratio helps traders maintain risk management of each trading transaction. With this ratio, traders can assess whether a trade is worth executing or not, based on the degree of equivalence between the potential profit and the risk of loss.
- 💸 The 1:2 ratio between risk and potential profit is one of the most commonly used ratios by professional traders as it is considered the most balanced.
Risk Reward Ratio Explanation
The Risk Reward Ratio is a comparison between potential profits and losses based on the risk of each trade taken. This tool helps traders calculate risk and profit more precisely to stay in line with established risk management.
In practice, traders who apply risk management usually determine the size of the risk for each trade, which is the maximum percentage of loss that can occur in one trading transaction. Generally, this figure is in the range of 1%-5% of the total capital.
By knowing the amount of risk for each trade, traders will find it easier to use the Risk Reward Ratio to determine:
- Target profit (Take Profit)
- Limit of loss (Stop Loss)
- Whether a position is worth taking or not
A common ratio that professional traders use is 1:2. This means that for every 1 USDT risked in a trade, traders target 2 USDT as potential profit.
Why is Risk Reward Ratio Important?
The Risk Reward Ratio helps traders assess whether a trade is worth taking based on a comparison between risk and potential profit.
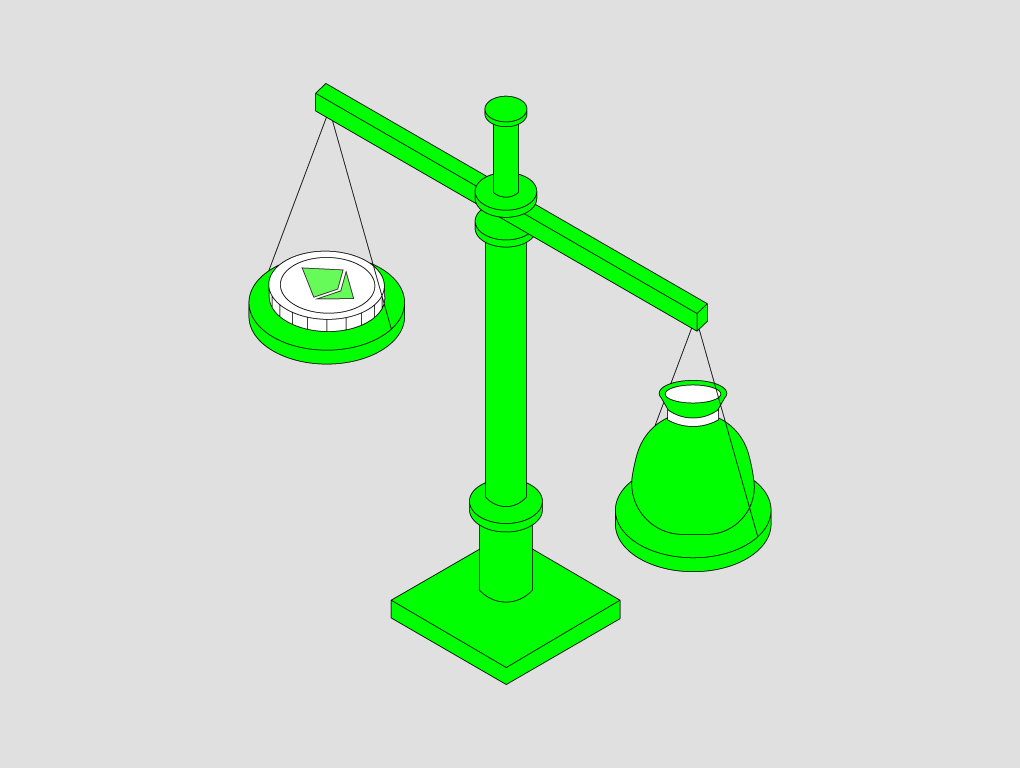
A simple analogy: you wouldn’t trade a McLaren for an Avanza, would you? Similarly, with the Risk Reward Ratio, if the potential profit doesn’t outweigh the risk, you shouldn’t trade.
Example of Risk Reward Ratio 1:2
| Capital | Total Trades | Circumstances | P/L Per Trade | Total P/L |
| 1,000 USDT | 40 | PROFIT | +20 USDT | +800 USDT |
| – | 60 | LOSS | -10 USDT (1%) | -600 USDT |
| TOTAL | 100 | – | – | +200 USDT |
If we look at the table above, a trader with a capital of 1.000 USDT, win rate of 40% out of 100 trades (40 profits and 60 losses) can still be in profit when using a Risk Reward Ratio of 1:2. Even though the number of losing trades is higher, the end result is still a profit of 20% of the total portfolio. This is because each loss is only 10 USDT, while each profit is worth double the risk taken, which is 20 USDT.
Example of Risk Reward Ratio 1:3
| Capital | Total Trades | Circumstances | P/L Per Trade | Total P/L |
| 1,000 USDT | 30 | PROFIT | +30 USDT | +900 USDT |
| 70 | LOSS | -10 USDT (1%) | -700 USDT | |
| TOTAL | 100 | – | – | +200 USDT |
It’s important to note that this ratio can be adjusted to suit each trader’s strategy. Some professional traders even use a ratio of 1:3, meaning that the profit target taken should be three times greater than the loss limit of each trade. With this ratio, even a 30% win rate would still allow traders to make a profit.
This is important because trading is not just about chasing big profits, but also about how traders are able to stay longer in the market despite consecutive losses.
How to Use Risk Reward Ratio
The Risk Reward Ratio can be used in various types of markets, both spot and perpetual futures. However, it is important to understand that these two markets have different mechanisms. In perpetual futures, there is a leverage feature that allows traders to open positions larger than their capital, so risk calculations must be done with more precision.
Also read the full article on the Difference between Spot Market and Futures Trading at Pintu Academy.
Whether in the spot or futures market, the Risk Reward Ratio remains inseparable from risk management. Basically, traders can open positions on any asset as long as there is validation of positive signals from either the technical or fundamental side, with one main condition that the loss of each trade does not exceed the predetermined risk tolerance limit.
1. Set Risk Limit For Each Trade
The first step in using the Risk Reward Ratio is to set a maximum loss limit for each trade. For example, let’s say you set the maximum risk at 1% of your total capital. If your capital is 1,000 USDT, then the risk of losing each trade is 10 USDT. In theory, it takes 100 consecutive losses to deplete your capital or liquidate.
2. Calculating The Ideal Position Size and Ratio
After determining the risk of each trade, the next step is to calculate the ideal position size so that losses do not exceed the tolerance limit. Using the previous example, the risk tolerance limit for each trade is 10 USDT.
For example, if you have a total capital of 1,000 USDT and want to open a position on perpetual futures, you don’t have to use all your capital to open a large position size if you prioritize risk management to stay longer in the market and keep losses under control within a predetermined limit.
| Total Capital | 1,000 USDT |
| Contract | SOLUSDT-PERP |
| Position Type | LONG |
| Position Size | 1 SOL |
| Leverage | 25x |
| Entry Price | $124 |
| Initial Margin (IM Buffer on) | 4,96 USDT |
| Available Margin | 995.04 USDT |
| Take Profit Price | $144 (+20 USDT) |
| Stop Loss Price | $114 (-10 USDT) |
| Risk Reward Ratio | 1:2 |
| Margin Ratio | 0,496% |
| Margin Mode | Cross margin |
Position size formula (long):
Position size = Risk of each trade / Entry Price – Stop Loss
Position size formula (Short):
Position size = Risk of each trade / Stop Loss – Entry Price
Also read the full article on What is IM Buffer at Pintu Academy
In the example above, the position size is very small as it only allocates about 4.96 USDT of the total capital of 1,000 USDT, or about 0.496%. The long position is 1 SOL at $124, stop loss is placed at $114 (🔻8.06% of the entry price) and take profit at $144 (🟢16.12% of the entry price). With this scenario, the maximum loss is 10 USDT, while the potential profit is 20 USDT, so the ratio used is 1:2.
Why use perpetual futures instead of the spot market?
Perpetual futures offer greater flexibility in opening trading positions. Not only do they allow traders to open long/buy positions, but also short/sell positions, so there is still potential for profit even if the market is bearish. This is why perpetual futures are often the choice of active traders.
If using the spot market, traders would need to allocate approximately 124 USDT (12.4% of their capital of 1,000 USDT) to purchase SOL assets. However, in the example above, using futures, a trader would only allocate 4.96 USDT (0.496% of 1,000 USDT). This means that capital can be used much more efficiently, and traders still have room to open several other positions as long as the risk is commensurate with the potential profit.
What size leverage can be used?
By knowing the risk limit on each trade, traders can use whatever leverage they want. However, there are two important things to note:
- The greater the leverage, the smaller the locked-in margin.
- The larger the position size, the narrower the loss tolerance space (the distance between entry and stop loss gets shorter).
In essence, traders should only focus on position size and the risk of losing each trade, not the amount of leverage. If the risk of each trade is small, you can consider opening a small position size as well. This is so that when the market is volatile, your position won’t be hit by a stop loss as quickly. This principle has been shown in the calculation example in the previous table.
How about a low win rate?
If your win rate is below 50% of total trades, consider using a ratio of 1:2 or 1:3. For a more conservative approach, a 1:1 ratio can also be chosen. Essentially, the bigger the desired profit target, the bigger the ratio should be. You can adjust the ratio according to the risk tolerance level of each trade and your trading strategy.
3. Determine Asset Position
Before calculating the Risk Reward Ratio, first determine the asset and the position to open. You can combine technical and fundamental analysis to determine the most potential assets.
- You can screen assets that have the potential to increase/decrease.
- Perform technical and fundamental analysis.
- Decide on a Long or Short position based on the results of your analysis and the validation you find in the market.
4. Execution
After that, you can also use the Risk Reward Ratio parameter and open a Long or Short position through Pintu Futures. You can access Pintu Futures through the mobile app or website. In this example, we will provide a tutorial through the website version to make it easier to apply the Risk Reward Ratio. Here’s how to use it effectively:
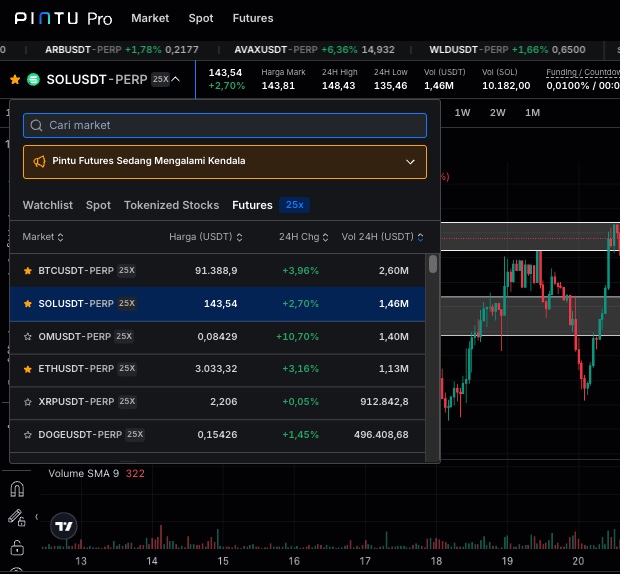
1.Open the Pintu website through this link: https://pintu.co.id/pro/id/trade/futures/SOLUSDT-PERP. Here, you can choose the contract you want to trade.
2. After choosing a contract, analyze the selected asset. You can use Support & Resistance or other technical analysis. That way, you can find out the crucial areas to determine the entry point.
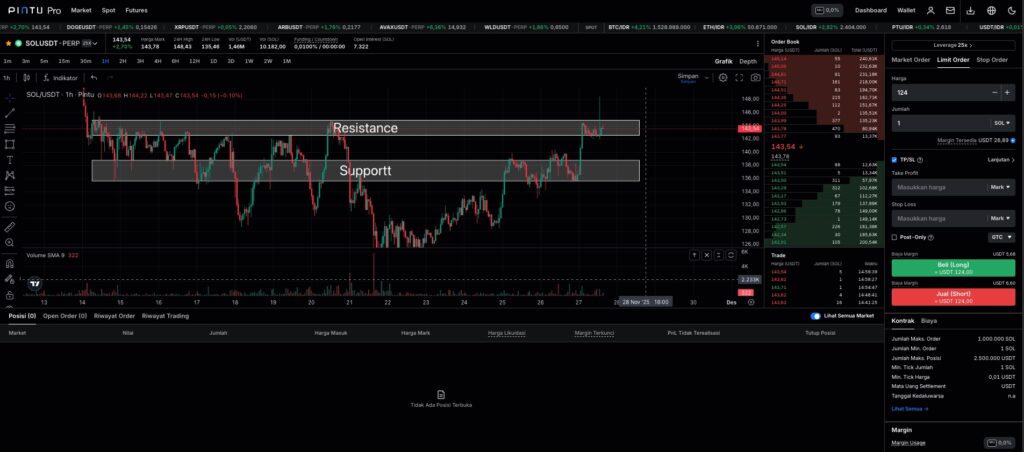
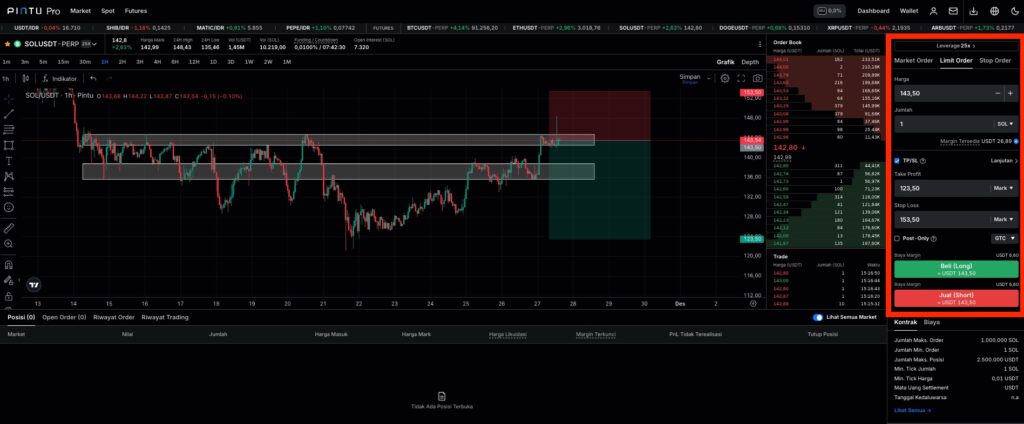
3. Select a Long Position or Short Position to start using the Risk Reward Ratio tool located on the left side of the chart.
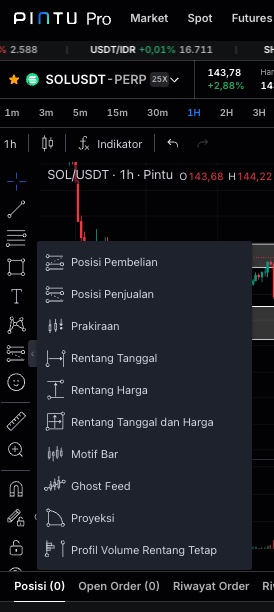
4. Click on the chart area, then adjust the Risk Reward Ratio by dragging the entry, stop loss, and take profit lines. You can also set it manually by double-clicking on the Risk Reward Ratio area.
Setup used:
- Contract: SOLPERP-USDT
- Quantity: 1 SOL (Short)
- Entry Price: $143,50
- Stop Loss: $153.50 (-10 USDT) up 6.97% from entry price
- Take Profit: $123.50 (+20 USDT) down 13.94% from entry price
- Risk Reward Ratio: 1:2
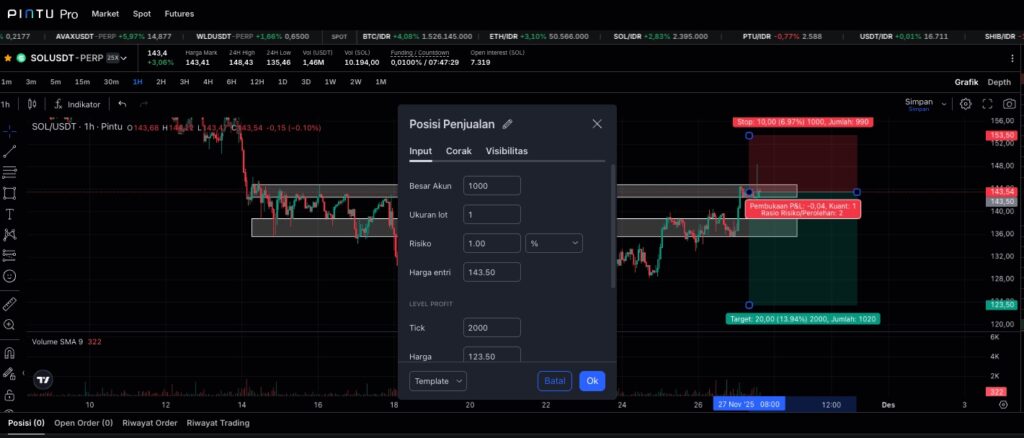
Before using the Risk Reward Ratio tool, you can easily set it up by first calculating the position size that matches the risk of each trade, the formula is in the previous discussion.
Once you have a clear idea of your position size, entry price, stop loss and take profit, enter them into the fields under “Sales Position”. That way, you’ll get a visualization of how much price movement is required to touch your risk limit per trade or reach your profit target along with the ratio.
Why is this trade a 1:2 ratio? Is it worth the risk?
The use of a 1:2 ratio is not without reason. Based on the results of technical analysis, this resistance area has proven to be quite strong in recent times. If the nearest support is successfullybroken, the chances of a price drop towards the next important level around $123 become much greater.
By placing a profit target in that area, the potential profit is double the risk, so this trade has a Risk Reward Ratio of 1:2 and is considered worth the risk to execute.
5. Specify the leverage, entry price, position size, take profit and spot loss. Then select “Short”.
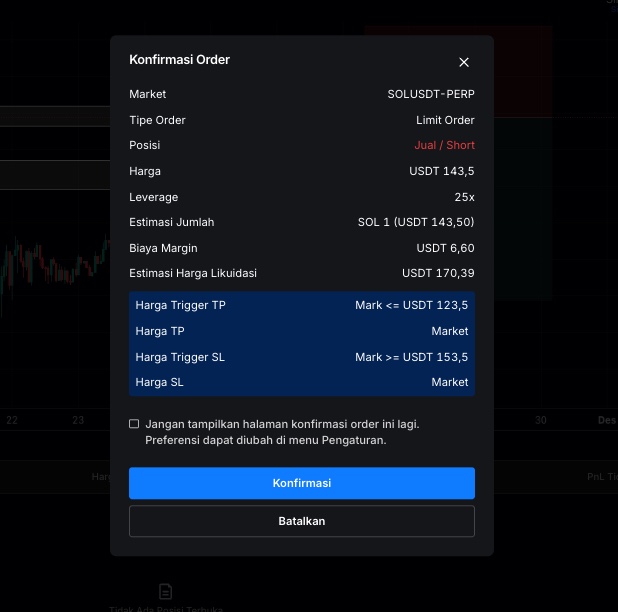
6. Confirm the order that has been made. Congratulations! You have successfully used the Risk Reward Ratio on Pintu Futures.
You can also access Pintu Futures directly through the Pintu app by selecting the Futures tab on the main page, or by navigating to it via the Market section in Pintu.
Disclaimer: All articles from Pintu Academy are intended for educational purposes and do not constitute financial advice.
Conclusion
Understanding the risk of each trade is key to accurately determining the Risk Reward Ratio. Although this tool is widely used in the futures market, risk can still be controlled as long as traders are disciplined and calculate losses correctly. Leverage won’t be a problem as long as you’re disciplined in maintaining the position size and risk of each trade. In addition, the Risk Reward Ratio serves as a visualization tool that helps traders see how far the potential price movement towards stop loss or take profit is. This way, trading decisions can be made in a more rational and measured manner.