
The cryptocurrency market is experiencing a notable disturbance due to the proliferation of news regarding the litigation launched by the United States Securities and Exchange Commission (SEC) against two major US-based exchanges, Binance and Coinbase. This lawsuit has had a deleterious effect on the overall cryptocurrency market, prompting a decline of approximately 5%. A comprehensive analysis of this situation is provided by the expert trading team at Pintu.
The Pintu trading team has gathered critical information and analyzed the general economic situation and the crypto market’s movements over the past week. However, it should be noted that all information in this Market Analysis is intended for educational purposes, not as financial advice.
Market Analysis Summary
- 📈 This week is set to be punctuated by several salient economic indicators, including the meeting of the Federal Open Market Committee (FOMC) and reports from the Institute of Supply Management (ISM) indicating a surge in the service sector throughout May.
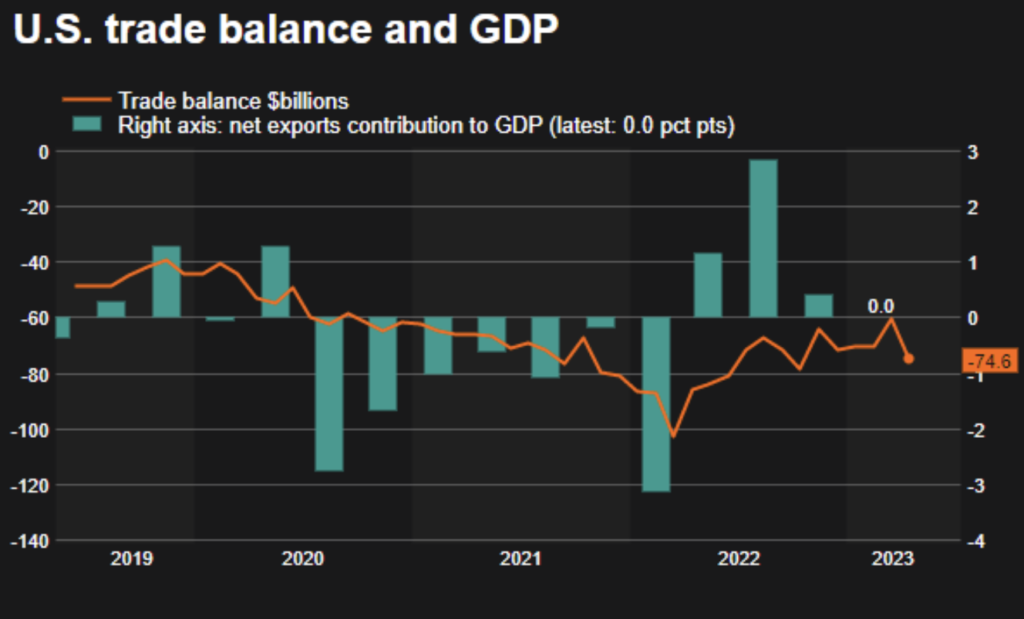
- 🆘 The United States’ trade deficit escalated by 23.0%, reaching $74.6 billion in April, marking the most substantial expansion of the trade deficit in the last eight years. This could have detrimental implications for economic growth in the second quarter.
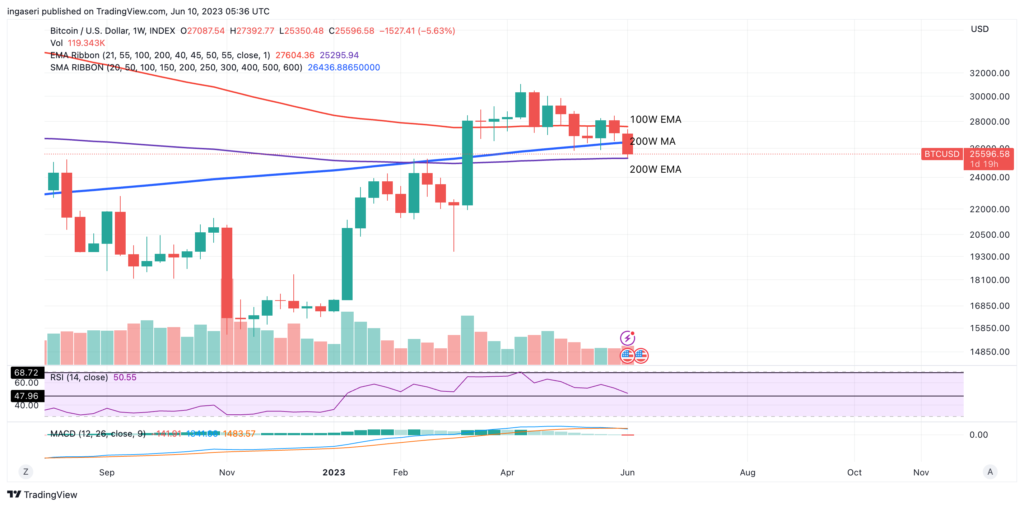
- 🔴 As a consequence of the SEC’s charges, BTC has breached the support area of the 200 Week Moving Average (MA). In contrast, Ethereum investors have opted to stake ETH as a mechanism to mitigate further risks.
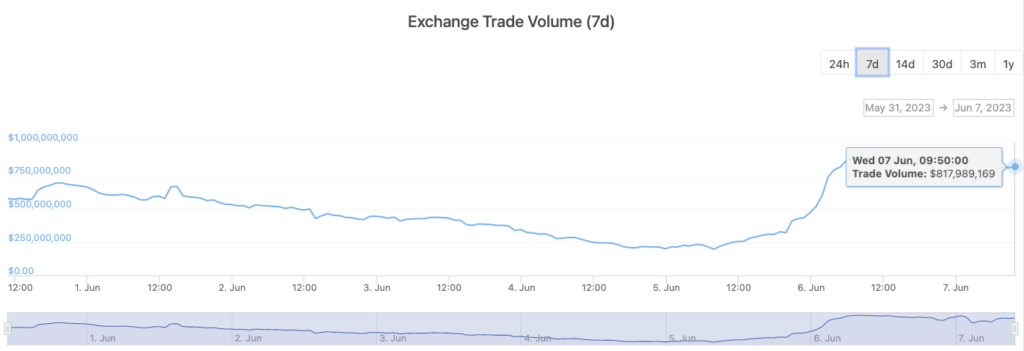
- 💸 The last two days have witnessed a surge in trading volume on Decentralized Exchanges (DEX), reaching up to $800 million, with Uniswap and Pancake Swap accounting for half of the total trading volume.
Macroeconomic Analysis
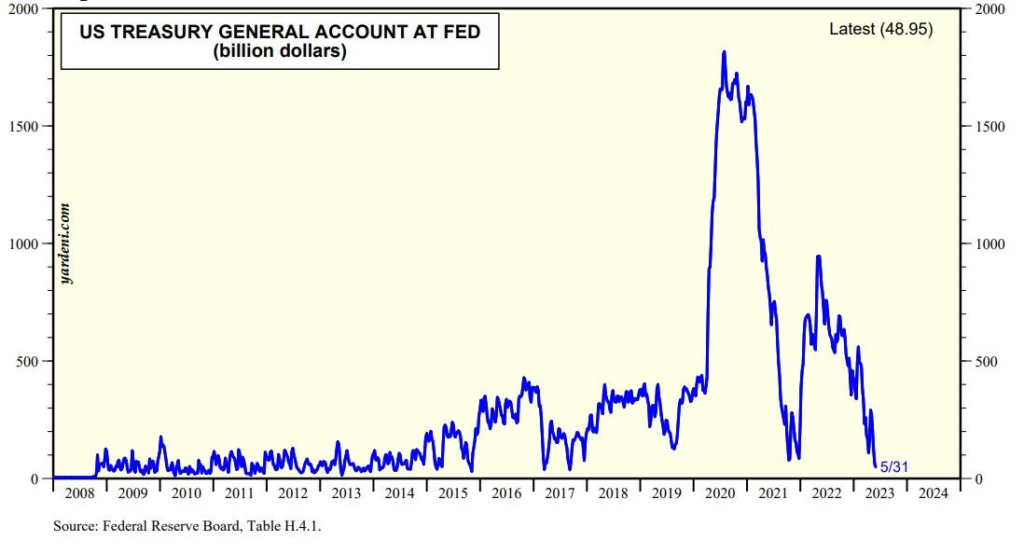
Unlike the previous week, there are only a few economic indicators this week. The Federal Open Market Committee (FOMC) meeting, scheduled for June 14th and 15th, is also expected to be relatively placid. Furthermore, with the recent signing into law of a new debt ceiling agreement by the U.S. President Joe Biden, the U.S. Department of Treasury is expected to introduce a substantial volume of securities into the fixed income market this week to replenish checking account balances.
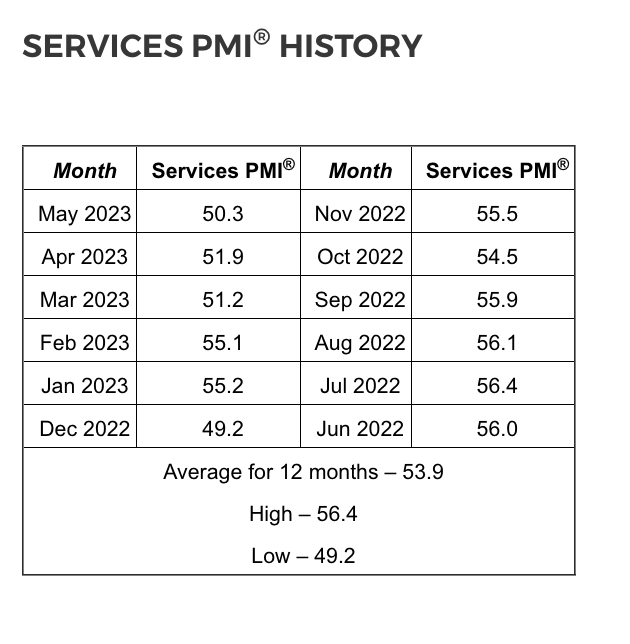
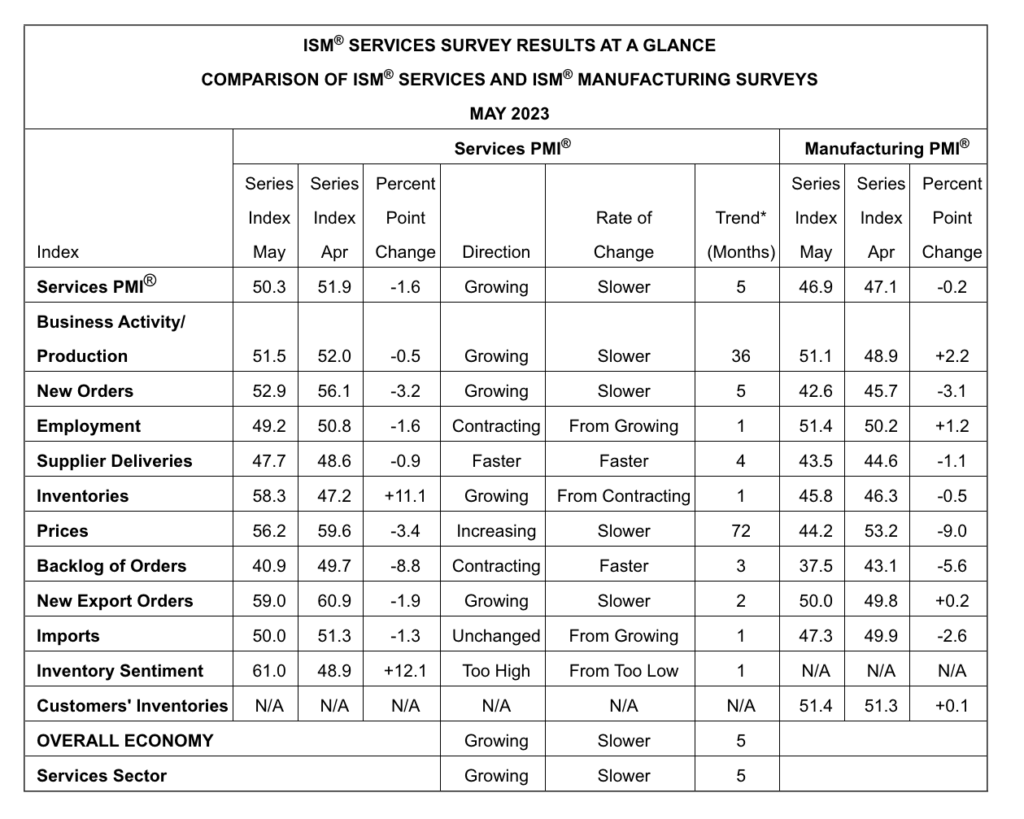
The latest report from the Institute for Supply Management (ISM) for the services sector showed that the sector expanded for the fifth consecutive month in May, with the Purchasing Managers’ Index (PMI) for the services sector coming in at 50.43%, compared with the consensus of 52.2 and the previous reading of 51.9. In addition, purchasing and supply executives in the United States have confirmed that this sector has expanded in 35 of the last 36 months, with the only exception being the contraction in December of last year, when there was a 1.6 percentage point decrease each month. A reading above 50 percent indicates that the service sector economy is generally expanding, while a reading below 50 percent indicates that the service sector economy is generally contracting.
In terms of whether there is a contraction in the service sector in general, the latest service sector updates for May point to a gradual economic slowdown. Similar to last week’s manufacturing updates, improvements in order backlogs and supplier delivery times were noted in tandem with a decline in the growth rate of demand. It is worth noting the degree of improvement in supplier delivery times, which has not been seen since the end of the recession during the global financial crisis.
Speaking of last week’s ISM manufacturing report, from a business perspective, it does indeed show a slowdown in demand growth. However, when combined with a relatively improved supply chain situation and reduced price pressures, this development actually assures the Federal Reserve that its efforts to combat inflation are beginning to make progress. This may be the case even with continued strong job growth as outlined in the Nonfarm Payrolls report.
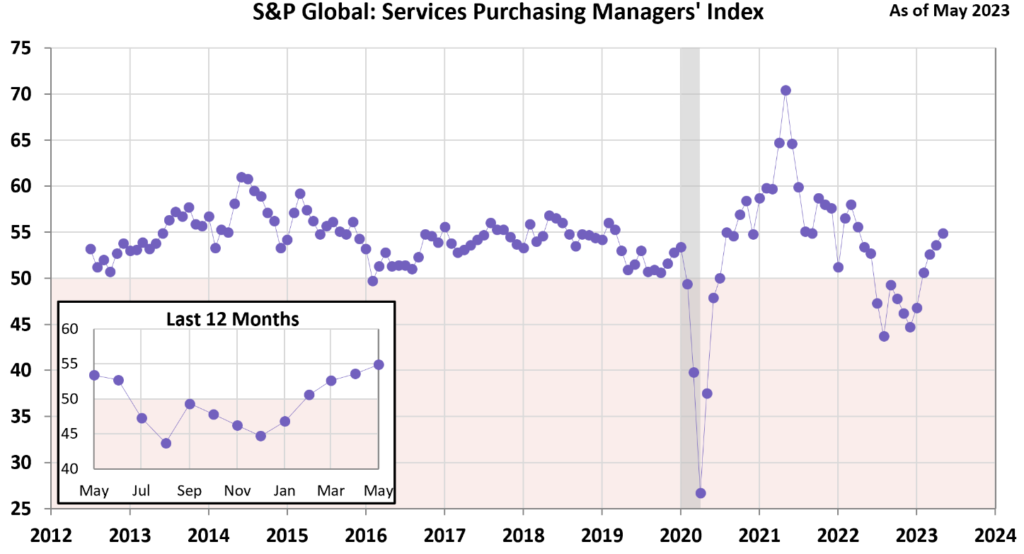
S&P Global’s U.S. Services Purchasing Managers’ Index (PMI) for May came in slightly lower at 54.9 versus an estimated 55.1. Nevertheless, the index remains in expansion territory for the fourth consecutive month and is at its highest level in over a year.
Digging deeper into the economic landscape, the U.S. experienced its largest widening of the trade deficit in eight years this April, with the deficit rising 23.0% to $74.6 billion. This increase in the deficit was driven by a rise in goods imports coupled with a decline in exports of energy products. It raises concerns that if this condition persists, it could negatively impact economic growth in the second quarter.
According to a report from the U.S. Department of Commerce last Wednesday, this increase in the trade deficit is the largest since April 2015, culminating in the trade gap reaching its highest level in the past six months. Economists are currently forecasting that trade could subtract as much as 2.5 percentage points from gross domestic product (GDP) in the third quarter of 2023. However, this scenario could materialize if imports begin to decline.
However, this could be constrained by the continued strength of domestic demand. In addition, factors such as a robust dollar and subdued global demand could restrain export growth.
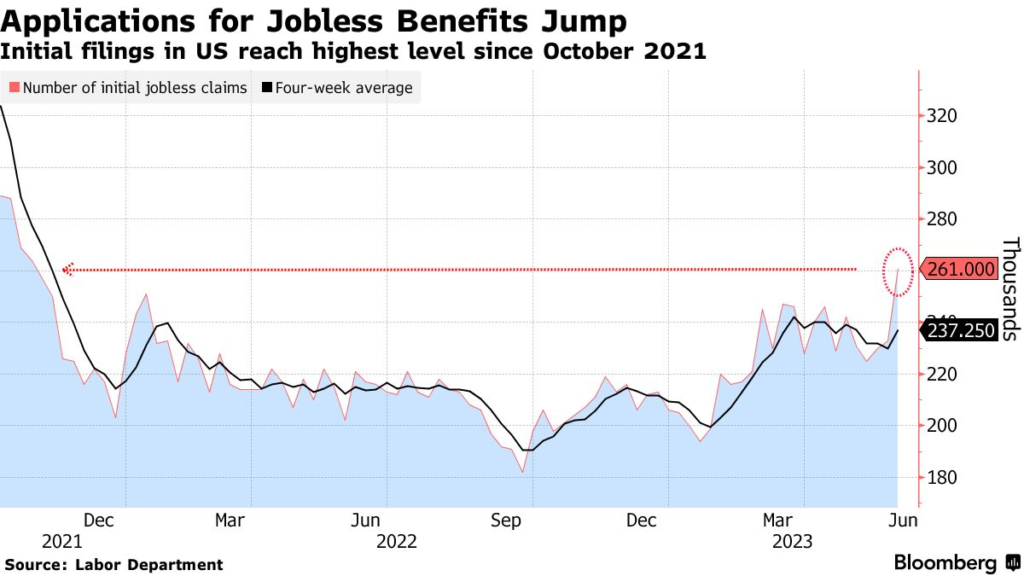
Moving on to the Unemployment Claims data released by the U.S. Department of Labor on Thursday, June 8th, it was reported that initial jobless claims totaled 261,000 for the week ending June 3rd. This figure is higher than the previous week’s figure of 233,000 and exceeds market expectations of 235,000. This figure represents the highest level since October 2021.
In its press release, the Labor Department reported that the four-week moving average for unemployment claims was 237,250, an increase of 7,500 from the previous week’s average, which was revised upward by 250 to 229,750.
Furthermore, the number of continuing claims decreased by 37,000 for the week ending May 27, reaching a total of 1.757 million, lower than the forecasted 1.8 million. This figure represents the lowest level since February, with the four-week moving average for continuing claims being 1.784 million, marking a decline of 12,000 from the previous week’s average.
BTC & ETH Price Analysis
The cryptocurrency market experienced significant turbulence last week when the Securities and Exchange Commission (SEC) filed lawsuits against cryptocurrency exchanges Binance and Coinbase. If these lawsuits are successful, the SEC has the potential to reshape the cryptocurrency market by asserting its authority over the crypto industry. This comes despite years of litigation in which the industry has argued that a token does not qualify as a security and therefore should not be subject to SEC regulation.
The SEC has even gone to court to freeze funds held by Binance US, which has led to a premium on major tokens compared to other exchanges. Since then, there has been a large outflow of funds from Binance, with the net outflow reaching 14,000 BTC, marking the 8th largest outflow in the platform’s history.
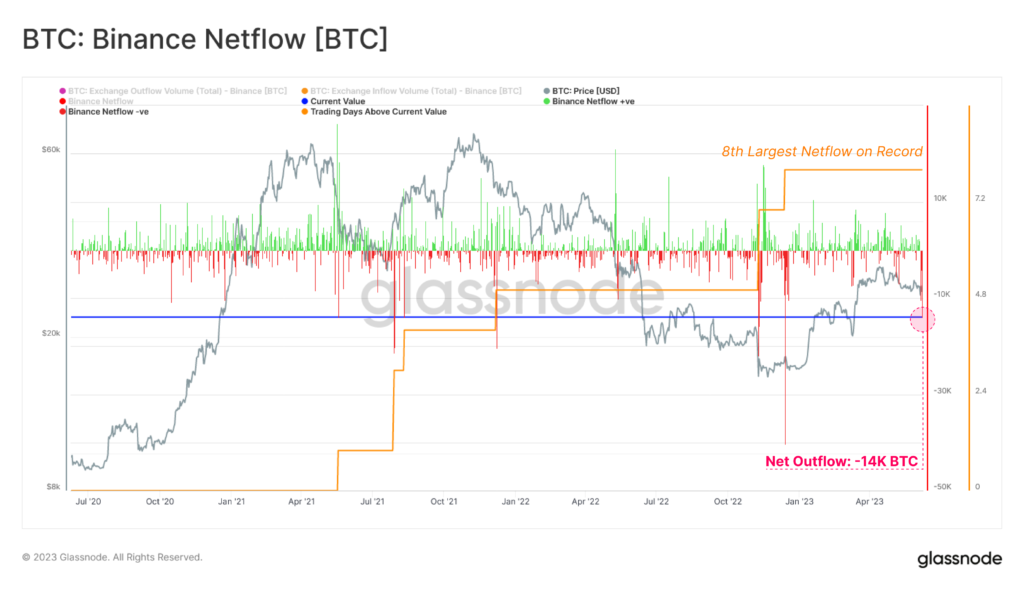
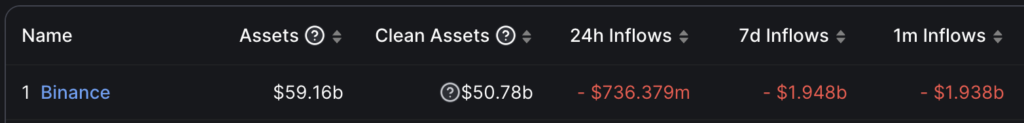
Binance’s net outflow over the past 7 days approached nearly $2 billion USD.
In response to the SEC’s charges against Binance and Coinbase, trading volume on decentralized exchanges (DEX) has surged to $800 million in the past two days. Uniswap and Pancake have the largest share, accounting for half of the total DEX trading volume.
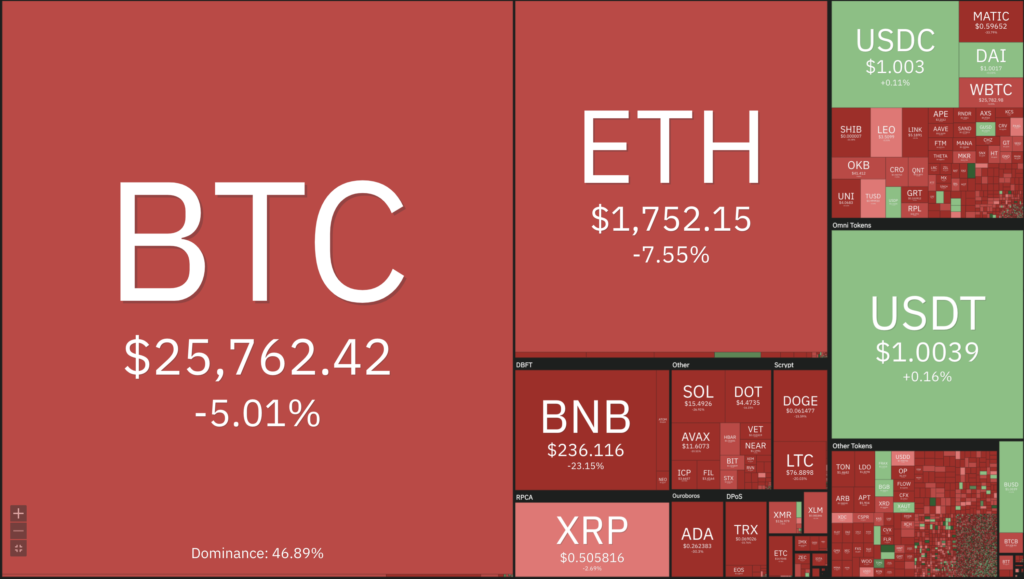
The lawsuit filed by the SEC against Binance included 10 tokens, namely SOL, ADA, MATIC, FIL, ATOM, SAND, MANA, ALGO, AXS, BNB and COTI. Notably, ETH was not among the tokens named in the litigation. SEC Chairman Gary Gensler has consistently refrained from taking a clear position on whether ETH and its underlying cryptocurrency should be considered securities. Although ETH is often viewed as an investment vehicle, suggesting a potential classification as a security, it is also used as a medium of exchange across various protocols. This dual role tilts its function more towards a currency than a security.
Amidst the lawsuit filed by the Securities and Exchange Commission (SEC) against cryptocurrency exchanges, the prices of BTC and ETH experienced a rebound as investors considered them as safe options.
However, this rebound was transient. Over the weekend, the cryptocurrency market faced further deterioration, with the prices of major cryptocurrencies plunging by as much as 5%.
This depreciation has caused BTC to break through its most important historical support area, the 200-week moving average (MA). This has historically correlated with the macro bottoms of the major cryptocurrencies. Uncertainty surrounding the SEC’s next steps has added further volatility to the cryptocurrency market. Next support for BTC is at $25,000, the 200-week exponential moving average (EMA) with resistance at $26,500, the 200-week MA, $27,500, and the 100-week EMA.
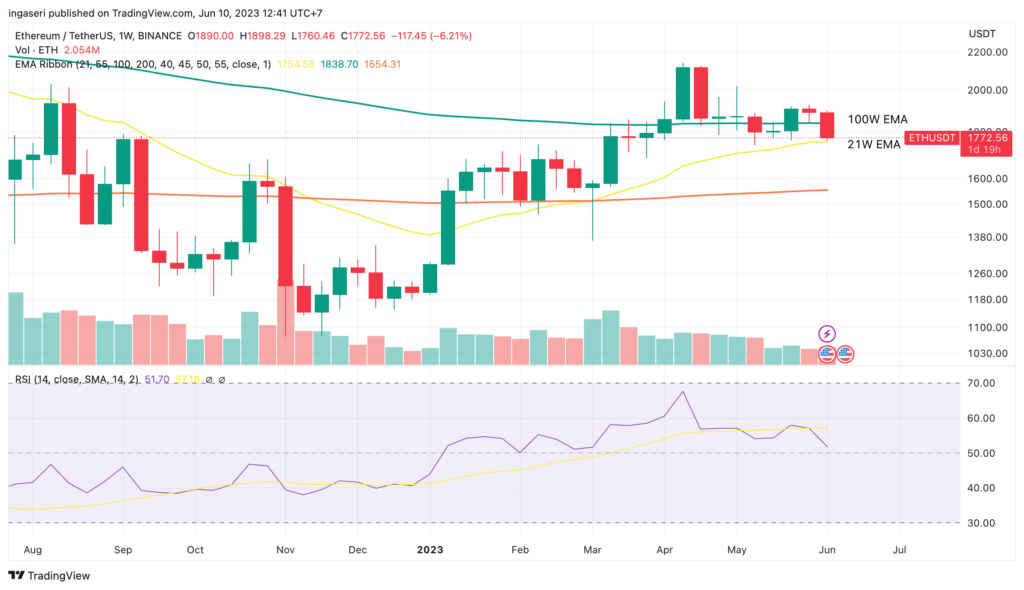
Not only did BTC experience a downturn. ETH also plunged -6.5% over the week, with its 21-week exponential moving average (EMA) providing support. Although on-chain data shows a significant increase in ETH bets as investors moved capital out of troubled memecoins and altcoins following the SEC lawsuit. With many altcoins experiencing price declines, investors are now seeking refuge in the returns of ETH stakes to mitigate risk. Between June 1 and June 8, ETH holders added an additional 1 million ETH to their stakes. Exchange order books also show that demand for ETH in the market is starting to outpace supply.
On-Chain Analysis
- 📊 Exchange: As the exchange reserve continues to rise, it indicates higher selling pressure. Net deposits on exchanges are low compared to the 7-day average. Lower deposits can be interpreted as lower selling pressure.
- 💻 Miners: Miners’ are selling more holdings compared to its one-year average. Miner’s revenue is in a moderate range, compared to its one-year average.
- 🔗 On-chain: More investors are selling at a profit. In the middle of a bull market, it can indicate a market top. Long term holders’ movement in the last 7days were lower than the average. They have a motive to hold their coins. Investors are in an anxiety phase where they are currently in a state of moderate unrealized profits.
- 🏦 Derivatives: Long position traders are dominant and are willing to pay to short traders. Buying sentiment is dominant in the derivatives market. More buy orders are filled by takers. As open interest decreases, it indicates investors are closing futures positions and possibility of trend reversals. In turn, this might trigger the possibility of long/short-squeeze caused by sudden price movement or vice versa.
- 🔀 Technicals: RSI indicates a neutral condition. Stochastic indicates a neutral condition where the current price is in a moderate location between the highest-lowest range of the last 2 weeks.
News About Altcoins
- Optimism launches Bedrock Upgrade: A significant step toward superchain. On June 7, Ethereum’s layer 2 scalability solution Optimism successfully completed the Bedrock update, bringing the blockchain closer to becoming a “superchain” made up of many interoperable mini-blockchains. The update aims to improve the chain’s functionality, reducing deposit confirmation time from 10 minutes to 1 minute and lowering gas fees by 40%. In addition, Bedrock is transforming Optimism into a multi-client ecosystem to strengthen the blockchain’s stability.
- Unstaking Surges: Over 3 Million ETH Withdrawn After Shangai Upgrade. According to OKLink, as of June 10, more than 3 million ETH have been withdrawn from staking since the Shanghai upgrade. The current number of validators is 608,332, with a total of 19.47 million ETH staked. Despite the withdrawal of 3 million ETH, there has been an influx of over 3.3 million ETH into Ethereum stakes since the Shanghai upgrade.
News from the Crypto World in the Past Week
- Venture capital firm sues Curve founder for alleged misappropriation of funds. According to a June 9 DL News report, Michael Egorov, founder of Curve, has been sued by three venture capital firms, namely ParaFi, Framework Ventures and 1kx, for fraud and “misappropriation of trade secrets” causing financial losses. These three firms invested $1 million in Curve in 2020. Egorov is accused of moving the investment into Curve’s cash pool. The companies allege that nearly $1 million of their funds were never returned, nor did they receive tens of millions of dollars worth of CRV tokens. Egorov is accused of making untrue statements about the placement of his assets in Curve Finance (Swiss Stake GmbH), and instead of relinquishing control to the Curve DAO, he sold CRV tokens for personal gain and retained significant control.
Cryptocurrencies Market Price Over the Past Week
Cryptocurrencies With the Best Performance
- Pax Gold (PAXG) +0,31%
- Tether (USDT) +0,06%
- USD Coin (USDC) +0,01%
Cryptocurrencies With the Worst Performance
- Dash (DASH) -19,12%
- Chiliz (CHZ) -17,12%
- ApeCoin (APE) -15,99%
- Optimism (OP) -14,49%
References
- Margaux Nijkerk, Optimism Completes ‘Bedrock’ Hard Fork, in Pursuit of Superchain, Coindesk, accessed on 11 June 2023.
- Ekin Genc, VC trio sues Curve founder for ‘deception’ and handling of trade secrets, Dlnews, accessed on 11 June 2023.
- Oklink, Shapella 升级, accessed on 11 June 2023.