
The stock and crypto markets have seen a considerable decline in the last week. One of the factors is the result of the macroeconomic conditions that are still bad. So, how do Bitcoin and Ethereum prices move in response to these influences? Take a look at the market analysis below.
The trader team of Pintu collects various important data about the price movements of the crypto asset market over the past week which is summarized in this Market Analysis. However, you should note that all information from this Market Analysis is for educational and informational purposes, not financial advice.
Market Analysis Summary
- 🏦 The Fed minutes reveal a 50 or 75 bps rate hike in the next month is considered reasonable and is likely to raise rates through 2023.
- ️⚖️ BTC is trying to get out of the bear flag. Based on the history of Bitcoin, BTC usually does a dump after breaking out of this pattern.
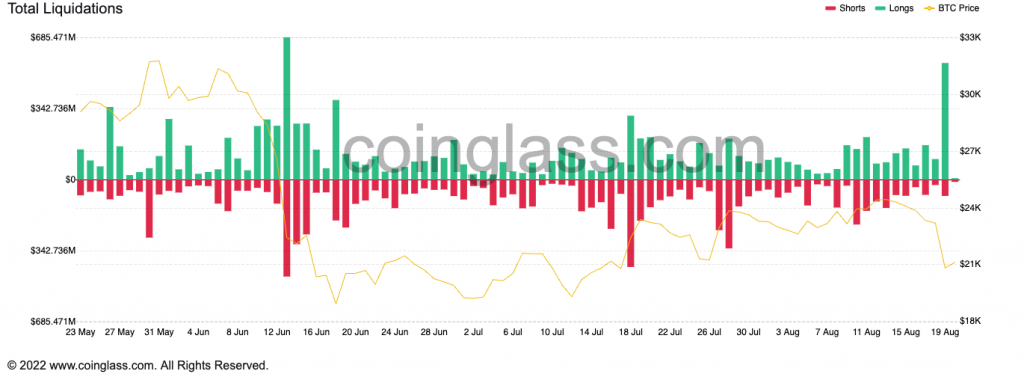
- 📉 A total of $640 Million US dollars was liquidated on August 19 following the announcement of the Fed minutes.
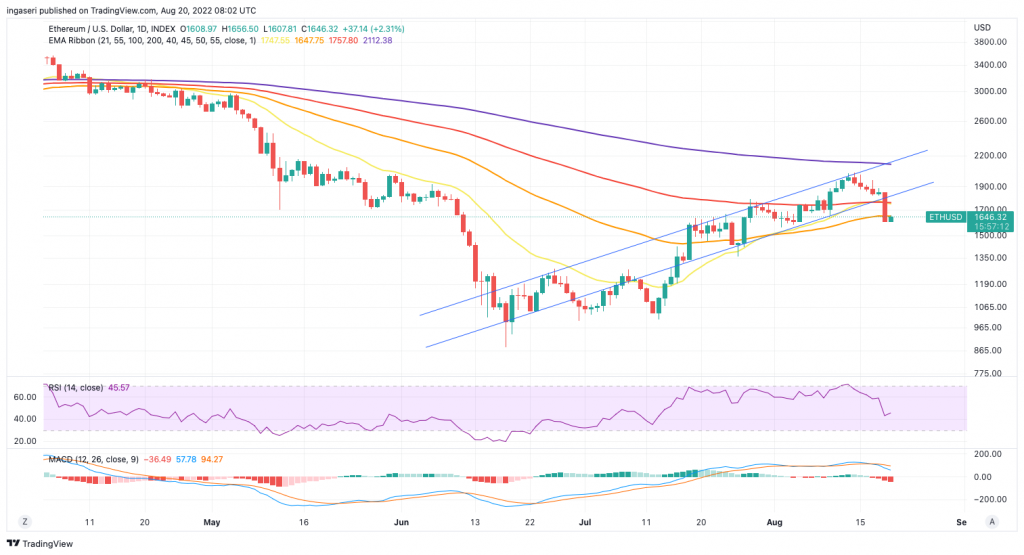
- 🧠 ETH briefly dropped below the 55-day EMA and the current resistance level is at $1650 US dollar.
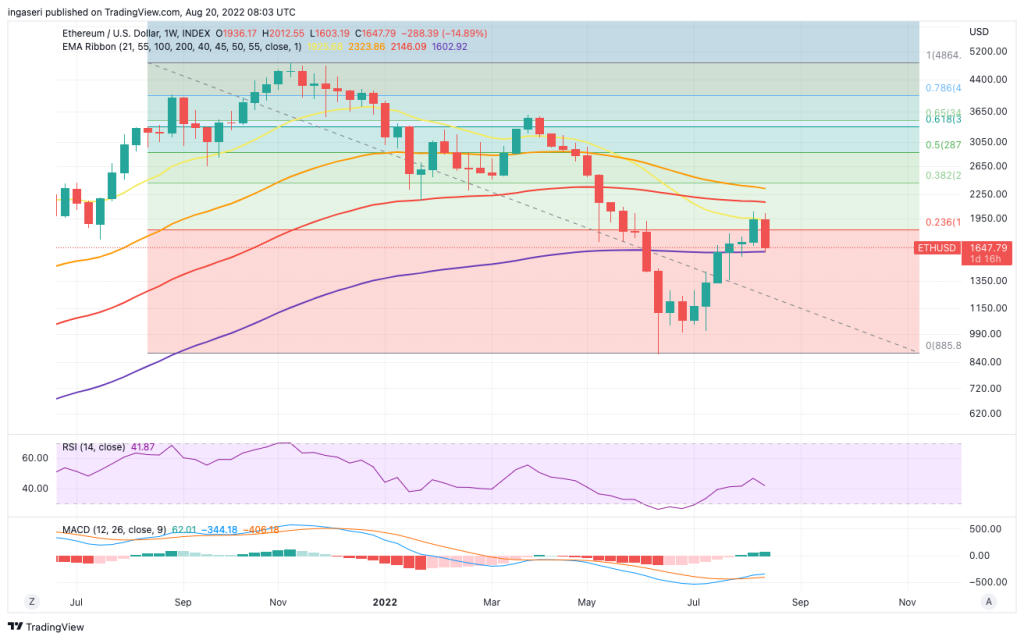
- 🔍 ETH has been on a downward trend since it was unable to get out of the Fibonacci gold pocket in April 2022.
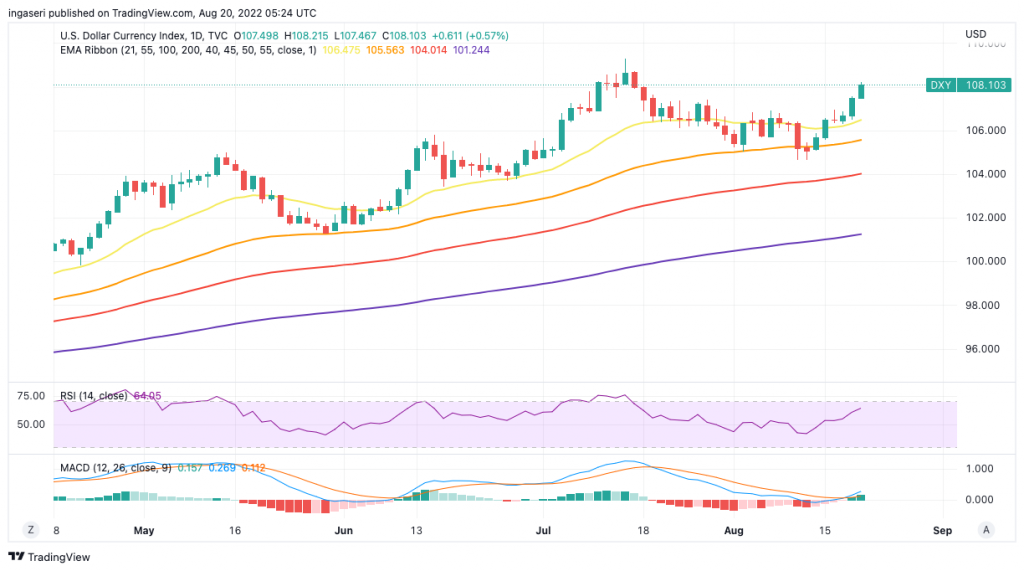
DXY Index
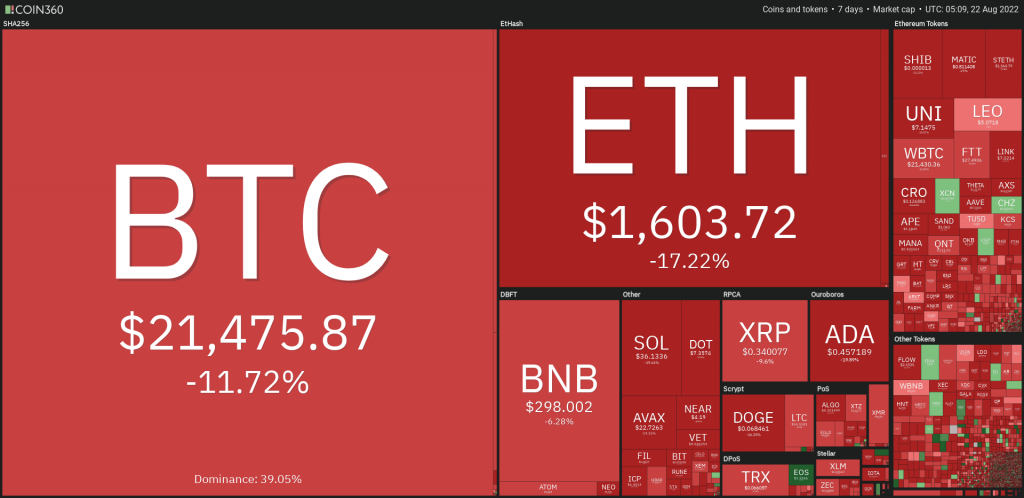
Stock and crypto markets fell following the release of the Federal Reserve minutes of meeting from July. The Fed voiced support for a major rate hike at its September policy meeting. The S&P 500 and Nasdaq Composite indexes posted their first weekly losses after four straight weeks of gains. Moreover, a 50 or 75 bps rate hike next month is considered reasonable and the Fed is likely to raise rates through 2023. Lastly, BTC is down 12.5% last week and ETH is down almost 15%.
DXY increased after the Fed’s note was released on August 18. Now, DXY has broken through the 55 and 21-week EMA resistance lines.
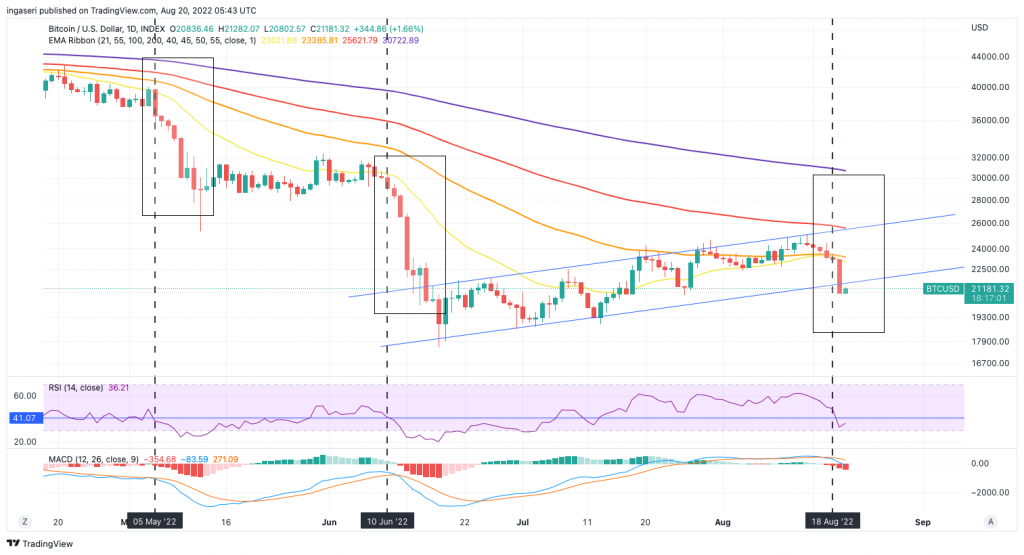
BTC Price Movement 15-21 August 2022
Bitcoin price stumbles after its daily RSI fell below a significant support point of 41. Looking back on the previous 2 occasions when that happened, the price fell as well. Bitcoin is currently trying to break out of the bear flag. Based on what happened, BTC will dump once it breaks out of this pattern.
Simultaneously, we are below the 21-day EMA after making it a support point since late July. Also, pay attention to how the daily MACD crosses. All these signals lead to a significant price correction which is unavoidable. We have to rise above the price of 21.5K US dollars to stay inside the bear flag zone.
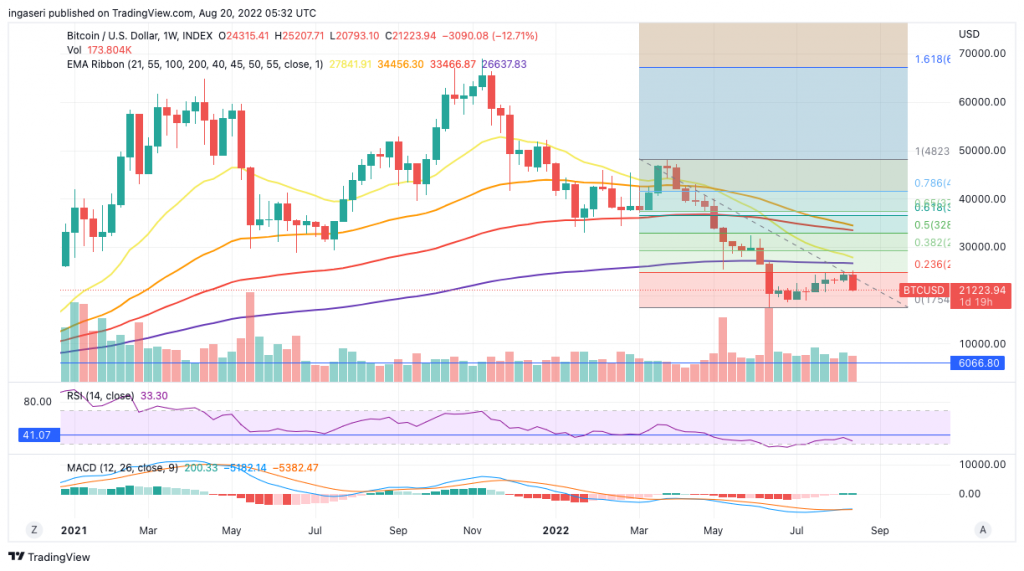
In the weekly chart, we can see that the BTC price found the 0.236 Fibonacci zone as a strong resistance line. BTC has been trying to break through this line for 4 weeks in a row.
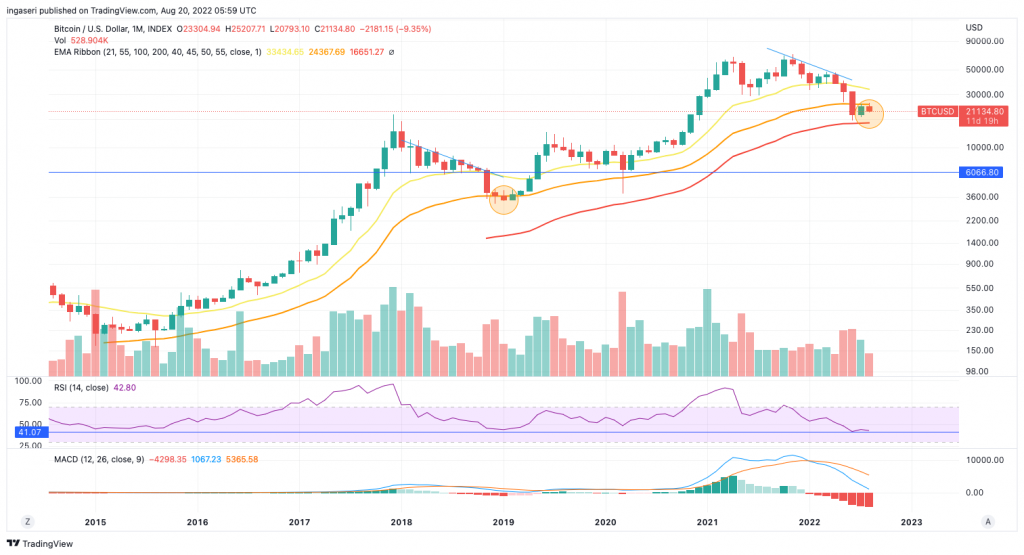
In the longer term, the monthly chart shows BTC has spent 2 months below the 55-month EMA line. Previously, BTC also spent 2 months below this line in Jan-Feb 2019. If we can’t break this resistance point, this is the first time BTC spent more than 2 months below the 55 Month EMA line.
You can learn why the EMA indicator is often an important point.
A total of $640 Million US dollars was liquidated on August 19 following the announcement of the Fed’s minutes.
Ethereum Price Movement 15-21 August 2022
ETH is down 15% last week. On the daily chart, ETH has dropped from the support line of the 55-day EMA, climbs back up, and is currently trying to break it. ETH’s first point of resistance is at $1,650 and the next one is at $1,760.
Learn how to do the technical analysis so that you can buy at the right price.
On the weekly chart, ETH tried to break out of the 21-week EMA resistance line but failed. The current support point is $1,600 US dollars and the next one is at $1,500 US dollars. ETH has been on a downtrend since it was unable to exit the Fibonacci gold pocket area in April 2022 ($3,650 US dollars).
On-Chain Analysis
- 📊 Exchange: As the exchange reserve flattens, it indicates no buying or selling pressure. Net deposits on exchanges, however, are high compared to the 7-day average. Higher deposits can be interpreted as higher selling pressure.
- 💻 Miners: Miners are selling holdings in a moderate range compared to their one-year average. Miner’s revenue is in a moderate range, compared to its one-year average.
- 🔗 On-chain: More investors are selling at a loss. In the middle of a bear market, it can indicate a market bottom. Long-term holders’ movement in the last 7 days was lower than the average. They have a motive to hold their coins. Investors are in a capitulation phase where they are currently facing unrealized losses. It indicates the decreasing motive to realize loss which leads to a decrease in sell pressure.
- 🏦 Derivatives: Short-position traders are dominant and are willing to pay long traders. As OI decreases, it indicates investors are closing futures positions and there’s a possibility of a trend reversal. In turn, this might trigger the possibility of a long/short-squeeze caused by sudden price movement or vice versa.
Altcoins News
- ⚽ STEPN launches NFT with Atlético Madrid: STEPN, the move-to-earn app on Solana, has just announced a partnership with La Liga football club Atletico Madrid. STEPN will launch an NFT collection containing 1,001 NFT shoes with the Atlético Madrid theme. There are 11 rare shoes from the NFT collection themed on the club’s starting players.
More News from Crypto World in the Last Week
- 🐵 BAYC’s NFT collection prices fall: Market analysis shows that the largest NFT collection, the Bored Ape Yacht Club (BAYC), has seen significant price drops over the past few weeks. Currently, BAYC’s NFT price is at 65.68 ETH, the lowest price since January 2, 2022. In addition, BAYC has been experiencing price declines since May 2022.
- 🪧 Demonstrations against Alexey Pertsev’s arrest: Dozens of demonstrators gathered in Amsterdam to protest against the arrest of Alexey Pertsev, a developer of crypto app Tornado Cash. The Dutch financial crime agency, FIOD, arrested Alexey on suspicion of “involvement in concealing criminal financial flows and facilitating money laundering.”
- 🗒️ Deputy Prime Minister of Ukraine releases a report on crypto donations: Mykhailo Fedorov, Deputy PM and Minister of Digital Transformation of Ukraine released a report on the use of donated funds from the crypto community. Most of these funds are used to buy war equipment.
Cryptocurrency Market Price Over the Past Week
Cryptocurrency With the Best Performance
- EOS (EOS) +14,32%
- Chiliz (CHZ) +6,28%
Cryptocurrency with the Worst Performance
- Lido DAO (LIDO) -27,46%
- Curve (CRV) – 27,47%
- NEAR Protocol (NEAR) -27,38%
- Thorchain (RUNE) -25,35%
- Gala Games (GALA) -25,26%
References
- Tim Hakki, Solana Move-to-Earn App Stepn Launches NFT Collab With Atlético de Madrid, Decrypt, accessed on 22 August 2022.
- Stephan Roth, Bored Ape Yacht Club NFTs Ethereum Floor Price Drops to 8-Month Low, Decrypt, accessed on 22 August 2022.
- Jack Schickler, Tornado Cash Developer’s Arrest in the Netherlands Draws Community Protest, Coin Desk, accessed on 22 August 2022.
- Mykhailo Fedorov (@FedorovMykhailo), accessed on 22 August 2022, https://twitter.com/FedorovMykhailo/status/1559923193581899777.