
BTC and ETH Price Movement 23-29 May 2022

Over the past week, we have seen BTC form a fractal and move sideways. However, if we look at the long-term downward movement of BTC’s price, there is a bear flag pattern falling to the support point of 28-30K (at the time of writing). If we take the equivalent downside pattern from its ATH and place it at the end of the descending bear flag pattern, the price of BTC that should be “bottoming” is at 12k US dollars (though this is an extreme case). This price is a confluence with the lower range resistance in 2019 and 2020.
| Years | Before death cross | After death cross (more drop) |
|---|---|---|
| 2013 | -73% | -70% |
| 2017 | -70% | -65% |
| 2019 | -53% | -55% |
| 2020 | -63% | +1581% |
| 2021 | -56% | +141% |
| 2022 | -43% | -37% currently |
Let’s go back to the bearish death cross as mentioned in the previous week’s analysis. A defined death cross occurs when the 50 EMA crosses below the 200 EMA on the daily chart. The table above shows the percentage decrease just before a death cross and after a death cross each time we have a death cross.

Based on data from 2013, 2017, and 2019, the decline after the death cross is usually equivalent to the decline before the death cross. A drop of -43% means BTC will hit 23k US dollars, which is in line with the 200-week MA and 55-month EMA. This is an important support point based on Bitcoin’s historical support line at its lower price range.

On the weekly chart, if BTC closes below 30,300 US dollars, this will be the first time Bitcoin has had 9 consecutive red candlesticks.

Three weeks after the Open Market Committee meeting, the Fed releases the minutes of their meeting. The report indicates policy tightening which means the Fed will not stop until inflation is back on track towards its 2% target. This is a strategy that signals policy will be more data-oriented after the Fed meetings in June and July.
Stocks rose after the minutes were published, while yields on Treasury notes fluctuated and the dollar pared gains. The market continues to show traders are already pricing in 100 basis points of rate hikes that will occur in the next two meetings.
Most market participants judge that a 50 basis point increase in the target range is likely to be in line over the next few meetings. The government is also finalizing a plan to allow its $8.9 trillion dollar balance sheet to start shrinking, putting additional pressure on borrowing costs.

Ahead of the merge scheduled for August, the ETH beacon chain ran into a hiccup in the form of a block reorganization of seven blocks on Wednesday, May 25. This could present a potential security risk to the network. The term reorganization refers to an event in which a block from the canonical chain, such as a beacon chain, is knocked out from the chain because it lost while competing with another block. This could happen due to a malicious attack from a high-resource miner or a bug. The incidents cause the chain to fork or unintentionally duplicate.
At this point, the developer believes that this issue is due to circumstances rather than something serious such as a security issue or design flaw, with “proposer boost fork” as the prime suspect. This term refers to a method by which a certain proposer is given priority to select the next block.
This pressured the price of ETH, which fell 8% in one day and -14% for the whole week.
Support levels for ETH are at $1500 and $1700 US dollars. We see ETH holding firm at the $1700 support which is the Fibonacci retracement point. This figure is also a converging point with the descending support line drawn at the top on Nov.
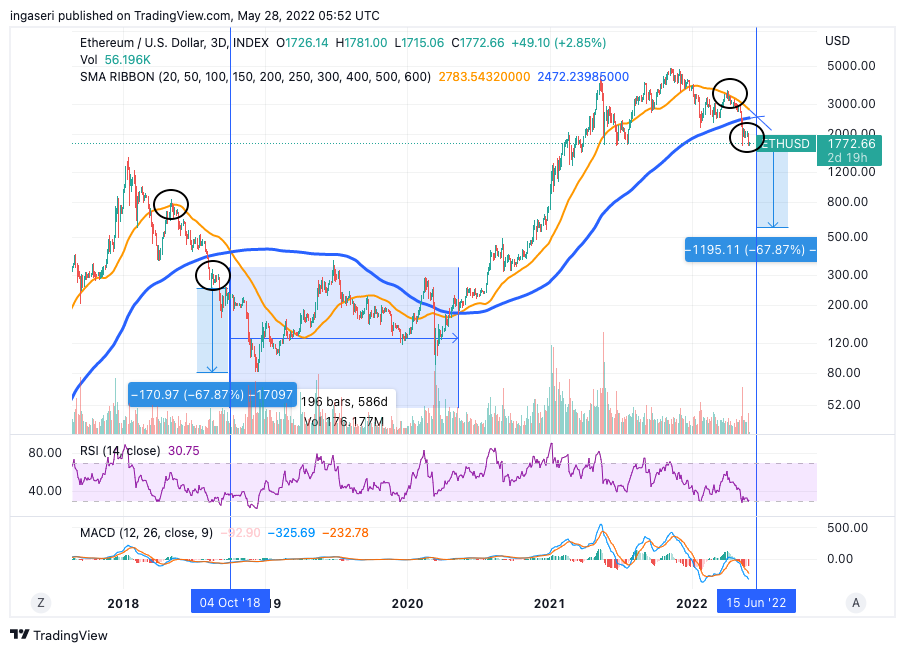
Death Cross on Ethereum: Take a look at the 3-day price chart above. A death cross is likely to occur in mid-June. Previously, there was only 1 death cross in Ethereum history. The previous death cross made the price of ETH plunge by 68% from the incident. Moreover, it lasted about 600 days before a golden cross and the price rally. We can see from the chart above that ETH hit the 50-day MA resistance level in May 2018 before forming a death cross. Notice the same pattern this time. We’re currently in fractal mode (last circle on the right), similar to the 2018 fractal before the 68% plunge.

BTC’s dominance fell from its low resistance zone in the past week. However, BTC.D has increased 13% over the last 3 weeks. There is a strong point of resistance at 47%, which coincides with the 0.235 Fibonacci Retracement line.

ETH/BTC also fell from the support point, dropping 9% for the week. There is strong support at the 0.236 Fibonacci support line, which is the current price. If this support point fails to hold the price, the price of ETH could drop further, with the market lowering ETH for a lower beta BTC.
On-Chain Analysis
Reserves of all exchanges remain at their lowest level in more than 3 years. There is an increasing trend in spot buying, including Coinbase, but reserves have remained low for 3 years. Meanwhile, the Derivatives Exchange reserves remained at the same level. There has been a slight increase in fund holdings driven by Purpose ETFs.
Whales are still reluctant to sell. The amount of BTC transferred to the Derivative Exchange is still high. Small distribution of miners.
Positive market sentiment is now stronger along with Futures investors. Open interest is still rising and the estimated leverage ratio is near its previous all-time high.
Both short-term and long-term holders sell at a loss. The MVRV and NUPL indicators signal that the Bitcoin price is currently approaching an undervalued position. The NVT Golden Cross indicator indicates that the Bitcoin price is still overvalued.

The chart above indicates the realized price of BTC; the aggregate cost basis of all on-chain entities. Currently, the figure is around $24,000 US dollars. Historically whenever the market price fell below the realized price it was a good buying opportunity. This is because by definition the market as a whole is underwater. It also corresponds to the 200-week moving average which is currently at 22k.
Analysis Summary
- 📉 Over the past week, Bitcoin has been moving sideways. However, if it closes the week below the 30,300 US dollar mark, this will be the first time Bitcoin has had 9 consecutive red candlesticks. In addition, there is a bear flag pattern that fell to the support point of 28k-30k (at the time of writing). If we take the equivalent downside pattern from its high and place it at the end of the descending bear flag pattern, the price of BTC that should be “bottoming” is at 12k US dollars (though this is an extreme case).
- 🆘 Based on Bitcoin data for 2013, 2017, and 2019, the decline after the death cross is usually equivalent to the decline before the death cross. A drop of -43% means that BTC will reach 23k US dollars, which corresponds to the 200-week MA line and the 55-month EMA. This is an important support point based on Bitcoin’s historical support line at its lower price range.
- ⚠ support points for ETH are at $1500 and $1700 US dollars. We see ETH holding firm at the $1700 support which is the Fibonacci retracement point. This figure is also a converging point with the descending support line drawn at the top in Nov 2021. Furthermore, Ethereum will also experience a death cross in mid-June. The previous death cross made the price of ETH plunge by 68% from the incident.
- ⚖️ Reserves of all exchanges remain at their lowest level in over 3 years. Both short-term and long-term holders sell at a loss. The MVRV and NUPL indicators signal that the Bitcoin price is currently approaching an undervalued position. In addition, Bitcoin is approaching its realized price at around $24,000 US dollars.
News From the Altcoins World
- ⛔ STEPN blocks users from China: STEPN, a move-to-earn crypto app that lets users earn crypto assets while exercising, issued a statement banning users from China. STEPN’s official Twitter explained that they have never supported the use of STEPN in China and will block active STEPN users in China. Both STEPN tokens, GMT and GST, saw more than 10% declines on the same day. The statement made by STEPN is reasonable considering China prohibits all cryptocurrency transactions.
Other Important News From The Crypto World
- 🌕 Launch of LUNA 2.0: On May 28, 2022, the new Terra network was officially launched through the creation of the new LUNA token. Do Kwon and various elements of the Terra community agreed to a proposal for Terra’s rebirth through a fork that would separate the new LUNA from the old LUNA (now called LUNA Classic or LUNC). However, LUNA’s price dropped by more than 50% just hours after its launch. LUNA briefly touched the $19 dollar mark but is currently moving around the US$5.89 price (30 May 2022).
- 🌊 OpenSea launches a new protocol: OpenSea, one of the largest NFT marketplaces in the crypto world, has just launched a new protocol called Seaport. Seaport is a protocol for a new marketplace that will allow users to trade NFT. So, now you can exchange NFTs with other users instead of just selling them.
References
- Alys Key, Stepn ‘Move-to-Earn’ Cryptocurrencies Plummet After App Says It Will Block Users in China, Decrypt, accessed on 29 May 2022.
- Sujith Somraaj, LUNA Reboot Plummets Over 70% Just Hours After Debut, Decrypt, accessed on 29 May 2022.
- Jeff John Roberts, Ethereum’s Merge is Coming and the Stakes Couldn’t Be Higher, Decrypt, accessed on 29 May 2022.
- Owen Fernau, OpenSea Drops New Marketplace Protocol for NFTs, The Defiant, accessed on 30 May 2022.