
The recent launch of Ethereum Exchange-Traded Funds (ETFs) on July 23 has infused a new optimism into the cryptocurrency market. Generating over $1 billion in trading volume on their first day, these ETFs mark a significant milestone for the industry, offering a potential lifeline for investors amid Bitcoin’s price stagnation.
As usual, the Pintu trading team has gathered critical information and analyzed the general economic situation and the crypto market’s movements over the past week. However, it should be noted that all information in this Market Analysis is intended for educational purposes, not as financial advice.
Market Analysis Summary
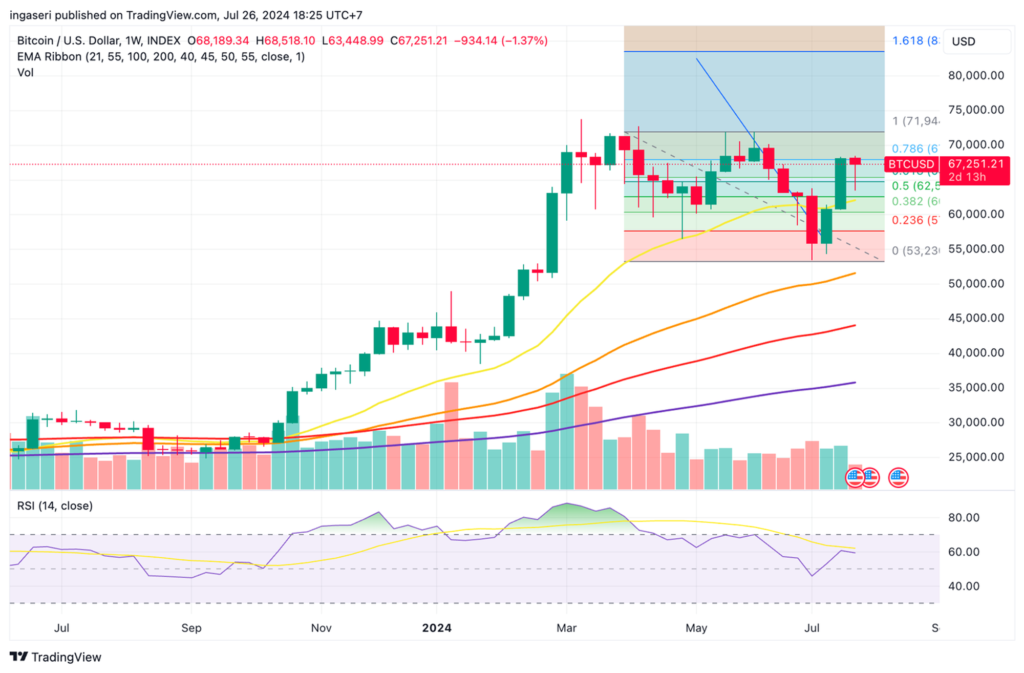
- ✍🏻 Bitcoin is currently facing the 0.786 Fibonacci retracement level. A decisive close above this crucial resistance on Monday could reignite the bullish sentiment.
- 🏠 Home sales fell by 5.4% last month to a seasonally adjusted annual rate of 3.89 million units, the lowest level since December.
- 🏬 The goods trade deficit narrowed by 2.5% in June.
- 🏠 The housing market has been the most adversely affected by the U.S. central bank’s aggressive monetary policy tightening. However, economists believe residential investment likely contracted in the April-June quarter.
Macroeconomic Analysis
Home Sales
U.S. existing home sales dropped more sharply than anticipated in June, reaching a new record high for the median house price. Home sales fell by 5.4% last month to a seasonally adjusted annual rate of 3.89 million units, the lowest level since December. Economists had predicted that home resales would decline to a rate of 4.00 million units.
Record-high home prices and elevated mortgage rates negatively impacted existing home sales in June. However, the recent decline in mortgage rates, which we expect to accelerate as the Fed begins cutting interest rates, should support a modest recovery in home sales later this year.”
The median existing home price surged 4.1% from a year ago, reaching a record high of $426,900. Although home prices hit a record high for the second consecutive month, the rate of increase has slowed, with supply nearing a four-year peak.
Existing home sales are recorded upon contract closing, so June’s figures likely reflect contracts signed in the preceding two months when the average rate for the popular 30-year fixed-rate mortgage exceeded 7.0%. Last week, the average rate for a 30-year fixed-rate mortgage fell to a four-month low of 6.77%, down from 6.89% the previous week and matching the average rate from the same period in 2023, according to data from mortgage finance agency Freddie Mac.
This decline follows a six-month high of 7.22% in early May, driven by optimism that the Fed will implement a long-awaited interest rate cut in September. The housing market has been severely impacted by the U.S. central bank’s aggressive monetary policy tightening aimed at controlling inflation.
Meanwhile, stocks on Wall Street were trading higher, the dollar gained against a basket of currencies, and U.S. Treasury yields decreased.
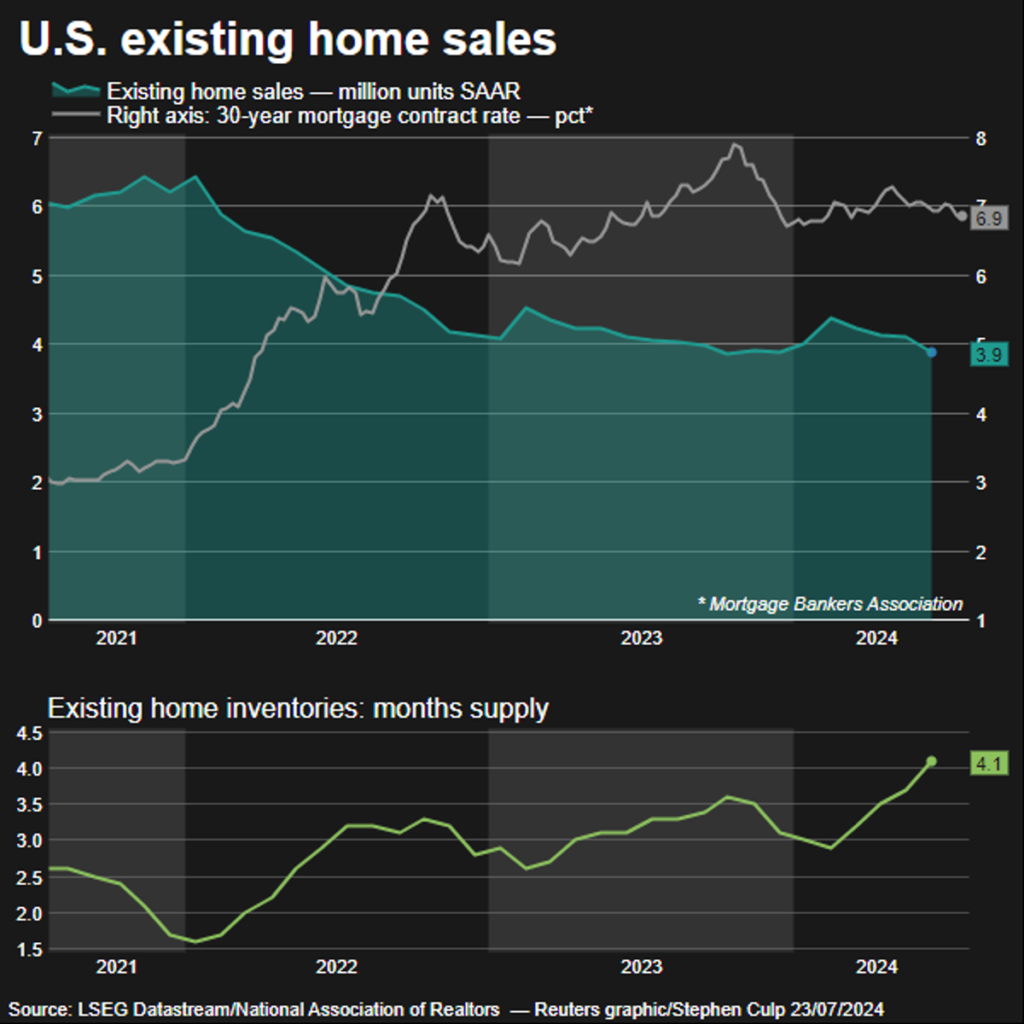
Housing inventory rose by 3.1% last month to 1.32 million units, the highest level since October 2020, and a 23.4% increase from a year ago. Despite this, entry-level homes remain scarce, and new construction is insufficient to meet demand. The government reported last week that single-family homebuilding dropped to an eight-month low in June, and permits for future construction hit their lowest point in a year. Many homeowners continue to hold mortgage rates below 5%.
A decline in home sales can signal a slowing economy, this also indicate that consumers are less willing or able to make significant purchases, often due to economic uncertainty or rising costs. A decline in sales can lead to reduced construction activity, affecting jobs and businesses related to construction materials and services. This also lead to reduced demand in sectors such as home furnishings, appliances, and financial services (like mortgages).
Other Economic Indicators
- Goods Trade Balance: The US trade deficit in goods narrowed for the first time in 2024, June being the first month to see a decrease. It fell by 2.5% to $96.8 billion, driven by a 2.5% increase in exports to $172.3 billion and a surge in food and goods shipments. Despite the improvement, challenges such as slow global demand and a strong dollar continue to affect exports. Even this improvement may still not be enough to avoid the negative impact of trade on economic growth in the second quarter.
- New Home Sales: The housing market has been the most adversely affected by the U.S. central bank’s aggressive monetary policy tightening. After emerging from its slump, residential investment, which encompasses home building and sales, experienced double-digit growth in the first quarter. However, economists believe residential investment likely contracted in the April-June quarter.
- S&P Manufacturing PMI: S&P Global released a report revealing a significant drop in the US Manufacturing Purchasing Managers’ Index (PMI) for July, reaching its lowest point in seven months. The PMI, which measures the activity level among purchasing managers in the manufacturing sector, fell by 2.1 points to 49.5 in July, down from 51.6 in June. This decline is notable because the expected reading was 51.7, and it dipped below the crucial 50-mark, indicating a contraction in the sector.
BTC Price Analysis
BTC broke down below its key support level to 63K and surged approximately 4.2% in the last 24 hours, trading above $67,000 during the early Asian session on Friday. This rebound indicates potential continued bullish momentum. Examining the weekly chart, BTC is currently encountering resistance at the 0.786 Fibonacci retracement level. Closing above this level on Monday would restore BTC’s positive momentum.
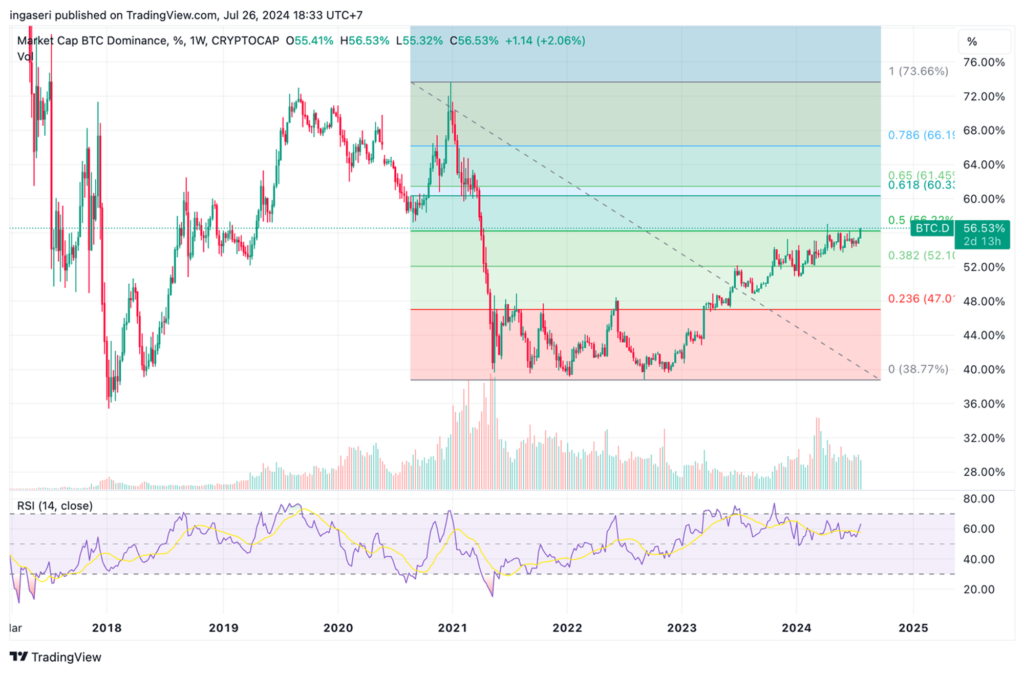
Bitcoin dominance hit a new peak of approximately 56.67% on Friday, marking its highest level since mid-April. This increase is partly attributed to the underwhelming performance of recently approved spot Ether ETFs in the U.S., which has bolstered confidence in Bitcoin.
The ETH/BTC weekly chart dropped below a critical support level around 0.51, signaling a shift in market dynamics.
Bitcoin price rose following Former US President Donald Trump’s speech at the Bitcoin Conference 2024 event, reaching a 16-month high of $68,000.
On-Chain Analysis
- 📊 Exchange: As the exchange reserve continues to rise, it indicates higher selling pressure. Net deposits on exchanges are low compared to the 7-day average. Lower deposits can be interpreted as lower selling pressure.
- 💻 Miners: Miners’ are selling holdings in a moderate range compared to its one-year average. Miner’s revenue is in a moderate range, compared to its one-year average.
- 🔗 On-Chain: More investors are selling at a profit. In the middle of a bull market, it can indicate a market top. Long term holders’ movement in the last 7 days was lower than the average. They have a motive to hold their coins. Investors are in a belief ****phase where they are currently in a state of high unrealized profits.
- 🏦 Derivatives: Long-position traders are dominant and are willing to pay to short traders. Buying sentiment is dominant in the derivatives market. More buy orders are filled by takers. As OI increases, it indicates more liquidity, volatility, and attention are coming into the derivative market. The increasing trend in OI could support the current ongoing price trend.
- 🔀 Technicals: RSI indicates a overbought condition where 77.00% of price movement in the last 2 weeks have been up and a trend reversal can occur. Stochastic indicates a overbought condition where the current price is close to its high in the last 2 weeks and a trend reversal can occur.
News About Altcoins
- Obama’s Endorsement of Kamala Harris Drives Up Meme Tokens. Former President Barack Obama and former First Lady Michelle Obama have endorsed Kamala Harris’s candidacy for president, succeeding Joe Biden. This endorsement was positively received by tokens related to Kamala Harris. Specifically, Kamala Horris (KAMA) jumped 26.7% on CoinGecko. Tokens related to political figures are becoming increasingly popular in the crypto market. Recently, an incident involving Donald Trump helped push MAGA up by 58% and STRUMP up by 51.2%. It seems this phenomenon will continue throughout the US election period.
News from the Crypto World in the Past Week
- Trump Promises Bold Bitcoin Initiatives in 2024 Campaign speech. In a fiery speech at the Bitcoin Conference, Donald Trump outlined his bold plans for bitcoin and cryptocurrency if elected in 2024. He vowed to fire SEC Chairman Gary Gensler on day one, create a strategic national bitcoin stockpile and ensure the US keeps all of its bitcoin holdings. Trump predicted that bitcoin would surpass the market capitalisation of gold and urged never to sell bitcoin, promising that it would “go to the moon”. He promised to commute Ross Ulbricht’s sentence, rejected a central bank digital currency (CBDC) and declared that the US would become the world’s crypto capital. Trump also criticised the current administration for threatening the dollar, and promised to end Biden and Harris’ “anti-crypto crusade” on his first day in office.
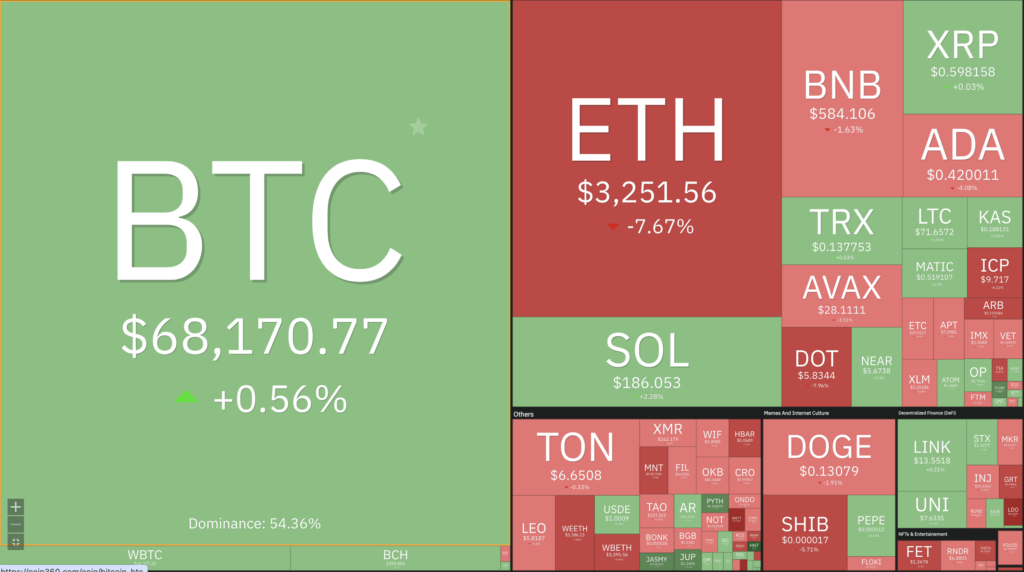
Cryptocurrencies Market Price Over the Past Week
Cryptocurrencies With the Best Performance
- Helium (HNT) +20,68%
- Jupiter (JUP) +9,63%
- Solana (SOL) +6,48%
- Pyth Network (PYTH) +6,31%
Cryptocurrencies With the Worst Performance
- Lido DAO (LDO) -16,91%
- Brett (BRETT) -16,89%
- Notcoin (NOT) -14,74%
- Popcat (POPCAT) -14,69%
References
- Watcher.guru, Donald Trump 2024 Bitcoin Conference Speech Recap, X, accessed on 28 July 2024.
- Florence Muchai, Barack Obama officially endorses Kamala Harris for president, Cryptopolitan, accessed on 27 July 2024.