
Last week, Bitcoin’s price underwent a significant decline, exhibiting fluctuations exceeding 10% within a single 24-hour period. This downturn was triggered by analyst reports suggesting that the SEC’s approval of a Bitcoin ETF is unlikely. The magnitude of the price drop in response to this news indicates that information about the potential BTC ETF was already heavily factored into the current Bitcoin price. Read the full analysis below.
As usual, the Pintu trading team has gathered critical information and analyzed the general economic situation and the crypto market’s movements over the past week. However, it should be noted that all information in this Market Analysis is intended for educational purposes, not as financial advice.
Market Analysis Summary
- 🏭 The S&P Global Manufacturing PMI fell from 49.40 in November to 47.9 points, indicating a continued decline in manufacturing conditions last month.
- 💼 The U.S. Department of Labor’s JOLTS report showed a decrease in job openings to 8.79 million, the lowest in more than two and a half years. The Federal Reserve is closely monitoring this trend, as the labor market is a key factor in the high inflation rates observed in mid-2022.
- 📈 In the week ending December 23, the number of U.S. citizens applying for unemployment insurance benefits increased by 202,000.
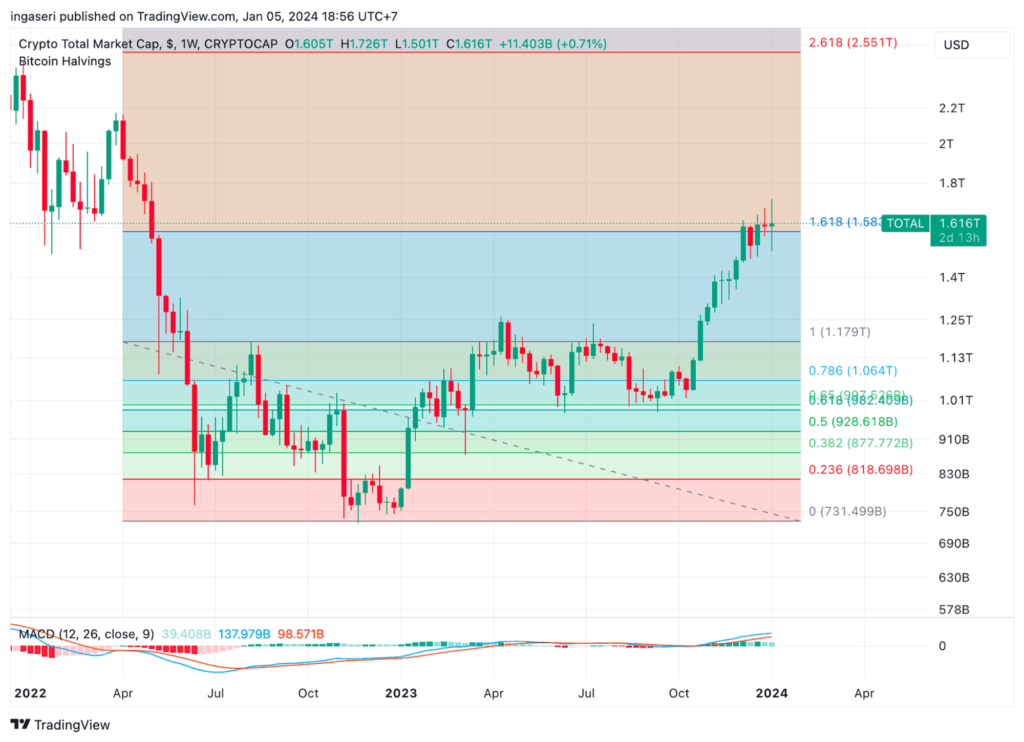
- ✍🏻 BTC prices briefly touched the 55-day Exponential Moving Average (EMA) support, then formed support along the 21-day EMA line. Overall, the crypto market remains above the Fibonacci 1.618 support line, establishing it as a support level.
Macroeconomic Analysis
S&P Global Manufacturing PMI
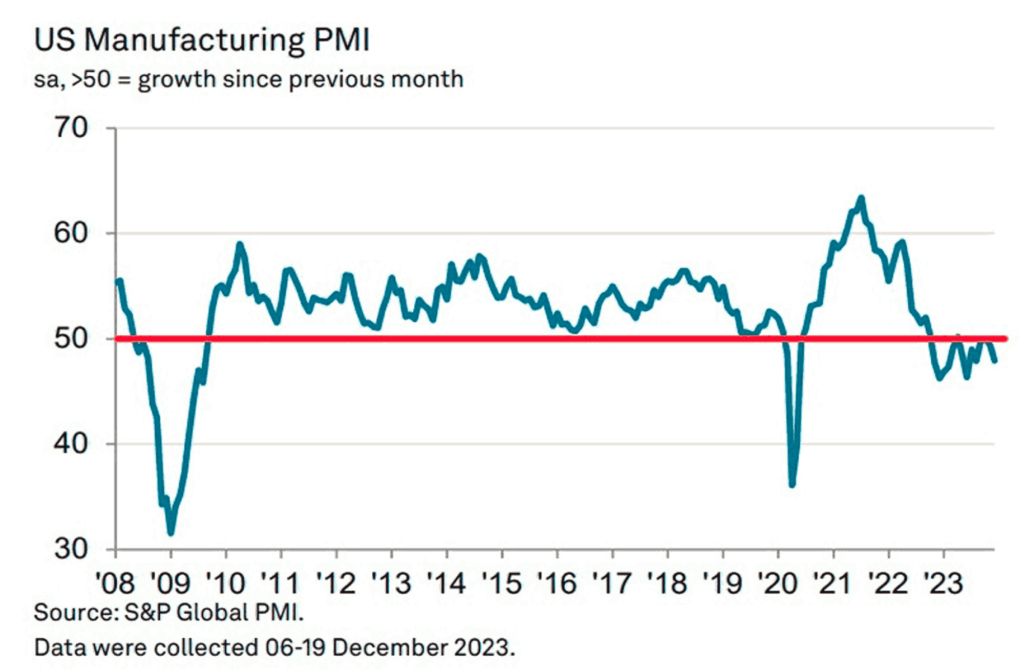
In December, the S&P Global Manufacturing PMI fell to 47.9 points from 49.40 in November, indicating that manufacturing conditions continued to deteriorate last month. In addition, output continued to fall and new orders accelerated their decline during the period while selling prices rose at the fastest pace since April. Weak customer demand led to the third consecutive monthly decline in employment. It’s worth noting that the Manufacturing PMI reached an all-time high of 63.4 in July 2021, while its lowest point was recorded at 36.1 in April 2020.
The S&P Global Services survey focuses on the U.S. services economy with a broader panel that includes small to large companies, uses more relevant questions for services sectors such as banking and legal services, and incorporates a weighting system for accurate economic representation. In contrast, the ISM survey covers a broader range of sectors, including government activities, is primarily geared toward larger companies, and focuses on purchasing and supply professionals without using a similar weighting system. In addition, S&P Global uses a different seasonal adjustment methodology and prefers the business activity index to a composite PMI headline.
Other Economic Indicators
- ISM Manufacturing PMI: The US manufacturing sector showed signs of stabilization in December, with the ISM Manufacturing PMI rising to 47.4 from 46.7 in the previous two months. Although this still indicates contraction (as the PMI has been below 50 for 14 consecutive months), it reflects a slight production and factory employment improvement. This is the longest period of contraction since August 2000 to January 2002. While economists were expecting an increase to 47.1, the actual reading exceeded expectations. The PMI indicates an overall economic contraction when it is consistently below 48.7, but the real data reveals a stronger picture of the manufacturing sector, which accounts for 10.3% of the economy. This strength is evidenced by a significant year-on-year increase in durable goods orders in November, suggesting healthy growth in the manufacturing sector despite ongoing production challenges.
- JOLTS Job Openings: In November, the U.S. Labor Department’s JOLTS report showed a decline in job openings to 8.79 million, the lowest level in more than two and a half years and slightly below the Dow Jones estimate of 8.8 million. The hiring rate also fell to 3.5%, while the quitting rate held steady at 1%, indicating a cooling labor market. The ratio of job openings to available workers fell to 1.4 to 1, moving toward a more balanced labor market post-Covid. The Federal Reserve is closely monitoring these trends, as the labor market has previously played a key role in the high inflation rates seen in the middle of the year. This shift in the labor market could lead to a gradual reduction in interest rates if the downward trend in inflation continues.
- ADP Employment Change: The ADP Research Institute reported that U.S. companies increased hiring in December, with private payrolls rising by 164,000, the most since August and exceeding most economists’ expectations. Growth was led by the service sector, particularly leisure and hospitality, education, and health care. Geographically, job gains were strong in the West and Northeast, while the South and Midwest saw declines. Along with job gains, wage growth continued to slow, with median wage increases of 5.4 percent for workers who stayed in their jobs and 8 percent for those who changed jobs. This combination of increased hiring and moderate wage growth is consistent with expectations for continued economic growth and declining inflation.
- Unemployment Claims: For the week ending December 23, the number of U.S. citizens filing for unemployment benefits increased by 202,000, the U.S. Department of Labor reported last Thursday. This figure was below market expectations and followed a 220,000 increase in the previous week. Additional details from the report showed that the seasonally adjusted insured unemployment rate rose to 1.2% and the four-week moving average was 207,750, a decrease of 4,750 from the previous week’s revised average. In addition, continuing claims decreased by 31,000 to 1.855 million for the week ending December 23.
BTC Price Analysis
The price of Bitcoin witnessed a substantial decline on Wednesday, exhibiting a fluctuation of over 10% within a 24-hour period. Although the cryptocurrency has not breached any significant support levels yet, it is crucial to examine the underlying factors driving this movement and its implications for the market.
The recent significant decline in Bitcoin is initiated by an analyst’s report indicating that the approval for the BTC ETF by the SEC is unlikely to occur.
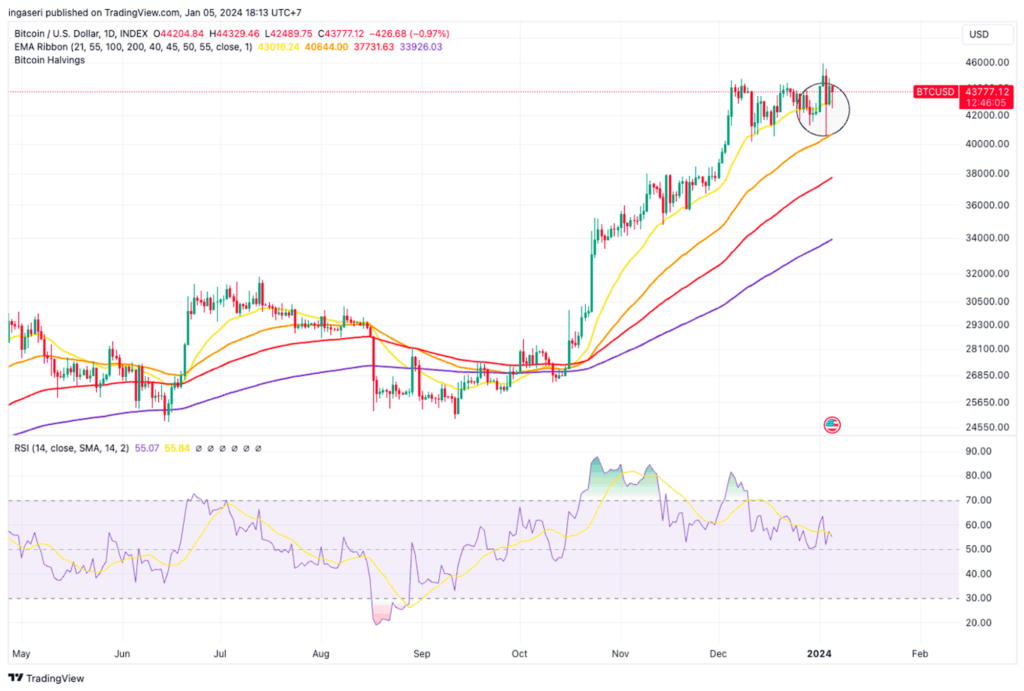
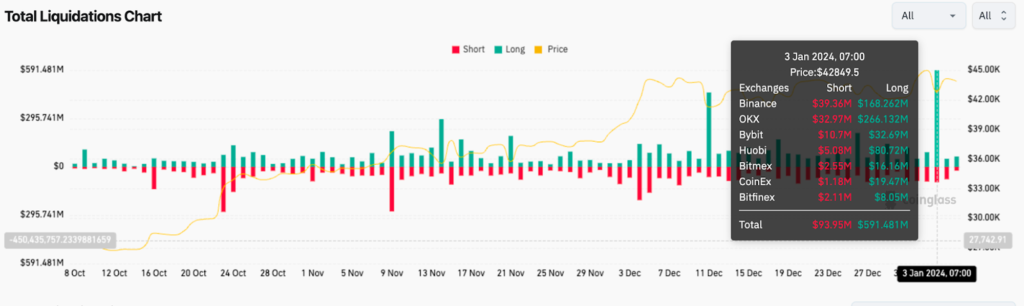
It briefly touches the 55-day EMA support before swiftly recovering within a day. Subsequently, it establishes support along the 21-day EMA line. Liquidations totaled around 700 million USD on Wednesday, primarily comprising long positions.
Observing the chart below and drawing patterns from the preceding two cycles, it appears probable that the price action will exhibit a sideways movement leading up to the halving. There is a potential for a market correction preceding the halving, as seen in the last cycle. Anticipate increased volatility as the approval news of the ETF approaches. It’s important to recognize that the substantial price drop when the news broke indicates that the information about the BTC ETF is already heavily factored into the current BTC price.
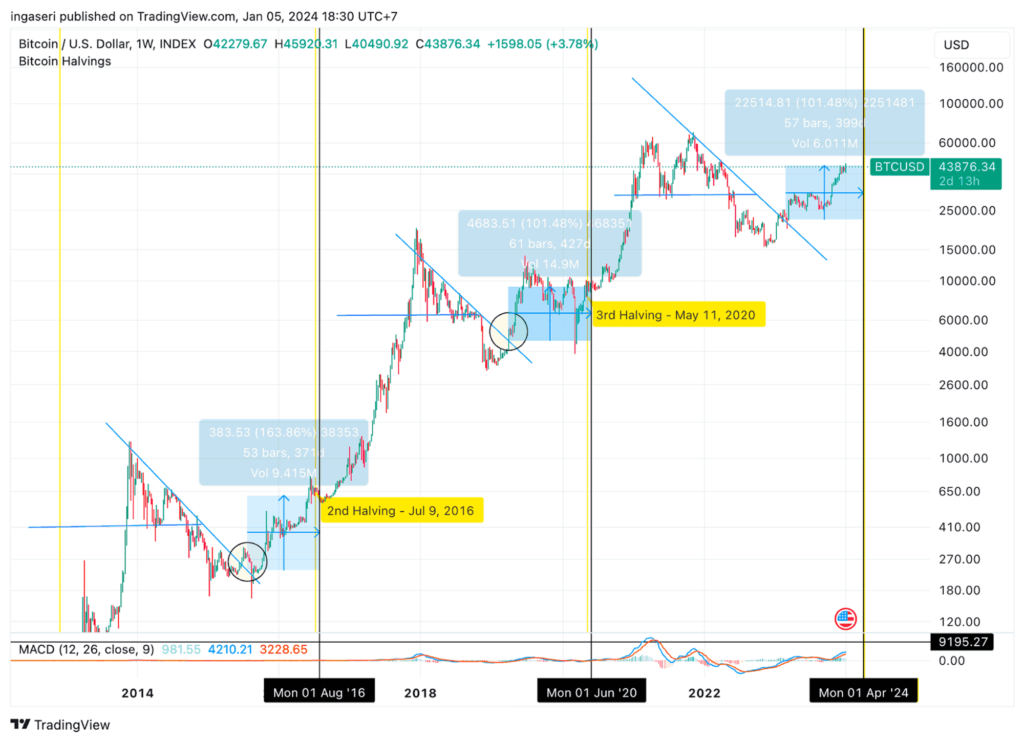
The overall crypto market remains above the 1.618 Fibonacci support, establishing it as a support line. This marks the second consecutive week that we have maintained a position above this support line.
On-Chain Analysis
- 📊 Exchange: As the exchange reserve continues to rise, it indicates higher selling pressure. Net deposits on exchanges are high compared to the 7-day average. Higher deposits can be interpreted as higher selling pressure.
- 💻 Miners: Miners’ are selling holdings in a moderate range compared to its one-year average. Miner’s revenue is in a moderate range, compared to its one-year average.
- 🔗 On-Chain: More investors are selling at a profit. It can indicate a market top in the middle of a bull market. Investors are in an anxiety phase where they are currently in a state of moderate unrealized profits.
- 🏦 Derivatives: Long-position traders are dominant and are willing to pay short traders. Selling sentiment is dominant in the derivatives market. More sell orders are filled by takers. As open interest decreases, it indicates investors are closing futures positions and the possibility of trend reversals. In turn, this might trigger the possibility of a long/short squeeze caused by sudden price movement or vice versa.
- 🔀 Technicals: RSI indicates a neutral condition. Stochastic indicates a neutral condition where the current price is in a moderate location between the highest-lowest range of the last 2 weeks.
News About Altcoins
- Celestia’s TIA Token Soars Over 22% in 24 Hours. The token reached nearly $17 in the early Asian trading hours on Friday, with a record trading volume of nearly $800 million, according to CoinGecko data. The appeal of TIA is partly due to its high annual staking yield of 15% to 17%, significantly higher than the U.S. risk-free interest rate. Additionally, TIA’s market capitalization is approaching $2 billion, with expectations of increased valuations in a bullish market. The Celestia blockchain, which launched its mainnet beta in October, is garnering attention for its innovative modular design and Data Availability Sampling (DAS) technology. This advancement promises enhanced scalability and security, marking what the Celestia Foundation terms as the beginning of a “modular era” in blockchain technology. Moreover, the recent airdrop of DYM tokens from the Dymension protocol to TIA stakers has added to the token’s allure, indicating significant potential gains from future airdrops.
News from the Crypto World in the Past Week
- The U.S. Securities and Exchange Commission (SEC) has implicitly recognized Ether (ETH) as a commodity. During a CryptoQuant webinar on January 4, Seyffart indicated that the SEC’s non-opposition to Ether’s classification during ETF registration with the Commodity Futures Trading Commission (CFTC) suggests a potential for an Ether spot ETF in 2024. The first Ether futures ETFs, launched on October 2, 2023, by companies including ProShares, VanEck, and Bitwise, reinforce the SEC’s stance, as reclassifying Ether as a security could lead to legal challenges and conflicts with the CFTC. This development, following the SEC’s recent court loss regarding the Spikes Index classification, precedes a final decision deadline for Ether spot ETFs in May 2024. Seyffart also predicts the approval of Bitcoin ETFs and a significant influx of investment shortly.
Cryptocurrencies Market Price Over the Past Week
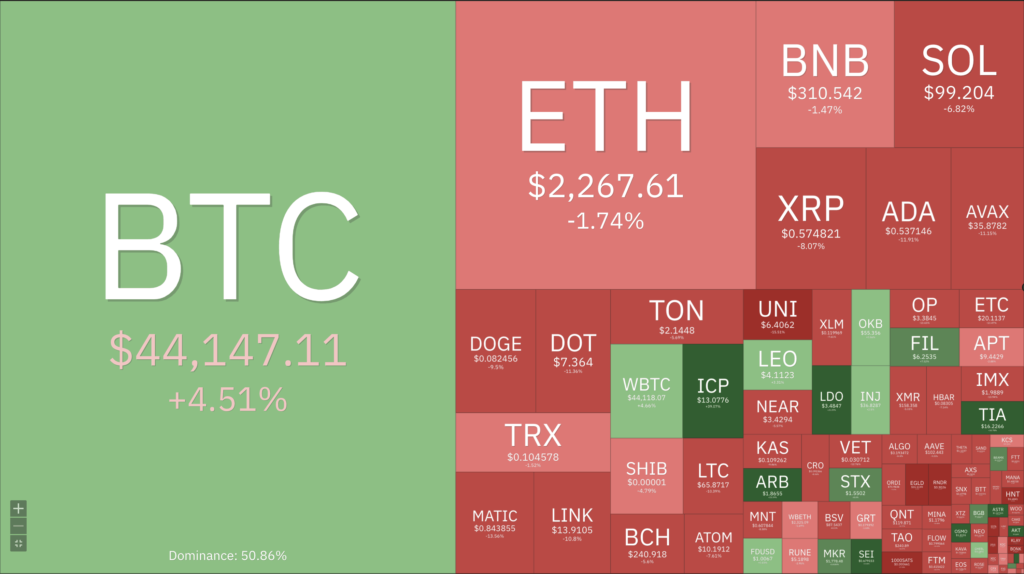
Cryptocurrencies With the Best Performance
- Celestia (TIA) +30,25%
- Arbitrum (ARB) +24,53%
- Sei (SEI) +23,79%
- Lido DAO (LDO) +17,06%
Cryptocurrencies With the Worst Performance
- Bonk (BONK) -27,32%
- MultiversX (EGLD) -22,11%
- Helium (HNT) -18,90%
- IOTA (IOTA) -18,66%
References
- Ana Paula Pereira, Ether ETF likely coming, as SEC ‘implicitly’ nodded ETH as commodity: Analyst, Cointelegraph, accessed on 6 January 2024.
- Shaurya Malwa, Celestia’s TIA Token Pops 22% as Staking, ‘Modular’ Narrative Gains Favor, Coindesk, accessed on 6 January 2024.