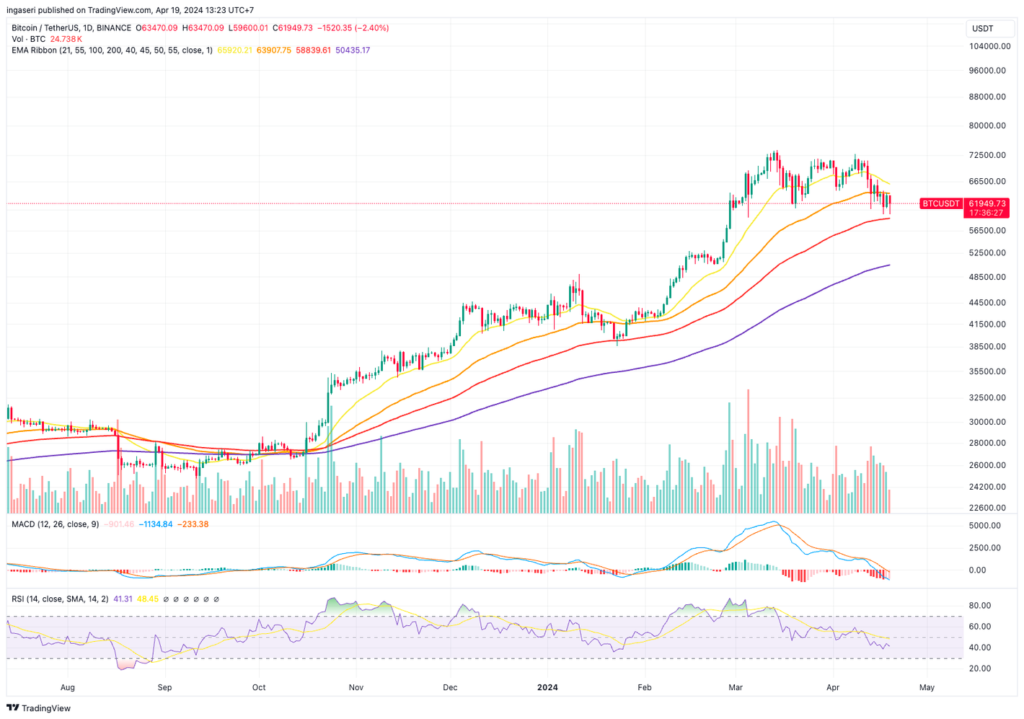
Last Friday, the much-anticipated Bitcoin halving finally took place. This marked the fourth halving for the Bitcoin network, reducing the block reward for miners from 6.25 Bitcoin to 3.125 Bitcoin. However, this event happened amidst an ongoing Middle Eastern conflict, which tempered the anticipated rise in Bitcoin’s price (BTC) towards its all-time high (ATH). Let’s explore the current macroeconomic following the halving and its potential impact on the cryptocurrency market.
As usual, the Pintu trading team has gathered critical information and analyzed the general economic situation and the crypto market’s movements over the past week. However, it should be noted that all information in this Market Analysis is intended for educational purposes, not as financial advice.
Market Analysis Summary
- ↔️ The fourth Bitcoin halving has been completed, with the price of BTC still hovering above $60,000.
- 📊 Consumer sentiment has remained stagnant for four consecutive months.
- 📈 Retail sales in the United States (US) in March rose 0.7%, exceeding expectations of 0.3%.
- ⏰ Strong economic activity has led to a shift in expectations for the Federal Reserve’s interest rate cut. Initially expected in June, it is now anticipated in September.
Macroeconomic Analysis
Michigan Consumer Sentiment

In April, consumer sentiment remained unchanged for the fourth consecutive month, as indicated by the preliminary Michigan Consumer Sentiment Index report. The index experienced a slight decline of 1.5 points (-1.9%) from its March final, settling at 77.9. This figure fell below the predicted value of 79.0.
For the fourth consecutive month, consumer sentiment remained stagnant, with few notable shifts perceived in the economy. Since January, sentiment has maintained remarkable consistency, fluctuating within a narrow range of just 2.5 index points, far below the 5-point threshold required for statistically significant differences in readings. Consumers have observed minimal changes in economic conditions since the beginning of the year. Expectations regarding personal finances, business conditions, and labor markets have all remained stable over the past four months. However, a slight increase in inflation expectations in April suggests some concerns that the slowdown in inflation may have halted. Overall, consumers are withholding judgment on the economy, particularly in anticipation of the upcoming election, which many believe could significantly influence its trajectory.
Other Economic Indicators
- Retail Sales: The US Commerce Department reported a 0.7% increase in retail sales for March, exceeding analyst expectations of 0.3%. This, coupled with a 4.0% annualized sales growth, prompted an upward revision of first-quarter GDP growth to 3.1%, up from the previous estimate of 2.5%. The continued strength of economic activity has also impacted expectations for the Federal Reserve’s interest rate decision. Previously anticipated for June, a potential rate cut is now projected for September. The Fed has maintained its policy rate between 5.25% and 5.50% since July but has raised the benchmark rate by 525 basis points since March 2022. As a result, most economists now expect only two rate cuts, down from the previously anticipated three.
- Core Retail Sales: Excluding autos, fuel, building materials, and food services, US core retail sales surged 1.1% in March, marking the strongest gain since January 2023. This increase has influenced estimates of consumer spending, a vital component of GDP. Consumption growth in the first quarter is now projected to reach 3.3%, matching the level of the previous quarter. Additionally, business inventories rose 0.4% in February. As stimulus programs wind down and consumer income depends more on wages, the robust economic expansion is expected to persist, highlighting the labor market’s resilience.
- New York Empire State Manufacturing Index: The Empire State Manufacturing Index improved in April 2024, rising to -14.3 from -20.9 in March. However, this increase fell short of market expectations of -9.0, signaling a sustained contraction in the New York manufacturing sector for the fifth consecutive month. The report also showed significant declines in new orders and shipments, as well as a drop in unfilled orders, suggesting weak demand conditions. Meanwhile, employment levels and hours worked were also seen declining, indicating pressure in the labor market. While input cost inflation accelerated slightly, selling price inflation remained stable, adding complexity to the challenges faced by manufacturers.
- Building Permits: In March, the seasonally adjusted annual rate of privately-owned housing units authorized by building permits stood at 1,458,000, marking a decrease of 4.3 percent from the revised February rate of 1,523,000. However, it was 1.5 percent higher than the rate recorded in March 2023, which stood at 1,437,000. Specifically, single-family authorizations in March were recorded at a rate of 973,000, reflecting a decline of 5.7 percent from the revised February figure of 1,032,000. Meanwhile, authorizations for units in buildings with five units or more reached a rate of 433,000 in March.
- Initial Jobless Claims: The US Department of Labor reported a strong labor market, with initial jobless claims holding steady at a low 212,000 for the week ending April 13th. Unadjusted claims even dipped to 208,509, defying initial expectations of 215,000. Concerns about inflation are leading financial markets and some economists to expect the Federal Reserve to delay cutting interest rates until September, especially after Fed Chair Jerome Powell emphasized the need for continued tight monetary policy. The continuous claims data also showed a small increase, from 1.810 million to 1.812 million in the week ending April 6th, suggesting it may take longer for some unemployed individuals to find new jobs.
- Existing Home Sales: Another report from the National Association of Realtors indicated a 4.3% decrease in existing home sales in March, with a seasonally adjusted annual rate of 4.19 million units. Home resales, which constitute a significant portion of U.S. housing transactions, experienced a 3.7% decline compared to March of the previous year.
BTC Price Analysis
Bitcoin (BTC) experienced a slight price increase on Friday, bouncing back from an earlier dip below crucial support levels. This came as reports of an Israeli strike against Iran weighed on risk sentiment, while attention remained fixed on the upcoming halving event.
Over the past 24 hours, BTC saw an almost 1% rise. However, it had dropped as low as $59,693 when news of the Israeli strike emerged on Friday morning. This slip below the $60,000 mark, considered a significant support level, suggested that risk appetite, particularly towards crypto markets, remained delicate. This sentiment was further illustrated by traders shifting towards safer assets immediately following the Israeli strikes.
Various media reports linked explosions observed across Iran earlier on Friday to drone attacks attributed to Israel. Although major nuclear facilities in Iran seemed unaffected by the strikes, the incident hinted at a potential escalation in regional tensions, raising concerns about a broader conflict in the Middle East. However, BTC managed to recover as the $60,000 support level seemed to hold, at least temporarily.
Attention now turned to the imminent halving event, anticipated to occur with the generation of block no. 840,000 on the BTC blockchain, likely happening last Friday. The halving will halve the reward for mining BTC and is expected to slow down the rate of new BTC creation. This event is tied to the belief that a diminishing supply of BTC will drive up its value, although historical halvings have yielded limited short-term gains. On April 22, 2024, two days after the halving, the price of Bitcoin (BTC) reached $65,900. However, at the time of writing, Bitcoin’s price remains volatile, hovering around the $65,000-$66,000 range.

On-Chain Analysis
- 📊 Exchange: As the exchange reserve continues to fall, it indicates lower selling pressure. Net deposits on exchanges are high compared to the 7-day average. Higher deposits can be interpreted as higher selling pressure.
- 💻 Miners: Miners’ are selling holdings in a moderate range compared to its one-year average. Miner’s revenue is in a moderate range, compared to its one-year average.
- 🔗 On-Chain: More investors are selling at a profit. In the middle of a bull market, it can indicate a market top. Long term holders’ movement in the last 7days were lower than the average. They have a motive to hold their coins. Investors are in a belief phase where they are currently in a state of high unrealized profits.
- 🏦 Derivatives: Short position traders are dominant and are willing to pay long traders. Buying sentiment is dominant in the derivatives market. More buy orders are filled by takers. As open interest decreases, it indicates investors are closing futures positions and possibility of trend reversals. In turn, this might trigger the possibility of long/short-squeeze caused by sudden price movement or vice versa.
- 🔀 Technicals: RSI indicates a neutral condition. Stochastic indicates a neutral condition where the current price is in a moderate location between the highest-lowest range of the last 2 weeks.
News About Altcoins
- Memecoin Boom Sparks Speculation Amid Regulatory Concerns. The memecoin sector has boomed in 2024, with returns exceeding 1,300% and market capitalization surpassing $50 billion, sparking speculation of a continued surge amidst regulatory concerns. Despite this growth, questions linger about long-term utility and potential regulatory challenges. Huge gains, like turning $13,000 into $2 million in an hour, highlight the volatility and speculative nature of memecoins. Experts like Shytoshi Kusama of Shiba Inu believe memecoins offer utility and the potential to attract new users to the crypto world. However, Indrajeet Roy of TradeX warns that without stronger fundamentals or use cases, their success may be short-lived. As the sector gains traction, regulatory scrutiny and the need for responsible innovation are also increasing. This suggests that while the current surge is considerable, its sustainability remains uncertain.
News from the Crypto World in the Past Week
- Hong Kong Bitcoin ETF Inflows: Optimism Meets Caution. Following the greenlight for the first spot Bitcoin and Ethereum ETFs in Hong Kong, expectations are high for significant capital inflows. Analyst Eric Balchunas of Bloomberg initially projected $25 billion from Matrixport, but expressed some skepticism. Several factors temper his optimism: the limited size of Hong Kong’s $50 billion ETF market, restrictions on Chinese investment, the involvement of smaller issuers compared to giants like Blackrock, and potential market inefficiencies leading to wider spreads and discounts. Additionally, fees for these ETFs are expected to be significantly higher (1-2%) compared to the US market, further dampening their initial impact. Despite these concerns, Balchunas acknowledges the long-term benefit of these ETFs in expanding Bitcoin investment avenues. He remains cautiously optimistic, recognizing a potentially smaller immediate impact than initially projected.
Cryptocurrencies Market Price Over the Past Week

Cryptocurrencies With the Best Performance
- SingularityNET (AGIX) +35.00%
- Sui (SUI) +34.14%
- Arweave (AR) +30.43%
- Beam (BEAM) +29.16%
Cryptocurrencies With the Worst Performance
- Starknet (STRK) -5.50%
- Ethena (ENA) -1.95%
- Kaspa (KAS) -0.03%
References
- Shiraz Jagati, Memecoin sector’s continued growth hinges on long-term utility, Cointelegraph, accessed on 20 April 2024.
- Jamie Redman, ETF Analyst Offers Sober Outlook on Newly Approved Hong Kong Bitcoin ETFs; Challenges $25B Inflow Estimate, Bitcoin, accessed on 20 April 2024.
