
The crypto market continues its upward trend, highlighted by Bitcoin’s (BTC) price reaching approximately $95,000 after many were pessimistic and predicted a drop to $60,000. However, BTC remains resilient despite macroeconomic factors and the ongoing trade war. Check out the full analysis from the Trader Pintu team.
Market Analysis Summary
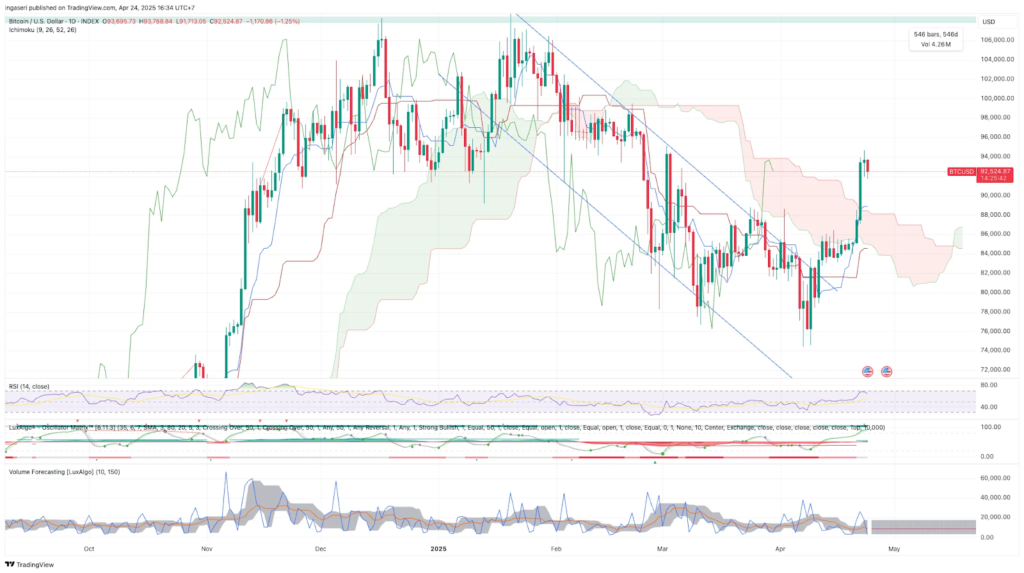
- 🟢 BTC’s price action was reinforced by strong buying pressure, as indicated by a sharp spike in the ADX indicator and the formation of bullish patterns on the Ichimoku Cloud. The alignment of key moving averages (EMAs) also pointed to further upside potential.
- 💼 The latest U.S. jobless claims data for the week ending April 12, 2025, shows that initial jobless claims decreased by 9,000 to 215,000, down from a revised 224,000 in the previous week.
- 📈 Continuing jobless claims, which measure the number of people receiving ongoing unemployment benefits, increased by 41,000 to 1,885,000 for the week ending April 5, 2025.
- 🚧 March 2025’s housing data points to a cooling in new home construction after a volatile start to the year, with builders cautious amid economic uncertainties.
- 🏭 The latest S&P Global Purchasing Managers’ Index (PMI) results for April 2025 indicate a mixed but generally subdued outlook for both the manufacturing and services sectors in the United States and globally.
- 🏠 New home sales in the United States saw a robust increase in March 2025, signaling renewed momentum in the housing market as the spring selling season began.
Macroeconomic Analysis
Jobless Claims
The latest U.S. jobless claims data for the week ending April 12, 2025, shows that initial jobless claims decreased by 9,000 to 215,000, down from a revised 224,000 in the previous week. This decline was better than market expectations, which had forecasted an increase to 225,000. The drop to 215,000 marks the lowest number of new claims in over two months, indicating continued strength and tightness in the U.S. labor market. The four-week moving average of initial claims also fell by 2,500 to 220,750, reflecting a generally stable trend in new unemployment filings over the past month.
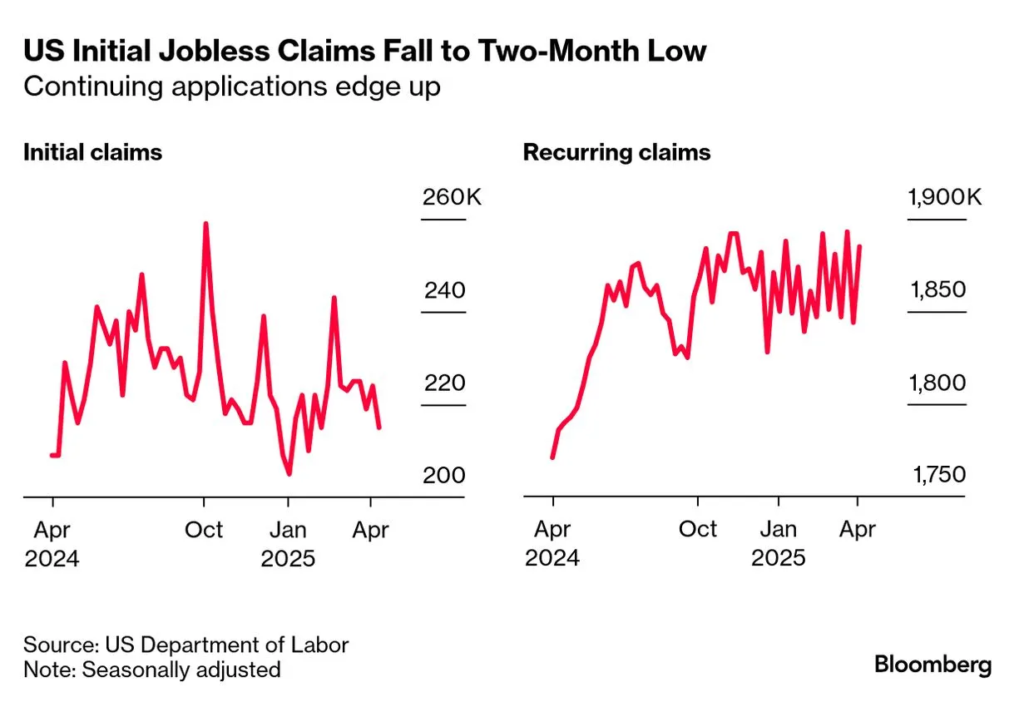
Despite the improvement in initial claims, continuing jobless claims, which measure the number of people receiving ongoing unemployment benefits, increased by 41,000 to 1,885,000 for the week ending April 5, 2025. This rise in continuing claims suggests some volatility and challenges remain for those unemployed in re-entering the workforce. The four-week moving average of continuing claims edged up slightly by 1,000 to 1,867,250, indicating that while new layoffs are low, the total pool of unemployed individuals claiming benefits remains elevated compared to historical lows.
The insured unemployment rate, which represents the percentage of the labor force receiving unemployment benefits, remained steady at 1.2 percent for the week ending April 5. This rate has been relatively stable, underscoring a labor market that is tight but not deteriorating significantly. Seasonal adjustments showed that unadjusted initial claims rose only modestly by 1.5 percent, much less than the expected 5.7 percent increase, with most states reporting stable or declining claims except for Kentucky and Missouri, which saw noticeable increases.
Federal government employee claims, which have been under scrutiny due to recent firings by the Department of Government Efficiency (DOGE), inched higher by 34 to 548 claims, marking one of the lowest levels since the Trump administration. However, many of those terminated reportedly received severance packages, which delay their eligibility for unemployment benefits, potentially muting the immediate impact on claims numbers from this group.
Overall, the latest jobless claims data reflect a labor market that remains historically tight with low initial claims, but with some persistent challenges as seen in the rising continuing claims. The data suggest that layoffs remain contained, but the pace of rehiring or finding new employment for the unemployed is somewhat uneven. Analysts expect initial claims to trend around 210,000 in 2026 and continuing claims to gradually rise over the next few years, reflecting ongoing structural shifts in the labor market.
Other Economic Indicators
- Housing Starts & Building Permits: The latest U.S. housing data for March 2025 shows a mixed picture between housing starts and building permits. Housing starts, which measure the number of new residential construction projects begun, fell sharply by 11.4% month-over-month to a seasonally adjusted annual rate (SAAR) of 1.324 million units. This decline was notably larger than expected and represents the lowest level in four months. The drop was primarily driven by a 14.2% decrease in single-family housing starts to 940,000 units, while multi-family starts (buildings with five or more units) remained steady at 371,000 units. Regionally, starts fell significantly in the West (-30.9%) and South (-17.1%) but rose strongly in the Midwest (+76.2%) and slightly in the Northeast (+1.4%).
- S&P Global Manufacturing and Services PMI: The latest S&P Global Purchasing Managers’ Index (PMI) results for April 2025 indicate a mixed but generally subdued outlook for both the manufacturing and services sectors in the United States and globally. While the global economy continued to expand, the pace of growth remained modest and below the levels seen in late 2024. The J.P. Morgan Global PMI Composite Output Index, produced by S&P Global, rose to 52.1 in March from 51.5 in February, signaling ongoing expansion but at a slower annualized rate of 2.3%, compared to 3.0% in the previous quarter1. This growth was primarily driven by improvements in the service sector, while manufacturing expansion decelerated as businesses adjusted to anticipated tariff changes.
- New Home Sales: New home sales in the United States saw a robust increase in March 2025, signaling renewed momentum in the housing market as the spring selling season began. According to the latest data from the U.S. Census Bureau and the Department of Housing and Urban Development, sales of newly built single-family homes rose to a seasonally adjusted annual rate of 724,000 units. This represents a 7.4% jump from February’s rate of 674,000 and a 6.0% increase compared to March 2024, significantly surpassing analysts’ expectations of approximately 680,000 units.
BTC Price Analysis
The past week marked a significant rebound for BTC and the broader cryptomarket, reversing the cautious sentiment that had dominated earlier in April. BTC surged past the $90,000 mark for the first time since early March, with its price climbing as high as $92,892 on April 23, 2025. This rally represented a gain of over 11% in just two sessions, with BTC up approximately 23% from its April lows. The move was fueled by a combination of technical bullish signals, renewed ETF inflows, and a shift in macroeconomic sentiment, as investors sought alternatives amid a weakening U.S. dollar and volatility in traditional equity markets.
Several macro and regulatory developments contributed to this bullish momentum. The appointment of a new SEC Chairman, Paul Atkins, and positive news regarding an upcoming U.S. stablecoin regulation bill boosted confidence in the sector. Additionally, the U.S. Treasury Secretary’s proposal to ease regulations on stablecoins spurred higher trading volumes in USDT and USDC, further supporting market liquidity. These regulatory tailwinds, combined with expectations that the Fed will maintain tighter policy for longer, have encouraged investors to view BTC as a hedge against inflation and policy uncertainty.
On the technical front, BTC’s price action was reinforced by strong buying pressure, as indicated by a sharp spike in the ADX indicator and the formation of bullish patterns on the Ichimoku Cloud. The alignment of key moving averages (EMAs) also pointed to further upside potential. ETF inflows into spot BTC products reached their highest level in three months, with $381.4 million flowing in on Monday alone, marking the fourth day of inflows in the last five trading sessions. This institutional participation has been critical in supporting BTC’s upward trajectory and signaling growing mainstream acceptance.
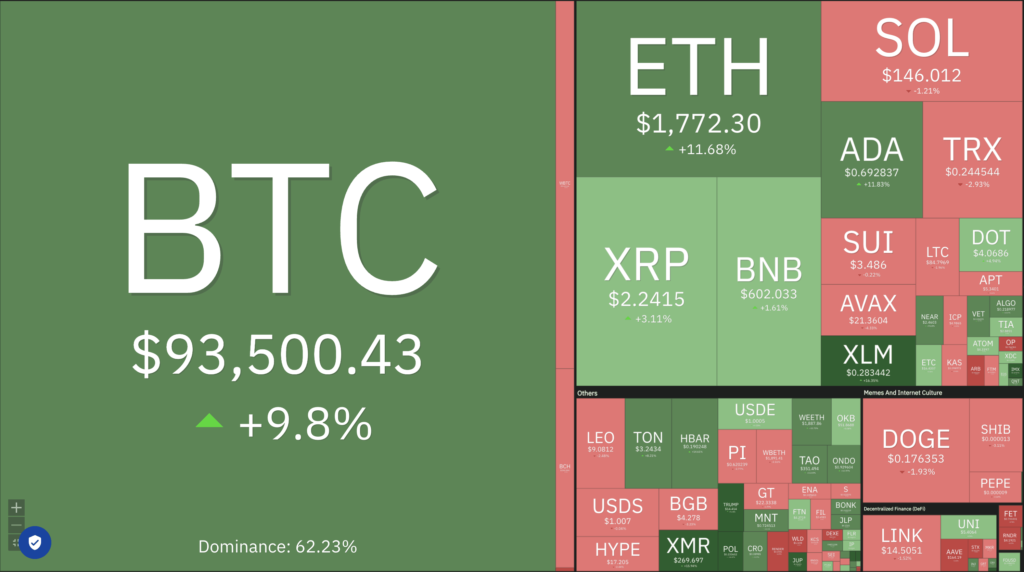
While BTC led the charge, the rest of the crypto market displayed mixed performance. The total crypto market cap rose by 1.21% over the week, with major altcoins like Solana and XRP posting strong gains of 10% and 4.2% respectively, while others such as Ethereum, ADA, and DOGE saw mild losses of less than 2%. Notably, some smaller-cap assets, such as Onyxcoin (XCN) and Fartcoin, experienced outsized rallies, with XCN soaring over 120% during the week. However, the broader altcoin market remained somewhat sluggish, reflecting a preference among investors for large-cap, more established cryptocurrencies during periods of macroeconomic uncertainty.
Despite the renewed optimism, market volatility remains elevated, with the BTC 1-month at-the-money volatility hovering around 65%. The Fear and Greed Index, while improving, still reflects lingering caution among investors. Funding markets show a tilt toward cautious long exposure rather than aggressive leveraged bets, indicating that while conviction in BTC’s role as a hedge is growing, uncertainty persists amid ongoing trade tensions and the evolving regulatory landscape. Overall, the past week has underscored BTC’s resilience and its increasing decoupling from traditional risk assets, positioning it as a favored alternative in an environment marked by inflationary pressures and geopolitical strife.
On-Chain Analysis
- 📊 Exchange: As the exchange reserve continues to fall, it indicates lower selling pressure. Net deposits on exchanges are high compared to the 7-day average. Higher deposits can be interpreted as higher selling pressure.
- 💻 Miners: Miners’ are selling holdings in a moderate range compared to its one-year average. Miner’s revenue is in a moderate range, compared to its one-year average.
- ⛓️ On-chain: More investors are selling at a profit. In the middle of a bull market, it can indicate a market top. Long term holders’ movement in the last 7 days was lower than the average. They have a motive to hold their coins. Investors are in a anxiety phase where they are currently in a state of moderate unrealized profits.
- 🏦 Derivative: Long position traders are dominant and are willing to pay to short traders. Selling sentiment is dominant in the derivatives market. More sell orders are filled by takers. As open interest increases, it indicates more liquidity, volatility, and attention are coming into the derivative market. The increasing trend in open interest could support the current ongoing price trend.
- 🔀 Technicals: RSI indicates a overbought condition where 79.00% of price movement in the last 2 weeks have been up and a trend reversal can occur. Stochastic indicates a neutral condition where the current price is in a moderate location between the highest-lowest range of the last 2 weeks.
News About Altcoins
- Solana Surpasses Ethereum, Base, and BNB in 24H DEX Volume, Reaches 35% Market Share. Solana has surpassed Ethereum, Base, and BNB Chain in decentralized exchange (DEX) trading volume over a 24-hour period, with its market dominance reaching 35%, the highest in two months. The blockchain also leads in weekly DEX trading volume, outpacing Ethereum and all its Layer 2 networks combined. Additionally, Solana has more active addresses and transactions than all other blockchains combined, with $10 billion in USDC recently moved to Solana.
News from the Crypto World in the Past Week
- SEC Commissioner Hester Peirce Calls for Clearer Crypto Regulations, Describes Current Environment as “Playing the Floor is Lava”. SEC Commissioner Hester Peirce likened the current regulatory environment for crypto to the children’s game “the floor is lava,” where financial firms must navigate unclear regulations without directly handling crypto assets. She emphasized the need for clearer rules to enable firms to engage with crypto confidently, particularly in areas like custody and staking. Peirce warned that without qualified custodians, a robust crypto market would struggle to develop. SEC Commissioner Mark Uyeda echoed her concerns, stressing the need for legal custodial options. Meanwhile, SEC Chair Paul Atkins called for clearer regulations to unlock the benefits of blockchain technology and mitigate uncertainty in the crypto space.
Cryptocurrencies Market Price Over the Past Week
Cryptocurrencies With the Best Performance
- Pudgy Penguins (PENGU) +143.96%
- Virutals Protocol (VIRTUAL) +79.25%
- Brett (BRETT) +71.06%
- Sui (SUI) +57.66%
Cryptocurrencies With the Worst Performance
- Render (RENDER) -6.70%
- PAX Gold (PAXG) -3.35%
- Uniswap (UNI) -0.54%
- TRON (TRX) -0.52%
References
- DeepNewz, Solana Surpasses Ethereum, Base, BNB in 24H DEX Volume, Reaches 35% Market Share—DeFiLlama, thedefiant, accessed on 27 April 2025.
- Ciaran Lyons, US crypto rules like ‘floor is lava’ game without lights — Hester Peirce, Cointelegraph, accessed on 27 April 2025.