
Over the past week, the movement of Bitcoin (BTC) has been lackluster, falling below the $29,000 price level. From July through the first week of August, BTC has struggled to maintain its support price at the $28,000 level. Will BTC continue to fall or will it manage to hold its support? Read the full analysis below.
The Pintu trading team has gathered critical information and analyzed the general economic situation and the crypto market’s movements over the past week. However, it should be noted that all information in this Market Analysis is intended for educational purposes, not as financial advice.
Market Analysis Summary
- 📈 The U.S. manufacturing sector, as confirmed by the manufacturing PMI, rose only slightly last month to 46.4. This is the longest period of contraction since the Great Recession of 2007-2009, although there’s potential for a rebound in the second quarter.
- 💪🏻 Despite a slight decline in total job openings to 9.582 million, the labor market remains stable with job openings increasing in many regions and industries.
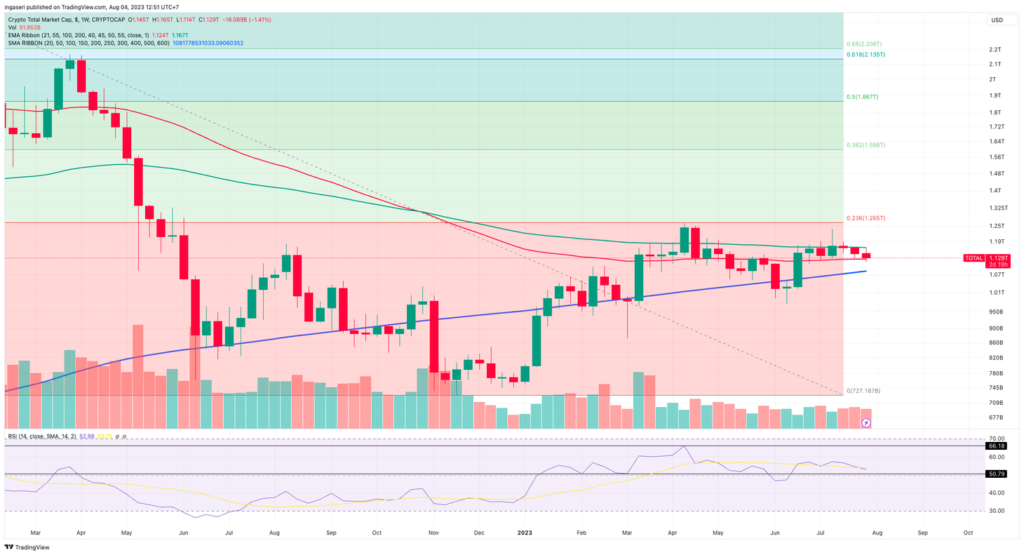
- ✍🏻 The overall crypto market capitalization is at the support level of the 55-week exponential moving average (EMA), while BTC experienced sideways movement with a drop below $29,000.
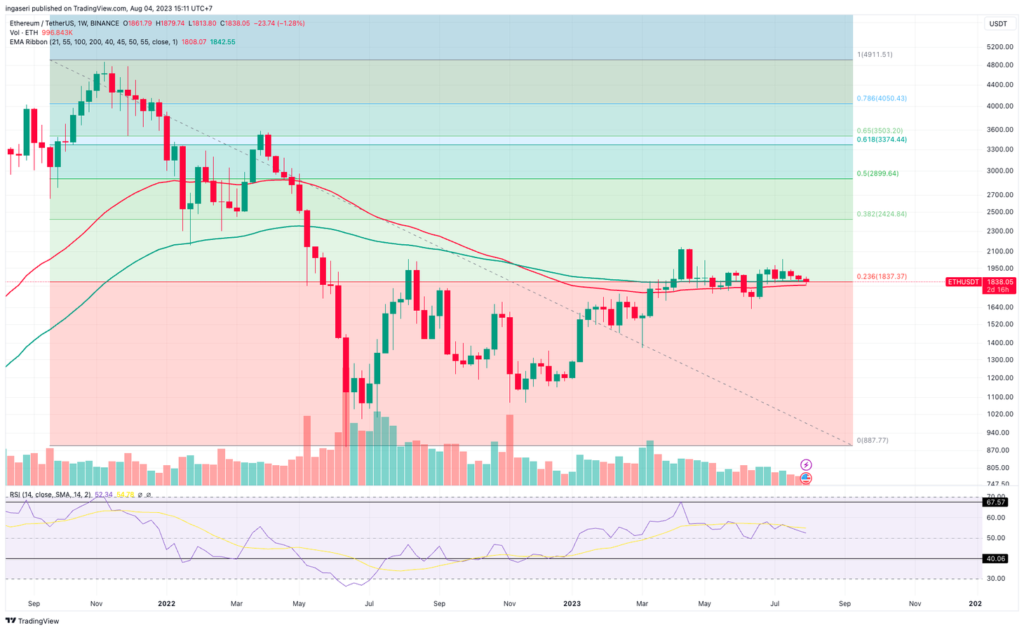
- 🔄 Despite the decline, the ETH remained resilient at the support line of the Fibonacci retracement, which coincides with the 100-week EMA.
Macroeconomic Analysis
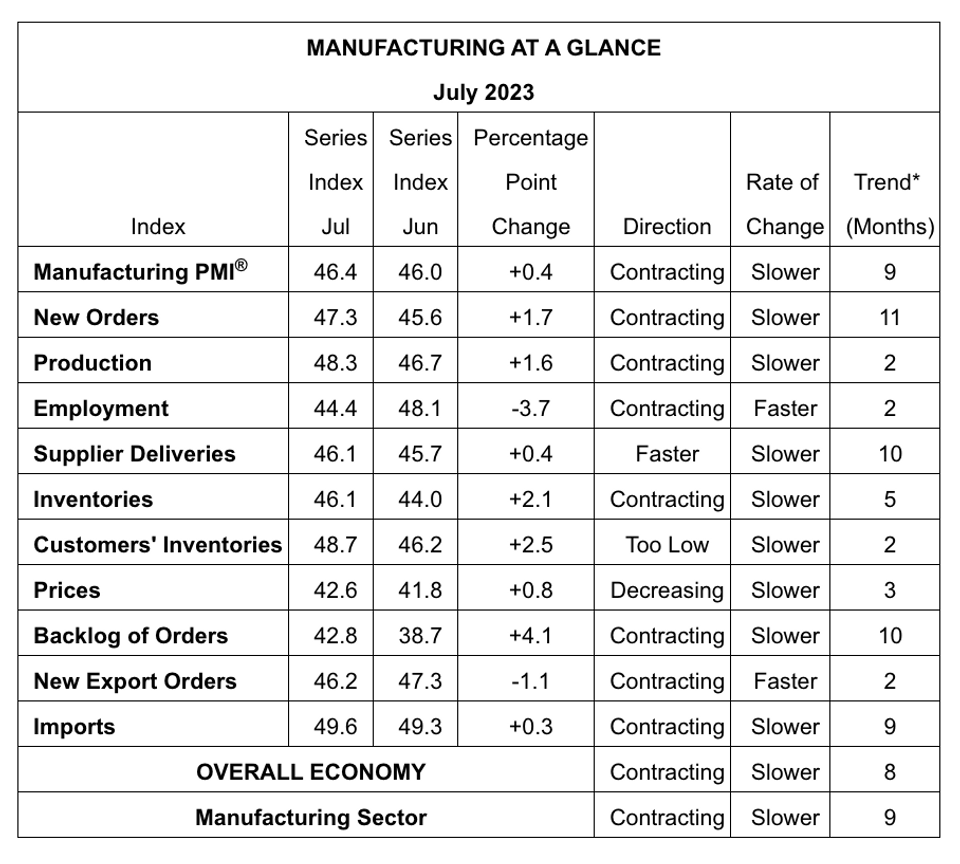
There are two things to note about July. First, the U.S. manufacturing sector showed signs of stability, albeit at a weaker level. According to the Institute for Supply Management (ISM), the Purchasing Managers’ Index (PMI) for the manufacturing sector inched up to 46.4 last month from 46.0 in June, versus expectations of 46.8, marking the lowest reading since May 2020. Second, it is related to the decline in factory employment over the past three years, which has led to an increase in layoffs.
The aforementioned manufacturing numbers represent the eighth consecutive month of contraction, following a 30-month period of expansion. This streak is the longest since the Great Recession of 2007-2009.
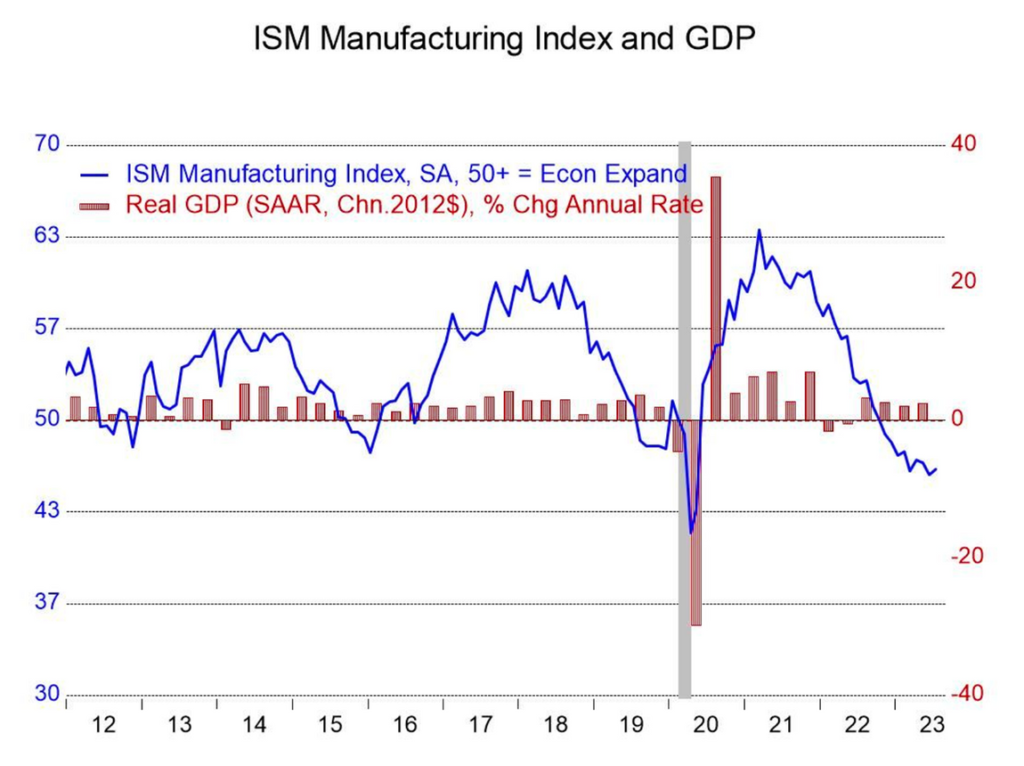
The ISM survey’s pessimism about manufacturing conditions is consistent with empirical data showing that the sector has indeed been relatively slow to recover. However, according to data released by the Federal Reserve last July, factory production may have rebounded in the second quarter.
The manufacturing sector has been one of the areas most affected by the 525 basis point rate hike since March 2022. Nevertheless, this sector can still contribute as much as 11.1% to the economy.
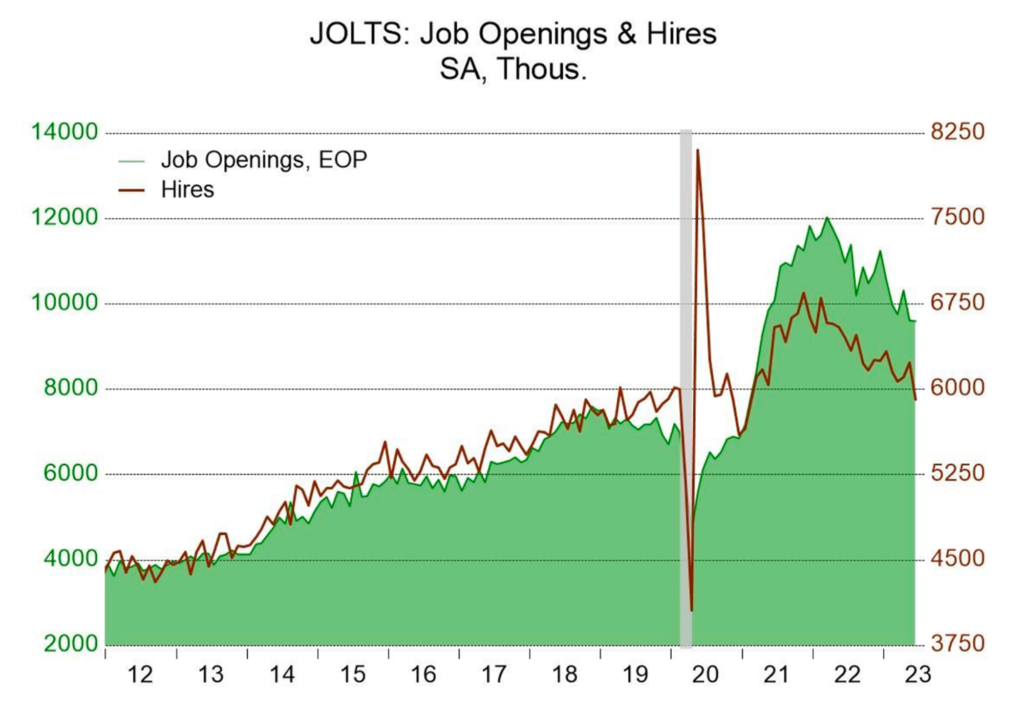
Turning to job openings data, according to the Job Opening and Labor Turnover Survey (JOLTS), the total number of job openings reached 9.582 million, down 0.4% from the revised May figure of 9.616 million. Although this decrease is relatively small compared to the market expectation of 1.8%, the job openings rate remains stable at 5.8%, with the revision decreasing by only 0.1 percentage points to the May level.
The stability in job openings is reflected in the number of job openings exceeding the number of unemployed. In June, the number of job vacancies increased slightly to 3.625 million from 3.519 million in May. However, this number is still well below the record level of 6.055 million in March 2022. Although the labor market is showing signs of weakening, it is still relatively tight by historical standards.
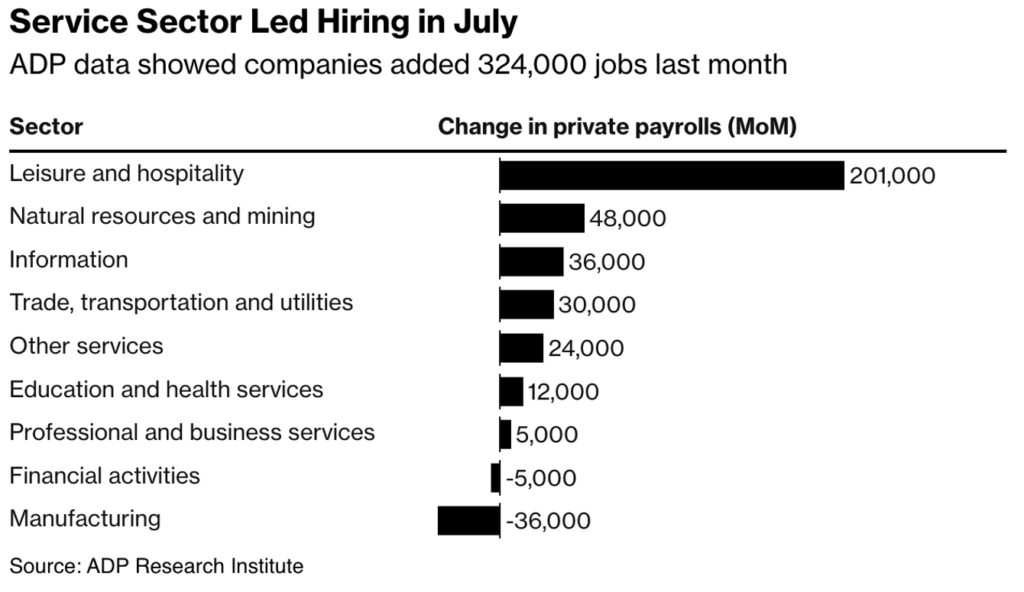
The increase in job openings is being driven by U.S. companies hiring more workers, suggesting that the labor market is showing good resilience. Private payrolls increased by 324,000 last month, according to data from the ADP Research Institute in conjunction with the Stanford Digital Economy Lab.
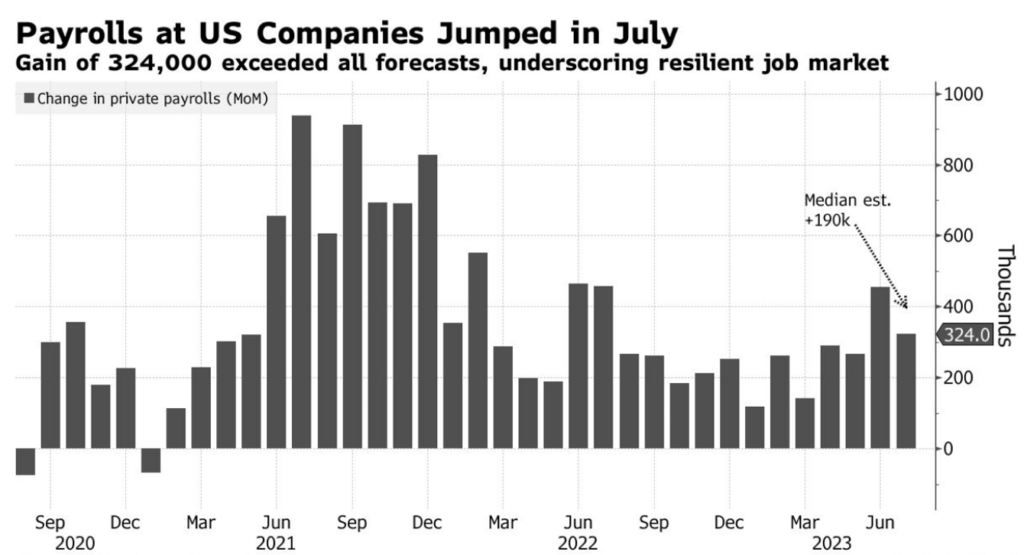
The increase in U.S. job openings has spread to all regions except the South. This growth is also concentrated in establishments with fewer than 250 employees. The sector with a significant increase of 201,000 is leisure and hospitality.
However, for firms with 500 or more employees, there has been a decline for three consecutive months, followed by a slowdown in wage growth. Workers who stayed employed saw a 6.2% year-over-year wage increase in July, the slowest growth rate since November 2021. For those who changed jobs, the median annual wage increase was 10.2%, the slowest pace in two years. Nevertheless, the labor market remains relatively stable.
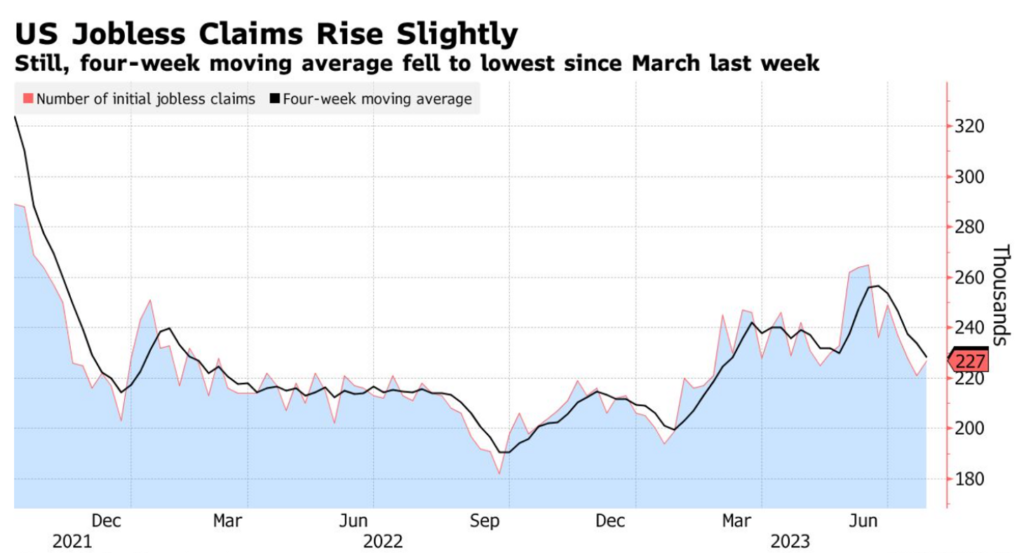
The solid performance of the labor market has contributed to a decline in U.S. jobless claims, which are approaching the lowest level in 2023. According to data from July 29th, initial jobless claims rose only slightly by 6,000 to 227,000. In addition, continuing claims, which include individuals who have been receiving benefits for more than one week, increased slightly to 1.7 million in the week ending July 22.
During the summer months, initial claims data tend to be more volatile as automakers shut down factories for annual retooling. However, to reduce this volatility, the four-week moving average, which provides a more stable trend, fell to 228,250, the lowest level since March.
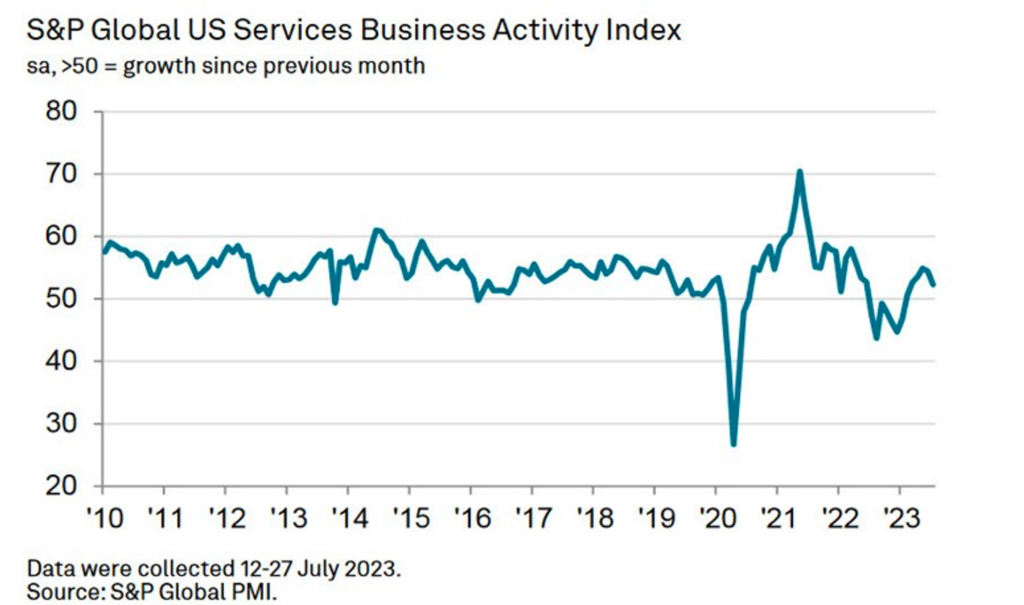
In July, the S&P Global Services PMI registered 52.3, its lowest level since February. The reading was below the previous index of 54.4 and just below the expected reading of 52.4. While business activity and new orders expanded, the pace of growth was slower than previously reported. In addition, cost pressures eased, with input prices rising at the slowest rate since December 2022.
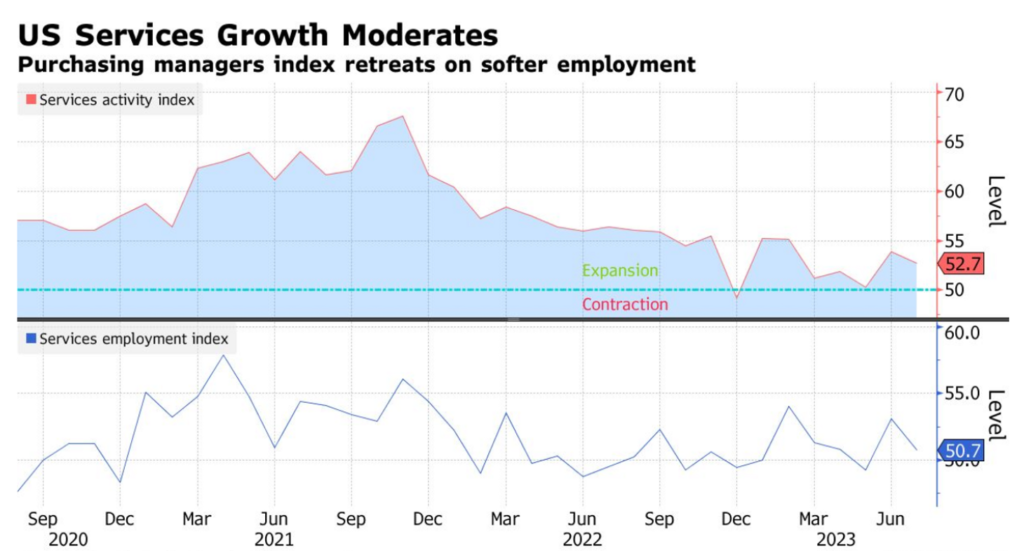
The U.S. services sector expanded at a more moderate pace in July as job growth slowed. According to data released on Thursday, the Institute for Supply Management’s services index fell 1.2 points to 52.7 last month. Although this number is above 50, which indicates expansion, it fell slightly short of expectations of 53.
The report also showed that employment at service providers saw minimal hiring in July. Although business activity and new orders slowed slightly, the index still reflected strong consumer demand.
BTC & ETH Price Analysis
Last week, the total market capitalization of crypto found support at the 55-week EMA level with a total of $1.124 trillion. Initially, there was a dip at the beginning of the week, but it rebounded and reached the 100-week EMA at $1.167 trillion by mid-week.
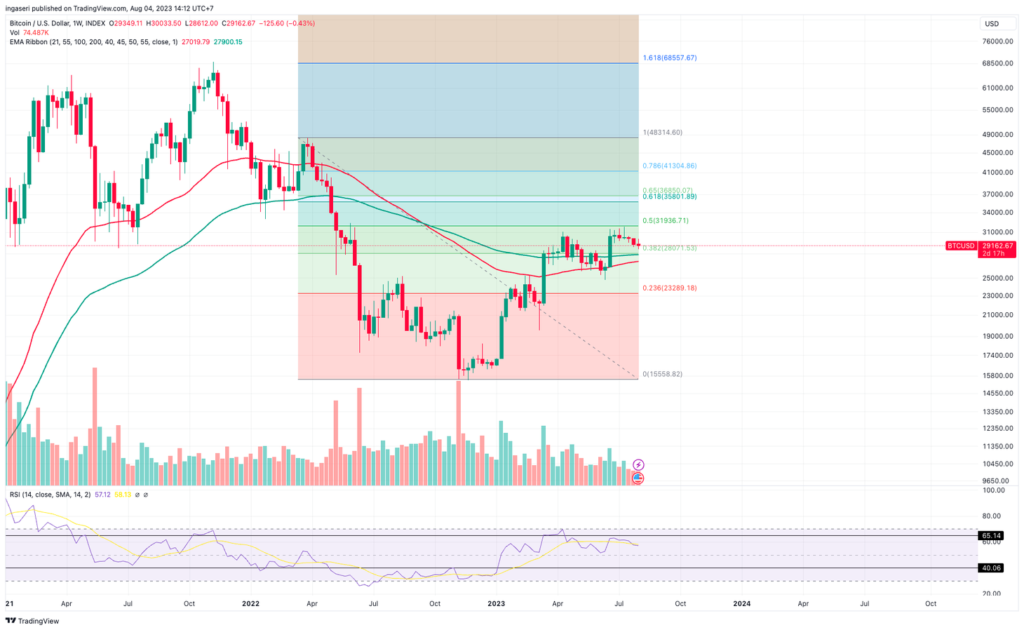
Over the past week, BTC has been trading sideways, falling below the $29,000 level. Since mid-July, BTC has continuously struggled to maintain its price movement after encountering resistance at the 0.5% Fibonacci retracement line. Currently, BTC’s support is at the $28,000 level, which coincides with the 0.382 Fibonacci retracement line and the 100-week exponential moving average (EMA) band.
Meanwhile, ETH fell 1.2% last week, but managed to hold at the 0.236 Fibonacci retracement support line, which coincides with the 100-week exponential moving average (EMA) line.
On-Chain Analysis
- 📊 Exchange: As the exchange reserve continues to rise, it indicates higher selling pressure. Net deposits on exchanges are low compared to the 7-day average. Lower deposits can be interpreted as lower selling pressure.
- 💻 Miners: Miners’ are selling more holdings compared to its one-year average. Miner’s revenue is in a moderate range, compared to its one-year average.
- 🔗 On-Chain: More investors are selling at a profit. In the middle of a bull market, it can indicate a market top. Investors are in a Anxiety phase where they are currently in a state of moderate unrealized profits.
- 🏦 Derivatives: Long position traders are dominant and are willing to pay to short traders. Buying sentiment is dominant in the derivatives market. More buy orders are filled by takers. As open interest decreases, it indicates investors are closing futures positions and possibility of trend reversals. In turn, this might trigger the possibility of long/short-squeeze caused by sudden price movement or vice versa.
- 🔀 Technicals: RSI indicates a neutral condition. Stochastic indicates a neutral condition where the current price is in a moderate location between the highest-lowest range of the last 2 weeks.
News About Altcoins
- GMX has introduced the GMX v2 test version, which operates on the Arbitrum and Avalanche mainnets. The new update offers support for trading additional assets such as SOL, XRP, LTC, DOGE, and ARB, and incorporates different types of collateral for trading positions, thereby increasing speed and minimizing slippage. Transaction fees have been reduced to a range of 0.05% to 0.07%. In addition, v2 adds features such as isolation pools, long-short balance incentives, and swap incentives for liquidity providers (LPs).
- The Shiba Inu ecosystem integrates a blockchain-based digital identity system. This integration aims to transform Shiba Inu from a meme coin to a major player in decentralized finance (DeFi). Shiba Inu developers are prioritizing Self-Sovereign Identity (SSI) in community projects to give users more control over their personal data online. The upcoming Shibarium blockchain will use BONE, TREAT, SHIB and LEASH tokens and is expected to launch at the end of August. The test blockchain for Shibarium recorded 27 million transactions from approximately 16 million wallets in July, indicating strong demand for the network.
News from the Crypto World in the Past Week
- The Ethereum mainnet marked its 8th anniversary on July 30th by celebrating its official launch date. In 2015 when its genesis block was created, ETH gave a block reward of 5 ETH. According to data from TokenView, by the anniversary date, the total number of transactions on the Ethereum network had surpassed 2.05 billion, with 66.12 million holding unique addresses. The current total supply of Ethereum in circulation is 47.22 million tokens, and approximately 2.986 million tokens have been burned since the implementation of various protocol changes.
- Not long after its launch on Coinbase and its Base network, the memecoin BALD experienced a rug pull. The token’s promoter is suspected of withdrawing $25.6 million in liquidity from the network after the coin’s total value increased by up to 3,000%. This action contributed significantly to a 92% drop in the coin’s value.
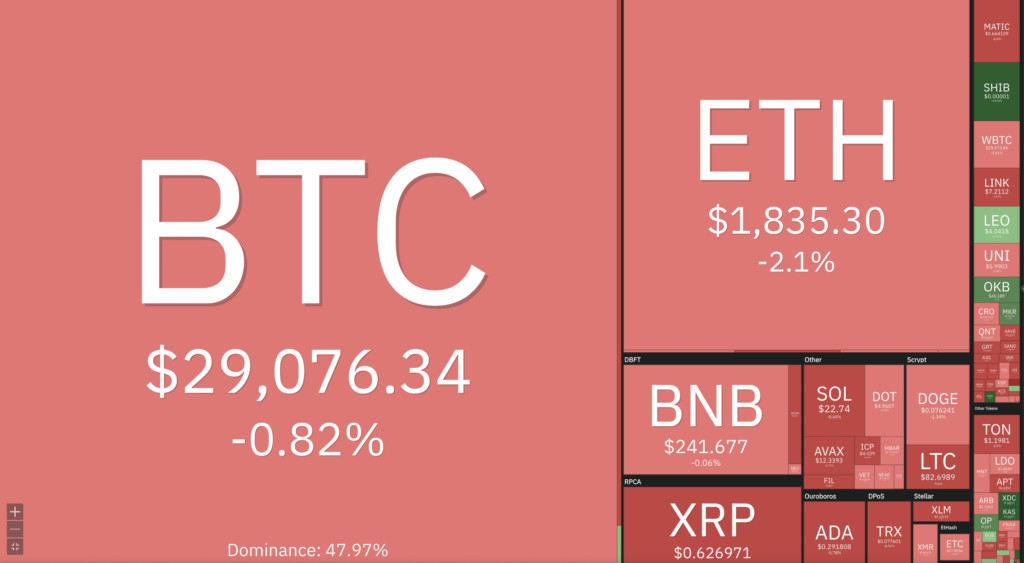
Cryptocurrencies Market Price Over the Past Week
Cryptocurrencies With the Best Performance
- Optimism (OP) +10.74%
- Maker (MKR) +2.49%
- USD Coin (USDC) +0.01%
Cryptocurrencies With the Worst Performance
- Compound (COMP) -19.45%
- Stellar (XLM) -14.17%
- Curve Finance (CRV) -13.66%
- Ripple (XRP) -11.81%
References
- Gmx News, GMX V2 Beta is now live!, accessed on 5 Agustus 2023.
- Wu Blockchain, Ethereum Mainnet Celebrates 8th Anniversary with Over 2.05 billion Total Transactions, accessed on 5 Agustus 2023.
- Shaurya Malwa, Shiba Inu Takes Step to Become DeFi Contender, Will Add Digital IDs to Ecosystem Projects, Coindesk, accessed on 5 Agustus 2023.
- Andrew Rossow, New “BALD” Memecoin Drops 92% in Apparent Rug Pull, Nftnow, accessed on 5 Agustus 2023.