
Meme tokens and NFTs continue to be a major force in the crypto space, as evidenced by the recent surge of a popular meme token, which saw its value skyrocket by 1000%. Bitcoin (BTC) also made impressive gains, reaching the $43,000 mark. With 2023 drawing to a close, the question on everyone’s mind is: will the year end on a high note? Dive into the analysis below to find out.
As usual, the Pintu trading team has gathered critical information and analyzed the general economic situation and the crypto market’s movements over the past week. However, it should be noted that all information in this Market Analysis is intended for educational purposes, not as financial advice.
Market Analysis Summary
- ⚠️ The U.S. economy is expected to grow moderately between 1.1% and 2.7% in the fourth quarter, possibly avoiding a recession.
- 📉 The New York manufacturing sector declined, with the main index falling 24 points to -14.5 in December.
- 📊 U.S. economic activity expanded in December, as indicated by the S&P Global Flash U.S. Composite PMI Output Index, which reached a five-month high of 51.0, driven by the services sector.
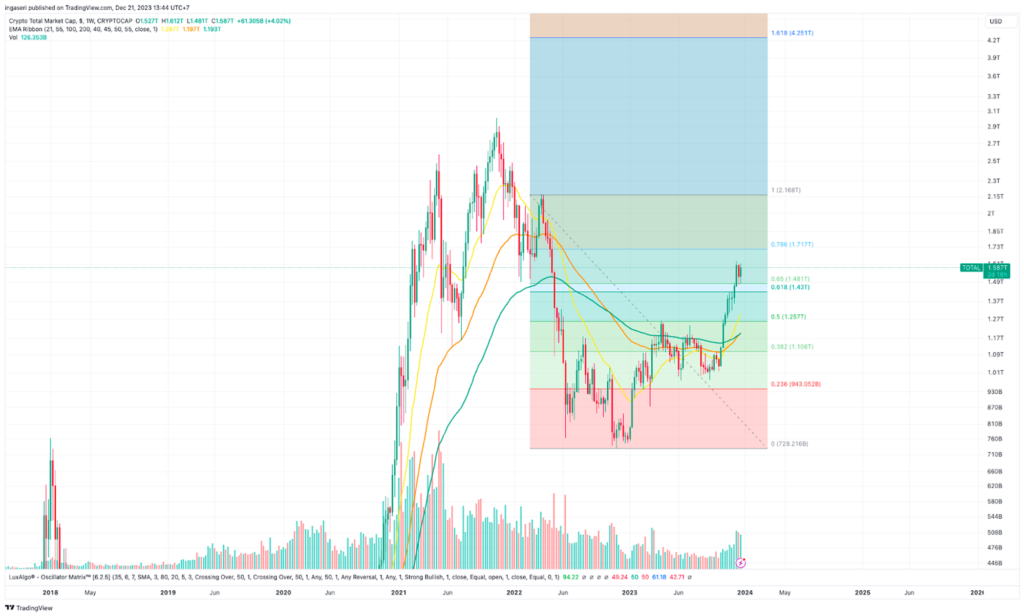
- ✍🏻 The total market capitalization of cryptocurrencies currently stands at $1.587 trillion, supported by the 0.65% Fibonacci retracement line.
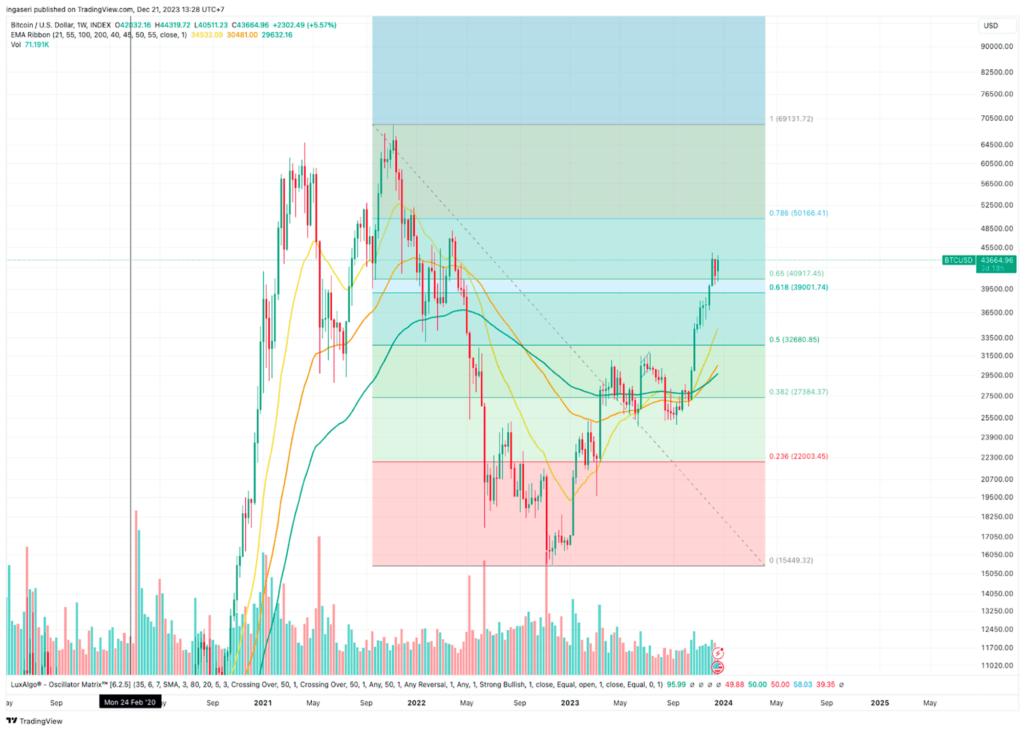
- 👀 BTC’s price level at $42,000 aligns with the 21-day exponential moving average (EMA) line, providing additional support.
Macroeconomic Analysis
Gross Domestic Product QoQ
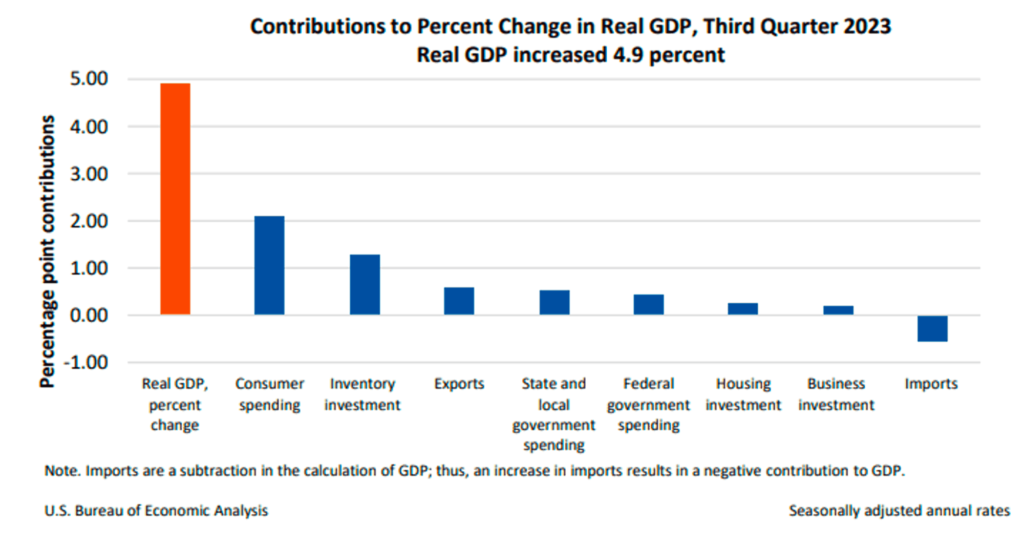
The U.S. economy shows signs of resilience, according to a Department of Labor report, fueled by lower-than-expected weekly unemployment claims of 205,000. While the Bureau of Economic Analysis revised third-quarter GDP growth down to 4.9%, marking a dip from initial estimates, it still represents the fastest pace since late 2021. However, downward revisions to consumer spending (to 3.1%) and the core PCE price index (to 2.0%) reflect some cooling. Despite a decline in private inventory investment, economic growth in the fourth quarter is projected to remain moderate, ranging between 1.1% and 2.7%, offering potential respite from recessionary fears.
Other Economic Indicators
- Empire State Manufacturing Survey: New York’s manufacturing sector experienced a significant downturn in December, with the main index falling 24 points to -14.5. The survey found that only 18% of respondents saw improved conditions, while 32% reported a decline. Key indicators such as new orders and shipments continued to fall for the third month in a row, while employment and the number of hours worked fell to their lowest levels in recent months. Despite a 13-point increase in the future business conditions index to +12.1, overall optimism remains weak, with only modest expectations for growth in new orders, shipments and employment over the next six months.
- S&P Global Manufacturing and Services PMI: Economic activity in the U.S. expanded in December as the S&P Global Flash U.S. Composite PMI Output Index reached a five-month high of 51.0, led by the services sector. This increase indicates an expansion in the private sector, fueled by a surge in orders and increasing demand for workers, offsetting the ongoing contraction in the manufacturing sector. This positive shift led the Atlanta Federal Reserve to revise its GDP growth estimate to an annualized rate of 2.6%. The labor market and retail sales also showed optimistic trends, contributing to the belief that a recession may soon be avoided. Inflation picked up slightly.
- Building Permits: The U.S. housing market saw a significant increase in construction activity in November, with housing starts reaching an adjusted annual rate of 1.56 million, up 15% from October and exceeding economists’ expectations of 1.36 million. Despite a slight dip in building permits to 1.46 million, the robust housing starts suggest that builders are actively responding to demand for new housing, seemingly undeterred by high borrowing costs. This surge in construction is consistent with a rise in homebuilder sentiment in December, breaking a four-month downward trend, and supports optimistic forecasts for the housing market, including expected increases in existing and new home sales next year.
- Existing Home Sales: In a surprising turnaround, existing home sales in the U.S. rose 0.8% in November to a seasonally adjusted annual rate of 3.82 million units, breaking a five-month trend of consecutive declines. According to the National Association of Realtors, the increase came amid a continued shortage of available homes and a retreat from 23-year high mortgage rates. November’s sales are likely attributable to contracts signed in the previous two months, when the average 30-year fixed mortgage rate rose to its highest level since 2000.
BTC Price Analysis
Once again, the cryptocurrency market has seized the attention of both investors and enthusiasts. The recent surge in popularity of meme coins and NFTs has become a focal point. While the headlines in the crypto space have been dominated by the anticipation surrounding the approval of BTC ETF, it is noteworthy that altcoins, such as dogwifhat, are the ones driving substantial gains.
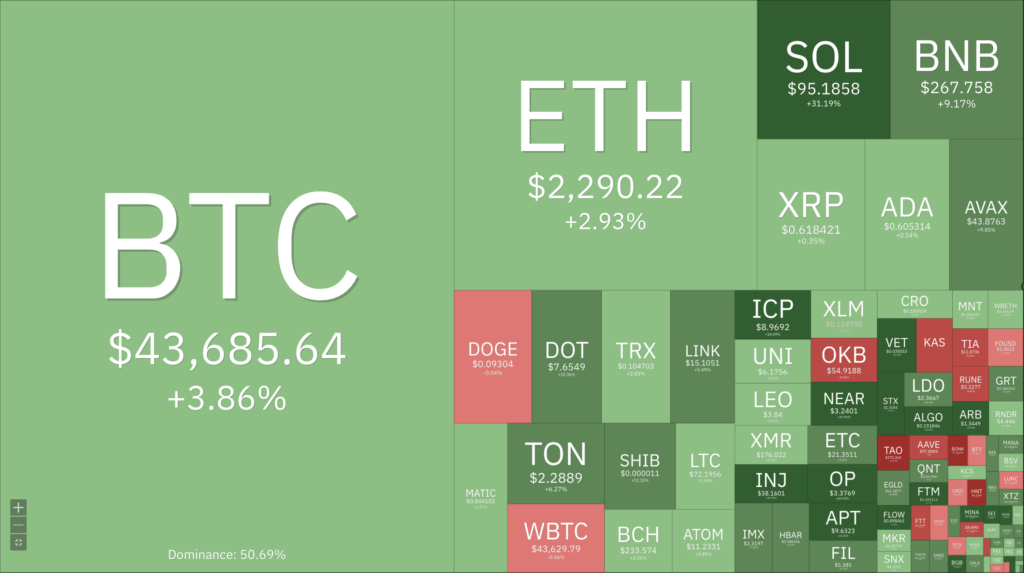
According to the report, these speculative tokens have experienced remarkable jumps of over 1,000% within just a few days, enticing investors with their attractively low trading prices. In the midst of this market resurgence, larger tokens like SOL and AVAX have also witnessed a surge in value, establishing themselves as some of the top gainers for the year.
The total crypto market cap is currently at 1.587 Trillion USD, supported by the 0.65 Fibonacci retracement line.
Meanwhile, BTC has experienced a 5.5% increase over the week, propelling it beyond the 43,000 USD mark. It is noteworthy that the weekly Fibonacci golden ratio upper bound, positioned at 40,900 USD, serves as robust support. Examining the daily chart, the 42,000 USD level aligns with the 21-day Exponential Moving Average (EMA) line, providing additional support.
On-Chain Analysis
- 📊 Exchange: As the exchange reserve continues to fall, it indicates lower selling pressure. Net deposits on exchanges are low compared to the 7-day average. Lower deposits can be interpreted as lower selling pressure.
- 💻 Miners: Miners’ are selling holdings in a moderate range compared to its one-year average. Miner’s revenue is in a moderate range, compared to its one-year average.
- 🔗 On-Chain: More investors are selling at a profit. In the middle of a bull market, it can indicate a market top. Long term holders’ movement in the last 7days were lower than the average. They have a motive to hold their coins. Investors are in a belief phase where they are currently in a state of high unrealized profits.
- 🏦 Derivatives: Long position traders are dominant and are willing to pay to short traders. Buying sentiment is dominant in the derivatives market. More buy orders are filled by takers. As open interest increases, it indicates more liquidity, volatility, and attention are coming into the derivative market. The increasing trend in open interest could support the current ongoing price trend.
- 🔀 Technicals: RSI indicates a neutral condition. Stochastic indicates a neutral condition where the current price is in a moderate location between the highest-lowest range of the last 2 weeks.
News About Altcoins
- Solana surpasses BNB’s market capitalization. SOL experienced a significant spike in value, trading close to $100 for the first time in 20 months. This spike briefly pushed SOL above Binance’s BNB in market capitalization, reaching $42.24 billion before falling back to around $39.35 billion. SOL’s rise was driven by significant blockchain partnerships with major players such as Visa and Shopify, as well as increased interest in DeFi activity on its network. Interest in the Solana-based BONK memecoin also contributed to this growth.
News from the Crypto World in the Past Week
- BlackRock’s latest SEC filing for its proposed spot bitcoin ETF now has the ticker: IBIT. This development suggests a preference for a cash redemption model, while still allowing for an “in-kind” option pending regulatory approval. The market has shown optimism regarding the approval of spot bitcoin ETFs, with similar filings from Ark 21Shares and WisdomTree also under consideration.
Cryptocurrencies Market Price Over the Past Week
Cryptocurrencies With the Best Performance
- Optimism (OP) +55,16%
- Sei (SEI) +53,19%
- Stacks (STX) +46,59%
- Near Protocol (NEAR) +43,65%
Cryptocurrencies With the Worst Performance
- Bonk (BONK) -26,91%
- Helium (HNT) +23,48%
- Beam (BEAM) -13,32%
- FTX Token (FTT) -11,47%
References
- Oluwapelumi Adejumo, Solana briefly surpassed BNB in market cap as SOL approaches $100, cryptoslate, accessed on 23 December 2023.
- Sarah Wynn, BlackRock’s proposed spot bitcoin ETF gets a ticker in latest filing with SEC, theblock, accessed on 23 December 2023.