
The crypto market entered early December 2025 with a cautious sentiment. Although Bitcoin managed to break the trend of four consecutive weeks of red closes, selling pressure returned after the weekly close. Technical analysis suggests a potential rebound if key support levels can be maintained, but on-chain data warns of depleting market liquidity similar to that of early 2022.
Weekly Market Analysis articles are created by Volubit's team of traders and analysts for Pintu Academy for educational purposes, not as financial advice.
Article Summary
- BTC still has hopes of a rebound as long as it is above the $87,453 level. If this happens, the potential movement could reach prices in the range of $99,339 – $108,830.
- ETH is currently resting on important support in the $2,738 area. If this support holds, ETH could potentially bounce. But if it breaks, the correction could continue.
- $116 – $126.36 is a solid support area for SOL despite forming a high upper shadow.
Fear and Greed Index
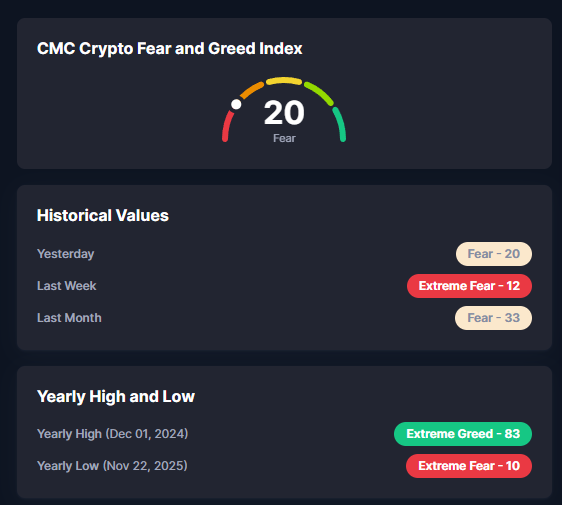
The current sentiment of market participants is still in the “Fear” zone with a score of 20. However, this figure shows a slight improvement compared to last week which was in the “Extreme Fear” area with a score of 12. This condition reflects high market vigilance even though the extreme panic has begun to subside.
Bitcoin (BTC) Analysis
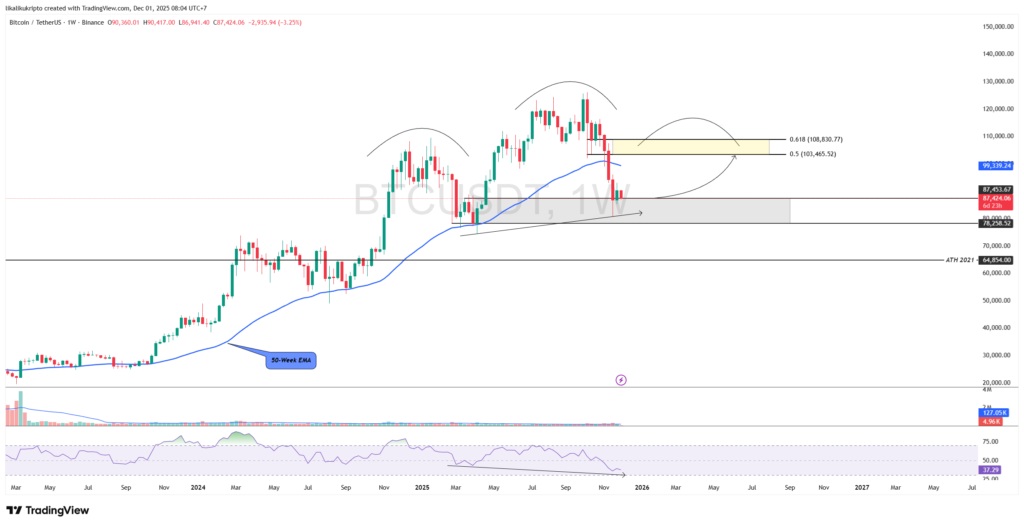
After four consecutive weeks of red closes, Bitcoin finally managed to record a green weekly closing candle. However, this euphoria was put on hold as the price corrected right after the weekly close this morning.
- Key Levels: The main defense right now is the Resistance Become Support (RBS) level at $87.453. This level is crucial to maintain the recovery momentum.
- Bullish Scenario: If the price is able to hold and move above $87,453, the opportunity for strengthening is wide open. The main upside target is in the range of $99,339 – $108,830, which is the area of the resistance cluster (50-Week EMA and golden pocket Fibonacci). The positive sentiment is also supported by the bullish divergence on the weekly timeframe.
- Bearish Scenario: If the price fails to hold above the RBS level, Bitcoin could potentially movesideways in the demand area between $78,258 – $87,453.
Ethereum (ETH) Analysis
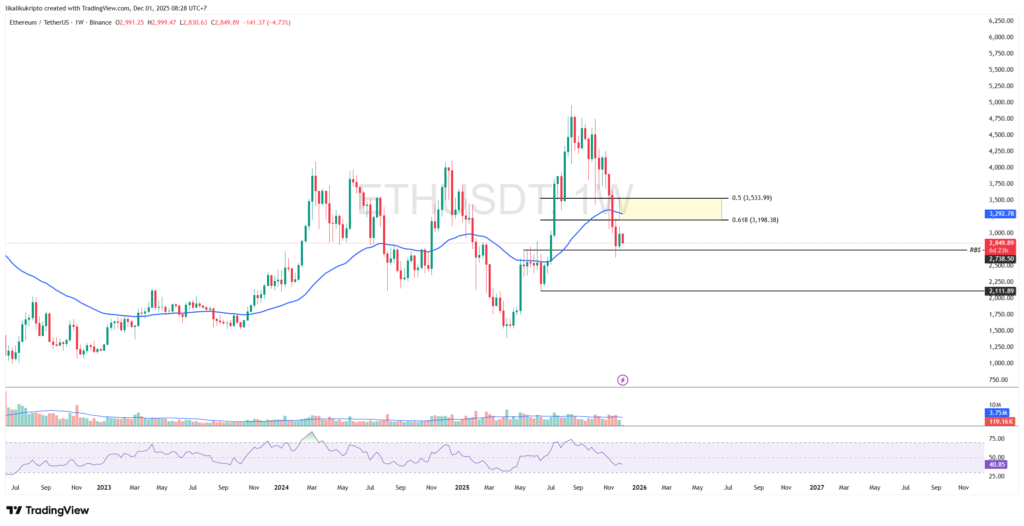
Similar to Bitcoin, Ethereum experienced a weekly post-close correction.
- Support: The main focus is on the RBS level at $2,738. This is a vital stronghold to keep the chances of a weekly rebound. If this level is broken, the price risks dropping to the next support at $2,111.
- Resistance: If a rebound occurs, the upside target is at the harmonic resistance area between $3,198 – $3,533.
Solana Analysis (SOL)
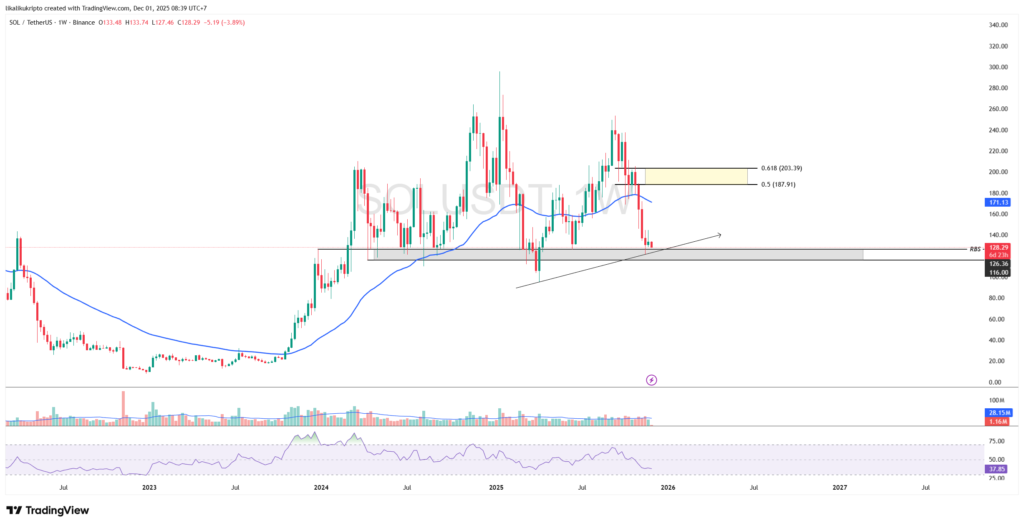
Solana is still in a consolidation phase after a significant decline since September. The weekly candle formed a high upper shadow, indicating that the selling pressure on the upper price is still strong.
- Buy Zone: The $116 – $126.36 area proved to be a solid support with high buying pressure. As long as the price stays above this zone, chances of recovery remain.
- Targets: The immediate target is the 50-Week EMA at $171.14, with the primary target in the range of $187.91 – $203.39.
On-Chain Analysis: Liquidity Alert
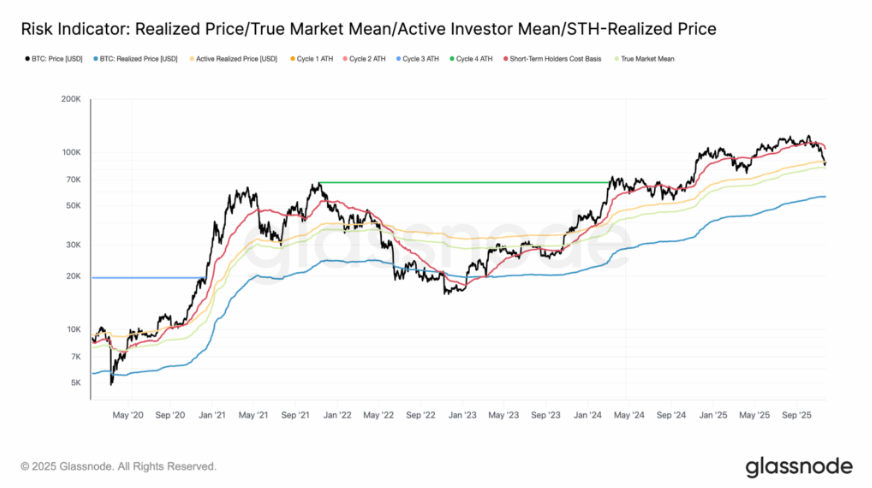
Behind the price movement, on-chain data is giving a cautionary signal. Since the beginning of October, Bitcoin’s price has continued to move below the short-term holder (STH) cost basis which stands at around $104,600.
- Weakening Demand: The price position below the STH cost basis indicates weakening liquidity and low market demand. Currently, Bitcoin is squeezed within a narrow range of $81,000 to $89,000.
- Historical Comparison: According to Glassnode’s report, the current pattern is very similar to Quarter 1 of 2022 after the All-Time High (ATH), where the market weakened due to shrinking capital inflows.
- Risk Conclusion: Bitcoin is currently in a vulnerable phase. The lack of buying interest makes it easier for the price to be depressed to lower levels.
Bitcoin ETFs: Fund Flows Remain Positive Amid Market Correction
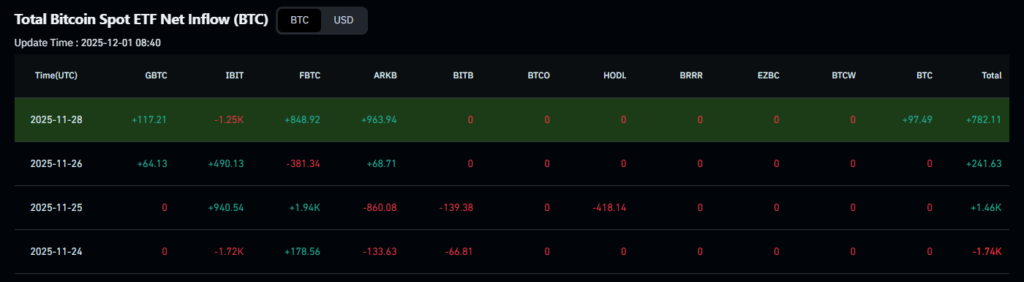
Bitcoin ETF Fund Flows Institutional activity through Bitcoin Spot ETFs shows mixed dynamics. The latest data on November 28, 2025 recorded a positive net inflow of +782.11 BTC, which was driven by the accumulation of several major ETF issuers. However, volatility in fund flows was still evident in the previous days.
Crypto Asset Performance in the Last Week
Top Performing Crypto Assets
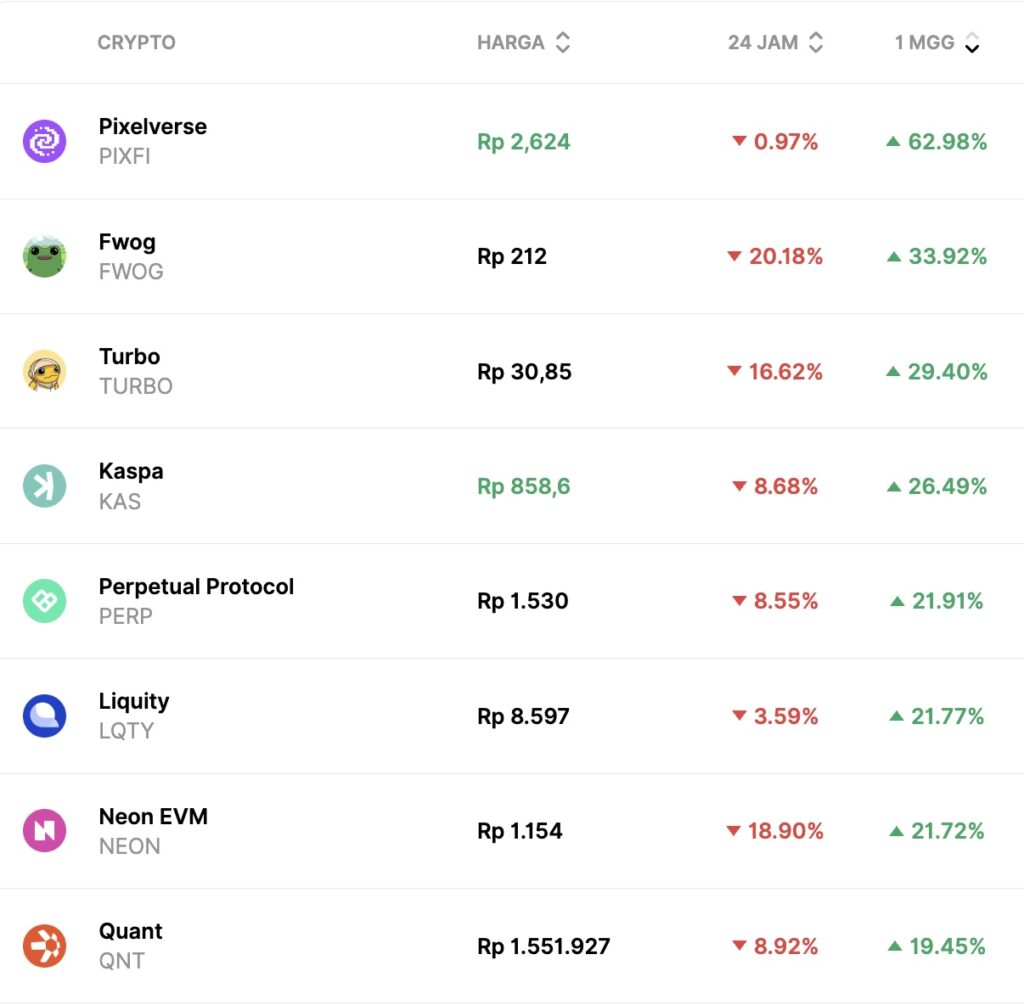
- Pixelverse ($PIXFI) +62.98%
- Fwog ($FWOG) +33.92%
- Turbo ($TURBO) +29.40%
- Kaspa ($KAS) +26.49%
Worst Performing Crypto Assets
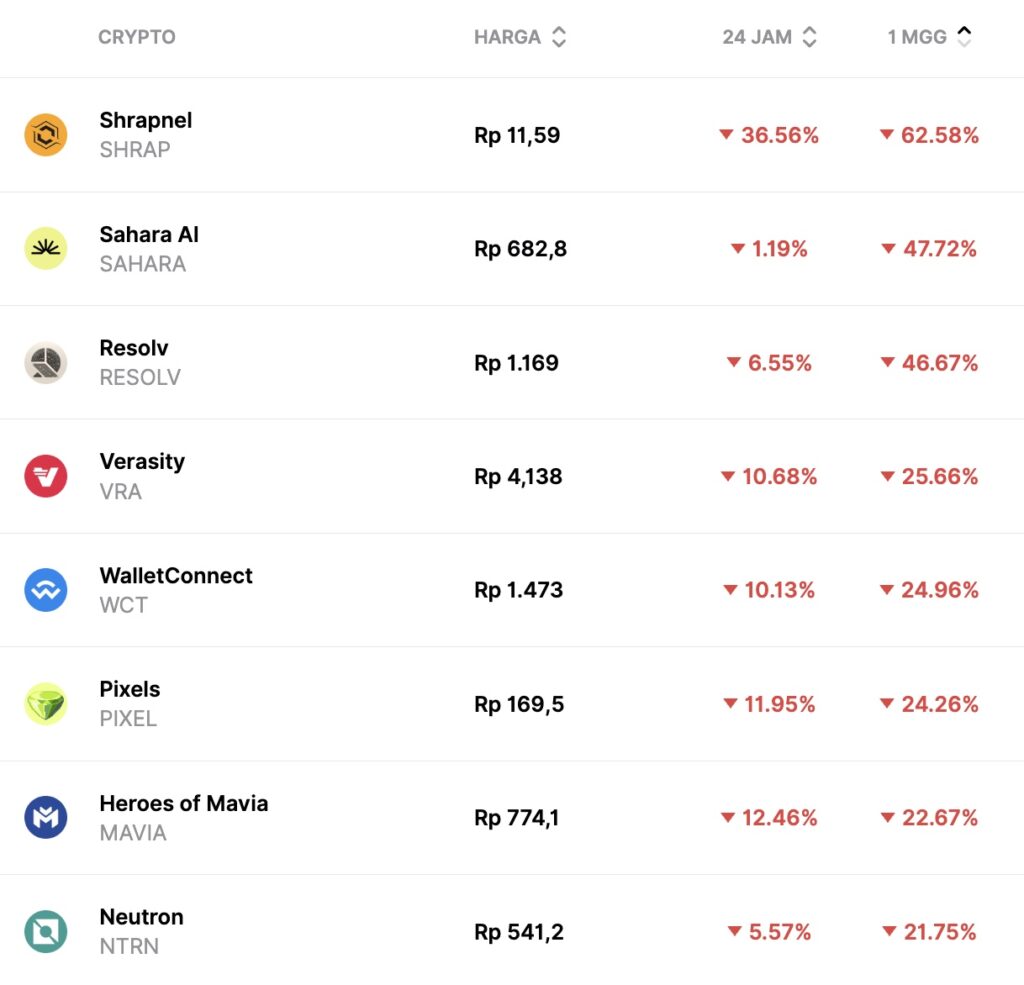
- Shrapnel ($SHRAP) -62.58%
- Sahara AI ($SAHARA) -47.72%
- Resolv ($RESOLV) -46.67%
- Verasity ($VRA) -25.66%
Disclaimer: All articles from Pintu Academy are intended for educational purposes and do not constitute financial advice.
Conclusion
This week will determine whether the green momentum of Bitcoin’s weekly close is just adead cat bounce or the beginning of a trend recovery. Technically, holding the $87,453 (BTC) and $2,738 (ETH) levels is an absolute must for the bulls. However, market participants are advised to remain vigilant given that on-chain data shows that liquidity is still thin and market risks have not fully subsided.