
Bitcoin (BTC) has been struggling to break back above $100,000 for weeks, but it’s still showing signs of strength. The broader crypto market, particularly BTC and ETH, also appears robust, even following the recent hacker attack on the major exchange Bybit. Read the full analysis by the Pintu Trader Team.
Market Analysis Summary
- 📝 BTC has shown recovery, reclaiming levels above $97,000 after facing pressure. As of February 20, 2025, BTC is trading around $97,185.87. BTC has been trading in a tight range, fluctuating between $94,000 and $100,000 over the past two weeks.
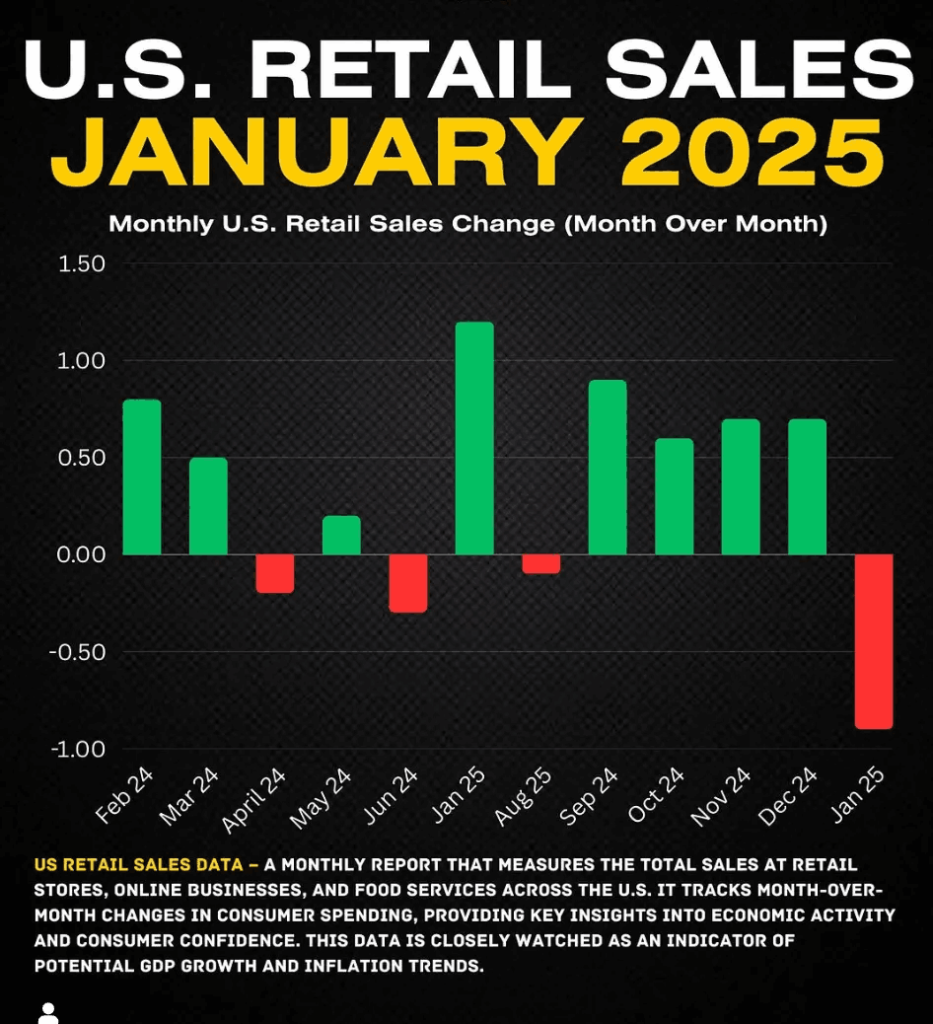
- 🛒 In January 2025, U.S. retail sales experienced a significant contraction, falling by 0.9% month-over-month.
- 💼 The Empire State Manufacturing Survey, which gauges business conditions for New York manufacturers, rebounded in February 2025, but optimism about future conditions waned.
- 🏠 Housing starts experienced a significant decrease in January 2025, falling by 9.8% to a seasonally adjusted annual rate of 1.37 million units.
- 🛑 According to the minutes, FOMC participants indicated a readiness to maintain current interest rates, emphasizing the need to see “further progress on inflation” before considering additional adjustments.
Macroeconomic Analysis
U.S Retail Sales
In January 2025, U.S. retail sales experienced a significant contraction, falling by 0.9% month-over-month, a figure considerably worse than the anticipated 0.1% decrease. This drop represents the largest decline in nearly two years.
Here’s a breakdown of the key points and potential impacts:
- Decline in Retail Sales: U.S. retail sales decreased by 0.9% in January 2025, contrasting with an upwardly revised 0.7% increase in the previous month.
- Broader Context: While the headline contraction was expected to some extent as a correction after the strong holiday season, the substantial fall in the control group suggests that consumption growth will be weaker than expected in the first quarter of 2025.
- Consumer Credit and Debt: Consumer credit outstanding increased significantly in December, with about half of that increase coming from revolving credit, which is typically credit card spending. This suggests that a notable portion (around 5%) of spending was fueled by debt, raising concerns about the sustainability of growth.
- Impact of Inflation: High inflation has disproportionately affected lower and middle-income households, as they allocate a greater share of their spending to essential, non-discretionary items.
- Overall Sales: Despite the monthly decrease, retail sales increased 4.2% year-on-year in January 2025, following a revised 4.4% rise in December 20243. In December 2024, retail sales stood at $632.25 billion, up from $628.73 billion the previous month and $606.96 billion one year prior.
The decline in retail sales reflects the burden of inflation and a potential shift in consumer behavior.
Other Economic Indicators
- NY Empire State Manufacturing Index: The Empire State Manufacturing Survey, which gauges business conditions for New York manufacturers, rebounded in February 2025, but optimism about future conditions waned. The headline general business conditions index climbed 18 points to 5.7, exceeding market expectations. A positive reading indicates expansion. The new orders index surged 20 points to 11.4, signaling a moderate gain in orders. The shipments index also rose significantly, increasing by 16 points to 14.2.
- Housing Starts and Building Permits: January 2025 brought a mixed bag of news for the U.S. housing market. Overall housing starts experienced a significant decline, dropping by 9.8% to a seasonally adjusted annual rate of 1.37 million units.
- FOMC Minutes: The Fed released the minutes from its Federal Open Market Committee (FOMC) meeting held on January 28-29, 2025. The FedWatch Tool chart displays the target rate probabilities for the Federal Reserve meeting on March 19, 2025. It shows that the market is pricing in a 97.5% probability of no change to the current target rate of 425-450 basis points.
BTC Price Analysis
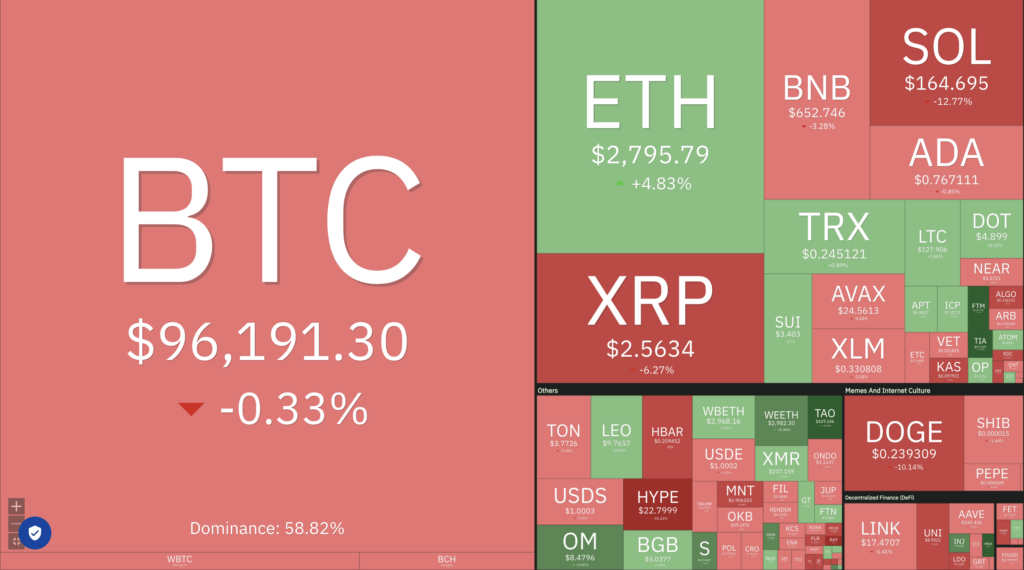
BTC has shown recovery, reclaiming levels above $97,000 after facing pressure. As of February 20, 2025, BTC is trading around $97,185.87. BTC has been trading in a tight range, fluctuating between $94,000 and $100,000 over the past two weeks. Some analysts believe it is stuck under pressure near $98K. A key resistance level to watch is $98,000. A break above this level could lead to further gains, potentially testing $98,800 or even $100,000. Support levels are around $93,000 – $94,000; falling below this could trigger further retests.
Market Sentiment and Analysis
Despite recent sideways movement, some analysts suggest that Bitcoin is maintaining a bullish trend in 2025. The Fear and Greed Index has declined, indicating increased uncertainty in the market1. However, it is still indicating that there is “fear”. Bitcoin’s market dominance is stable at 59.9%, with a market cap of $1.92 trillion.
News and Factors Influencing BTC
Growing support for blockchain use in U.S. Treasury operations is fostering optimism about mainstream crypto adoption. Progress in delaying the EU’s ban on unlicensed stable-coins has eased regulatory fears. There are speculation about China potentially relaxing its crypto restrictions which stirred market buzz. Also, BTC experienced outflows from ETF trading which increased pressure and uncertainty. And lastly, hawkish comments from the Federal Reserve and higher-than-expected inflation data in the U.S. have contributed to market concerns.
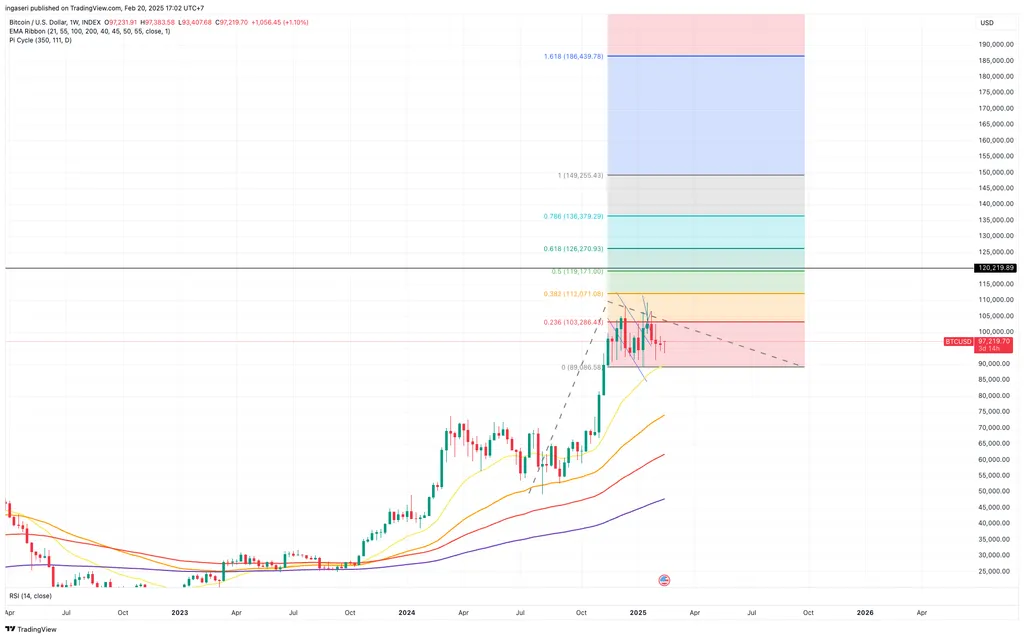
The chart above show a clear overall uptrend from 2023 into early 2025. BTC has been steadily making higher highs and higher lows, confirming bullish momentum. However, in recent weeks (January-February 2025), the price action has become more consolidated. BTC is trading in a relatively tight range, suggesting a period of indecision or accumulation. The RSI (14 period) appears to be in the neutral to slightly overbought territory, depending on the exact date. A high RSI suggests the asset might be overbought, and a correction could be coming.
Weekly Chart Analysis
- Resistance: Based on the Fibonacci levels on the chart, there seems to be strong resistance around $120,000 – $130,000, with some around $112,000.
- Support: The weekly chart highlights $90,000 and $80,000 (where the EMA ribbons are) as possible support levels if there is a correction.
Daily Chart Analysis
- Trendline Support: A rising trendline can be drawn from the lows in December 2024 through the recent lows in February 2025. This trendline has acted as a level of support.
- Resistance: As of February 20th, price will need to break through 103,000 to continue its upwards trend.
- EMA Ribbon: The price has consolidated around this area and if it breaks through the ema ribbons, it could be tested further down the trend.
Overall Summary and Potential Scenarios
- Bullish Scenario: If BTC can break above $98,000-$100,000 with conviction, it could target the next Fibonacci resistance levels at 112,000 and the 120,000-130,000 zones.
- Bearish Scenario: If BTC breaks down through the rising trendline support and closes below $90,000, it could signal a deeper correction towards the EMA ribbon support levels on the weekly chart (around $80,000 or lower).
- Consolidation: The most likely scenario, given the recent price action, is continued consolidation within the current range. A breakout or breakdown from this range will likely determine the next major move.
On-Chain Analysis
- 📊 Exchange: As the exchange reserve continues to rise, it indicates higher selling pressure. Net deposits on exchanges are low compared to the 7-day average. Lower deposits can be interpreted as lower selling pressure.
- 💻 Miners: Miners’ are selling holdings in a moderate range compared to its one-year average. Miner’s revenue is in a moderate range, compared to its one-year average.
- ⛓️ On-chain: More investors are selling at a profit. In the middle of a bull market, it can indicate a market top. Long term holders’ movement in the last 7 days was lower than the average. They have a motive to hold their coins. Investors are in a belief phase where they are currently in a state of high unrealized profits.
- 🏦 Derivative: Long position traders are dominant and are willing to pay to short traders. Buying sentiment is dominant in the derivatives market. More buy orders are filled by takers. As open interest increases, it indicates more liquidity, volatility, and attention are coming into the derivative market. The increasing trend in open interest could support the current ongoing price trend.
- 🔀 Technicals: RSI indicates a neutral condition. Stochastic indicates a neutral condition where the current price is in a moderate location between the highest-lowest range of the last 2 weeks.
News About Altcoins
- Monad Launches Public Testnet with Faster Performance Than Ethereum. Layer 1 blockchain Monad officially launched its public testnet on February 19, inviting active Ethereum users to explore its ecosystem, which includes over 50 dApps and infrastructure projects. With a speed of 41 TPS—more than twice that of Ethereum—Monad utilizes parallel execution to enhance transaction efficiency. The network also distributed testnet tokens to nearly nine million Ethereum addresses to encourage adoption. Backed by $244 million in funding from Dragonfly and Paradigm, Monad aims to provide an innovative experience for developers and users during this trial phase.
News from the Crypto World in the Past Week
- Bybit Loses $1.4 Billion in Biggest Crypto Hack Ever. Bybit has experienced the largest cryptocurrency exchange hack to date, losing over $1.4 billion in stETH, mETH, and other ERC-20 tokens. The attack, suspected to be perpetrated by the North Korean-backed Lazarus Group, involved social engineering tactics to trick transaction signers into approving a malicious smart contract logic alteration. This incident underscores the vulnerability of even highly secure centralized exchanges to sophisticated attacks. Blockchain security firms, such as Cyvers, are developing off-chain transaction validation solutions to mitigate these risks.
Cryptocurrencies Market Price Over the Past Week
Cryptocurrencies With the Best Performance
- Sonic (S) +61.59%
- Maker (MKR) +55.38%
- Celestia (TIA) 17.66%
- Bittensor (TAO) +17.66%
Cryptocurrencies With the Worst Performance
- Raydium (RAY) -28.68%
- Immutable (IMX) -17.54%
- Jupiter (JUP) -14.16%
- The Sandbox (SAND) -13.55%
References
- Zoltan Vardai, Bybit exploit exposes security flaws in centralized crypto exchanges, cointelegraph, accessed on 22 Februari 2025.
- Squiffs, Monad Launches Testnet and Sends Test Tokens to 9 Million Wallets, thedefiant, accessed on 22 Februari 2025.