Is it true that we are still in the early stages of a recession? Then, will the Fed change its stance on interest rate hikes? What about the state of Bitcoin amid this situation? Find out the answers by reading the following market analysis.
The Pintu trader team has collected various data that analyze macroeconomics and the crypto market movement in the past week. However, kindly pay attention that all information in this market analysis is for education purposes only, not financial advice
Market Analysis Summary
- 🚨 There is a possibility that a gentle economic slowdown may not occur in the near future. Currently, we are probably in the early stages of a recession.
- 📈 The Fed is suggesting that they may need to increase interest rates more than originally planned to combat high inflation.
- ⏳ We have not seen any significant movement since the bearish death cross on BTC’s weekly chart. Expect BTC to move sideways between US$ 21,000 – US$ 25,000.
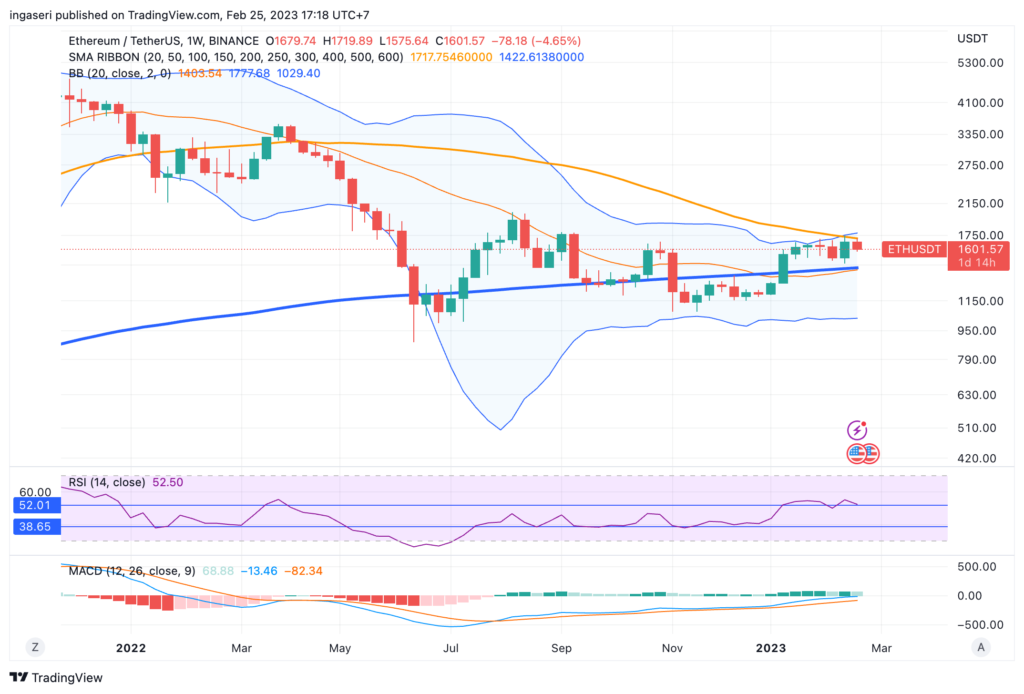
- ⛔ ETH is still facing 50 weeks MA as resistance for the 2nd consecutive week.
Macroeconomic Analysis
We do not believe a gentle economic slowdown is in sight. The substantial increase in the fed funds rate from virtually zero to 5% in under a year is noteworthy, and we suspect that the full impact of this modification has not yet been realized. It’s important to consider that we are only in the first year after almost 14 years of unwavering 0% interest rates and quantitative easing.
Numerous companies have business models that were founded on and relied upon 0% interest rates and lax monetary policies. It will require time for the trillions of dollars in liquidity that the Fed infused into the market over the past 14 years to leave the market. We are probably in the early stages of a recession, and we should not depend on the ongoing strength of the labor market and consumer spending as indicators that a recession will not occur.
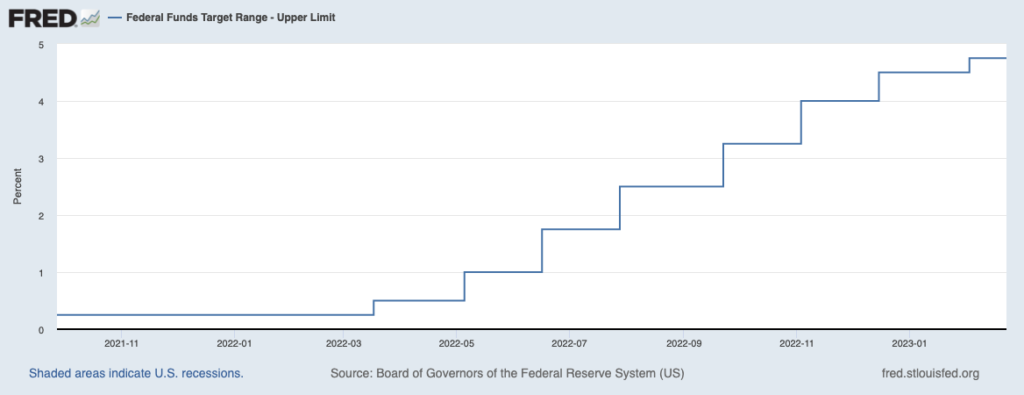
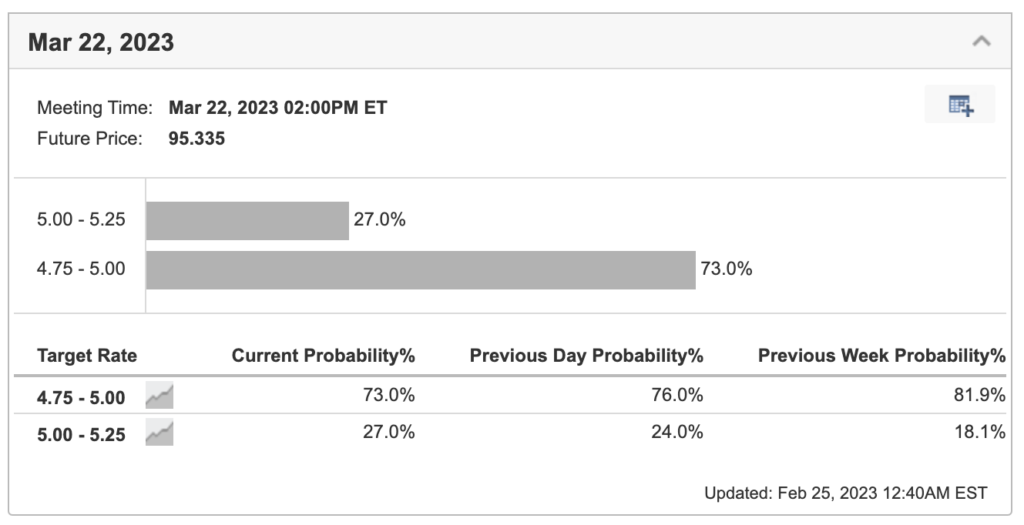
According to the most recent FOMC minutes, the Fed is suggesting that they may need to increase interest rates more than originally planned to combat high inflation due to the strong U.S. economy. During their recent meeting, officials decided to raise the benchmark fed funds rate by 25 bps, which is a smaller increase than the 50 bps and 75 bps increases made in previous months.
Although most officials believed that a slower pace was the best way to manage the risks of raising rates and concurred that a less hawkish approach to hikes was necessary, some were worried about financial markets misconstruing this as a weakening of the agency’s dedication to reducing inflation.
This narrative is further stamped by the fact that core PCE (personal consumption expenditures price index) increased 0.6% for the month, and was up 4.7% from a year ago. The market had been expecting respective readings of 0.5% and 4.4%. The core PCE gains were 0.4% and 4.6% in December. Headline inflation also increased by 0.6% and 5.4% respectively.
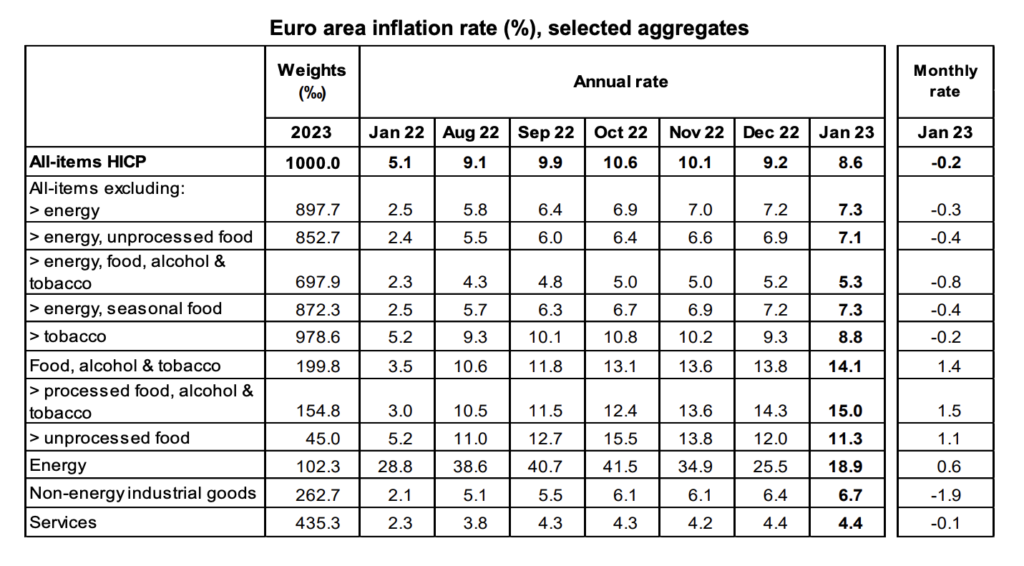
According to Eurostat, the statistical office of the European Union, the annual inflation rate in the euro area dropped from 9.2% in December to 8.6% in January 2023. In comparison, the rate was 5.1% a year earlier. Similarly, the European Union’s annual inflation rate decreased from 10.4% in December to 10.0% in January 2023, compared to 5.6% the previous year.
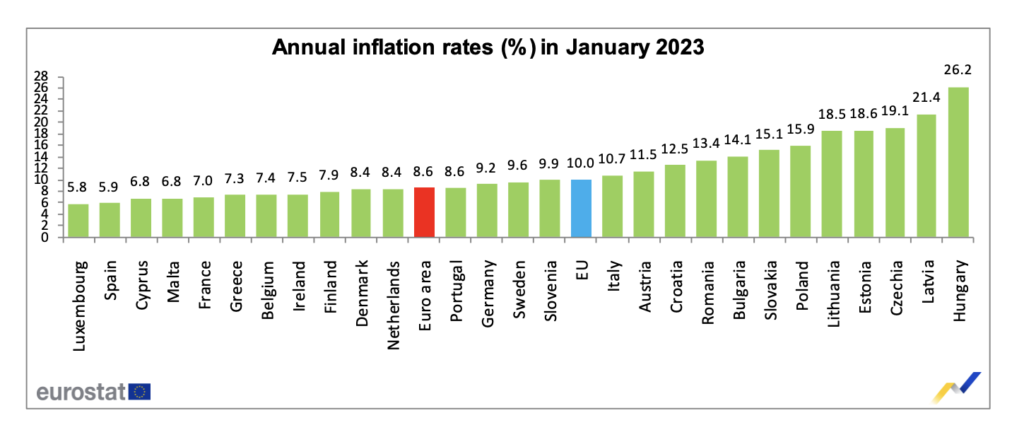
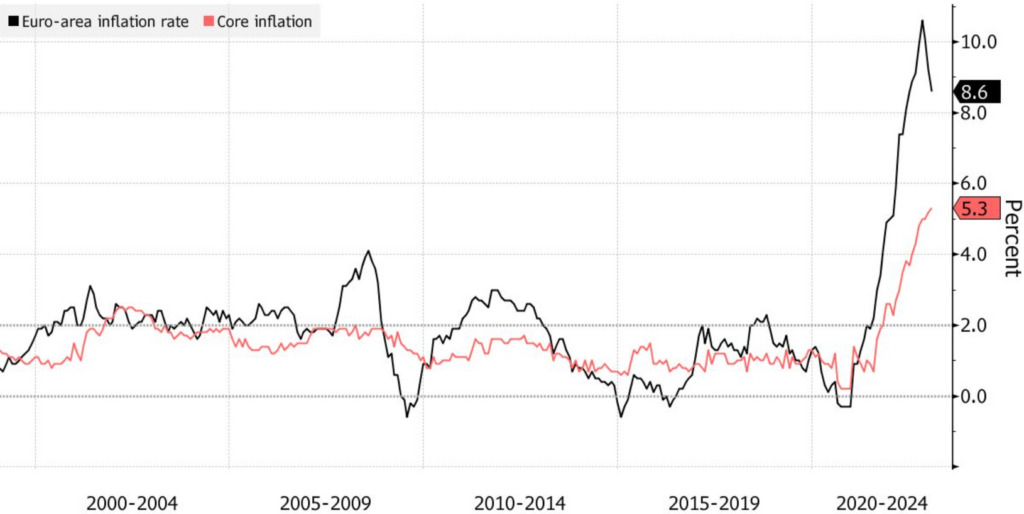
Core price increases rose to 5.3%, surpassing the initial estimate of 5.2%. Additionally, headline inflation, which encompasses food and energy costs, increased by 0.1 percentage points to 8.6% after Germany’s figure was found to be greater than the agency’s preliminary assessment.
These data indicate that underlying inflation in the euro area reached a historic high in January, likely strengthening the European Central Bank’s intention to increase interest rates by an additional half-point in the coming month.
Bitcoin Price Analysis
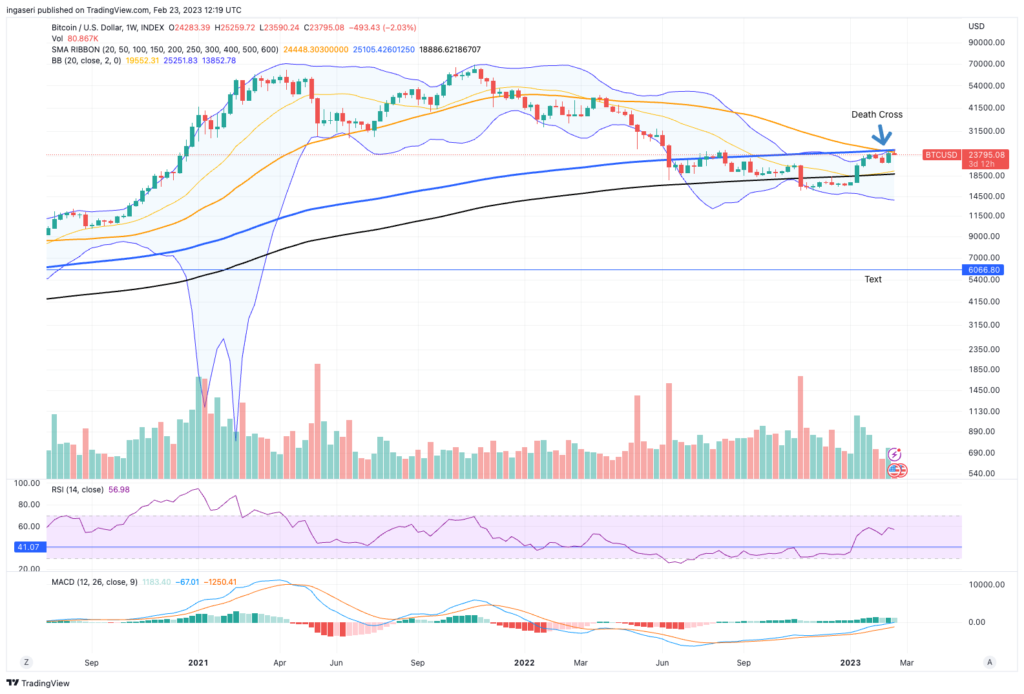
We have not seen any significant movement since the bearish death cross on the weekly chart. For the first time ever, the MA 50 crossed beneath the MA 200 on the weekly chart, which could be worrisome since Bitcoin has never experienced this before. Nevertheless, some experts suggest that the death cross relies on historical moving averages and that much of the decline may have already occurred before the intersection.
Over the week, we saw BTC moving sideways as expected and retraced back from the uppermost of its weekly bollinger’s band. Also noticed how we are once again rejected from the important 200 weeks MA resistance line. Expect BTC to move sideways between 21-25K.
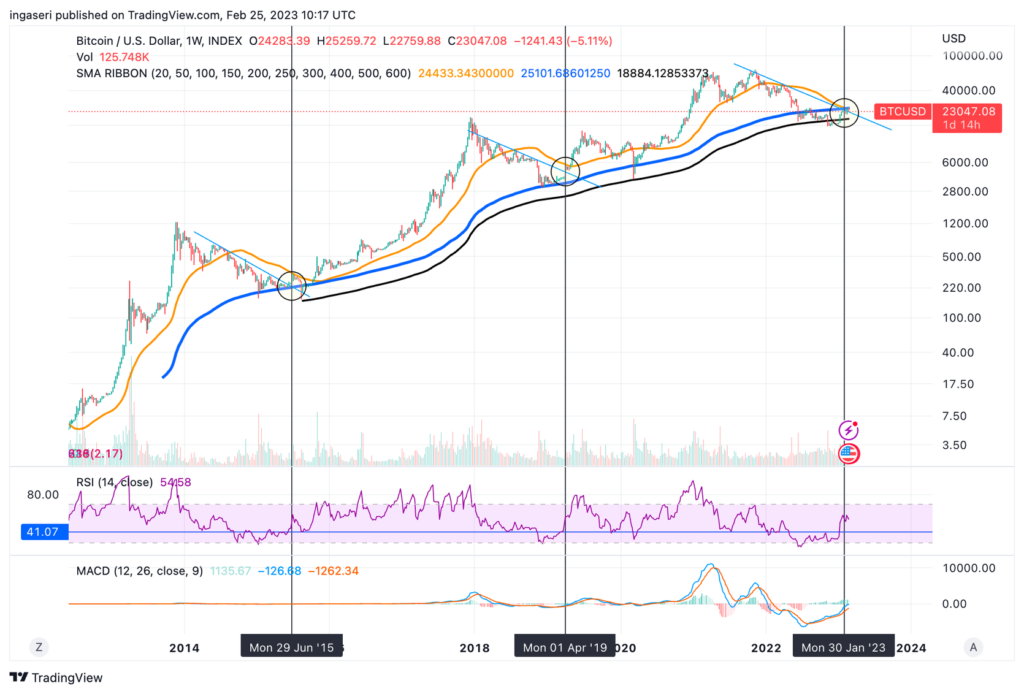
On the monthly chart, notice how we are almost breaking above the macro downtrend pattern. For the past two occasions, breaking above this macro downtrend would mean a start of a reversal towards the upside, although we might experience a post-breakout retest similar to that of 2015’s. This breakout would likely be timed for somewhere in March.
If we were to experience a post-breakout retest, we could see BTC dip into the macro-downtrend around May this year, we might be seeing the 22k level again.
Ethereum Price Analysis
ETH is still facing 50 weeks MA as resistance for the 2nd consecutive week. Expect movement to be sideways between 1,425 to 1,725.
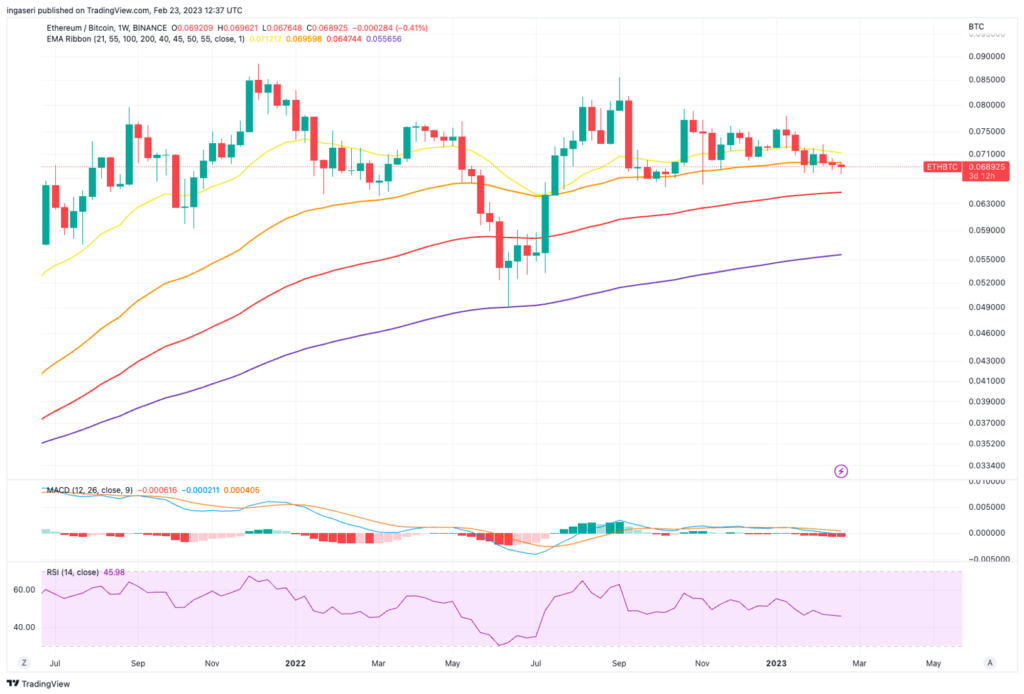
Looking at the ETH/BTC chart, we can see that it broke below the 55 weeks EMA for the 2nd consecutive week and has formed a resistance. This means that BTC is gaining ground with respect to ETH.
On-Chain Analysis
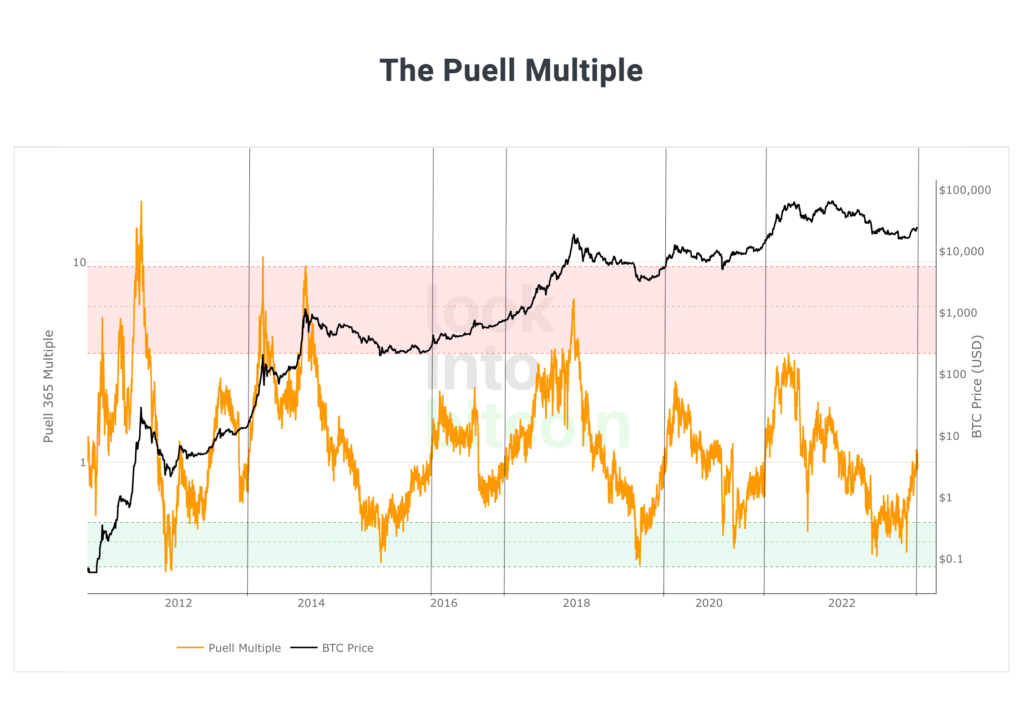
The Puell Multiple is a calculation that involves dividing the daily value of newly issued bitcoins (in USD) by the 365-day moving average of daily issuance value.
The focus of this metric is on the Bitcoin ecosystem’s supply side, specifically the revenue generated by Bitcoin miners. By examining market cycles through the lens of mining revenue, it takes into account the fact that miners are often seen as obligatory sellers who must sell their Bitcoin earnings to cover the costs of their mining equipment. This is especially important in a market where prices fluctuate greatly. Consequently, the revenue generated by miners can have a significant impact on Bitcoin’s price in the long run.
Notice that each time the indicator reaches the value of 1, we see the BTC has bottomed and is ready to take off. We might just experience this once more.
On-Chain Analysis:
📊 Exchange: As the exchange reserve continues to fall, it indicates lower selling pressure. Net deposits on exchanges are low compared to the 7-day average. Lower deposits can be interpreted as lower selling pressure.
💻 Miners: Miners’ are selling holdings in a moderate range compared to their one-year average. Miner’s revenue is in a moderate range, compared to its one-year average.
🔗 On-Chain: More investors are selling at a loss. In the middle of a bear market, it can indicate a market bottom. Long-term holders’ movement in the last 7 days was lower than the average. They have the motive to hold their coins. Investors are in a Fear phase where they are currently with unrealized profits that are slightly more than losses.
🏦Derivatives: Long-position traders are dominant and are willing to pay short traders. Buying sentiment is dominant in the derivatives market. More buy orders are filled by takers. As open interest increases, it indicates more liquidity, volatility, and attention are coming into the derivative market. The increasing trend in open interest could support the current ongoing price trend.
🔀 Technicals: RSI indicates an Overbought condition where 70.00% of price movement in the last 2 weeks has been up and a trend reversal can occur. Stochastic indicates a Neutral condition where the current price is in a moderate location between the highest-lowest range of the last 2 weeks.
Altcoin News
- 🔗 Avalanche (AVAX) has introduced HyperSDK. HyperSDK is a framework for creating virtual machines on Avalanche. The framework aims to abstract away common runtime complexities and speed up the development process for building virtual machines on Avalanche from “many months to just a few days.” Blockchains created with HyperSDK will be called HyperChains and can be adapted for any function.
- 🖼️NFT marketplace Blur announces BLUR token airdrops season 2. In this season, Blur will distribute as many as 300 million BLUR tokens. The approach used to distribute the tokens will use the concept of gamification. Coinciding with the airdrop announcement, Blur has overtaken OpenSea as the NFT with the highest trading volume in the past month.
More News from Crypto World in the Last Week
- ⚡ Coinbase Is Building Its Own Ethereum Layer-2 Network Called Base. Base will be the new home for Coinbase’s on-chain products and—it hopes—an open ecosystem for millions of new decentralized apps. Base will be a rollup agnostic superchain powered by Optimism. Coinbase said that Base will not be launching a network token.
- 🎵 Spotify Is Testing Token-Enabled Music Playlists. This feature allows holders of non-fungible tokens (NFT) to connect their wallets and listen to curated music. Spotify said the curated playlists will be actively updated during the three-month testing period. Currently, the curated playlist can only be accessed by token holders within the Fluf, Moonbirds, Kingship, and Overlord communities.
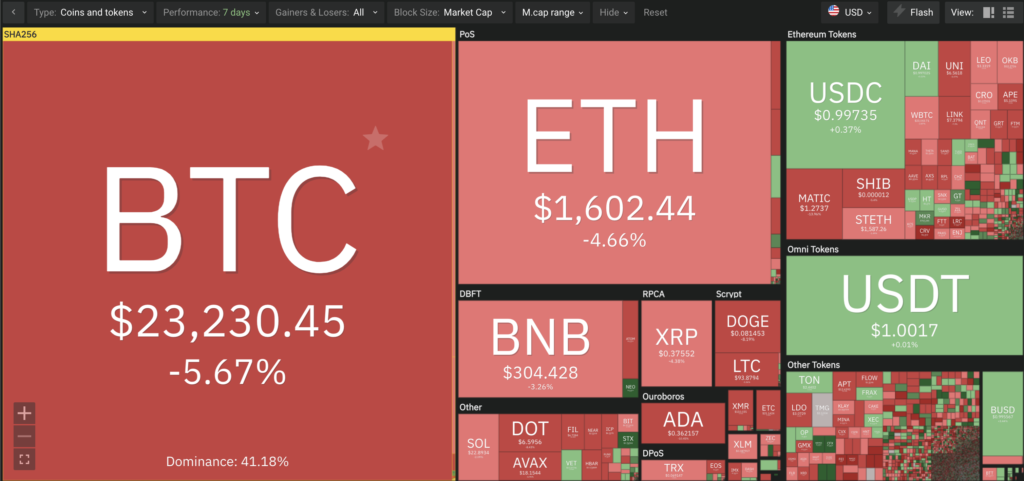
Cryptocurrencies Market Price Over the Past Week
Cryptocurrencies With the Best Performance
- Alchemy Pay (ACH) +47.85%
- Perpetual Protocol (PERP) +32.66%
- Yearn Finance (YFI) +26.76%
- Ankr Network (ANKR) +28.37%
Cryptocurrencies With the Worst Performance
- Filecoin (FIL) -26.55%
- LooksRare (LOOKS) -23.70%
- WOO Network (WOO) -22.74%
- Skale Network (SKL) -19.94%
Reference
Stacy Elliot, Coinbase Is Building Its Own Ethereum Layer-2 Network Called ‘Base’, Decrypt, accessed on 26 February 2023.
Avalanche, Introducing HyperSDK: A Foundation for the Fastest Blockchains of the Future, accessed on 26 February 2023.
Shradda Sharma, Blur NFT Marketplace Dethrones OpenSea Within Months of Launch, Beincrypto, accessed on 26 February 2023.
Rosie Perper, Spotify Is Testing Token-Enabled Music Playlists, Coin Desk, accessed on 27 February 2023.
