
Today, January 20, 2025, Donald Trump was officially inaugurated as the 47th President of the United States. The event has been highly anticipated, and just days prior, a token named OFFICIAL TRUMP made waves by skyrocketing to a $31 billion market capitalization within hours of its launch. How did Bitcoin (BTC) react to this development? Here’s the analysis from the Pintu’s Trader team.
Market Analysis Summary
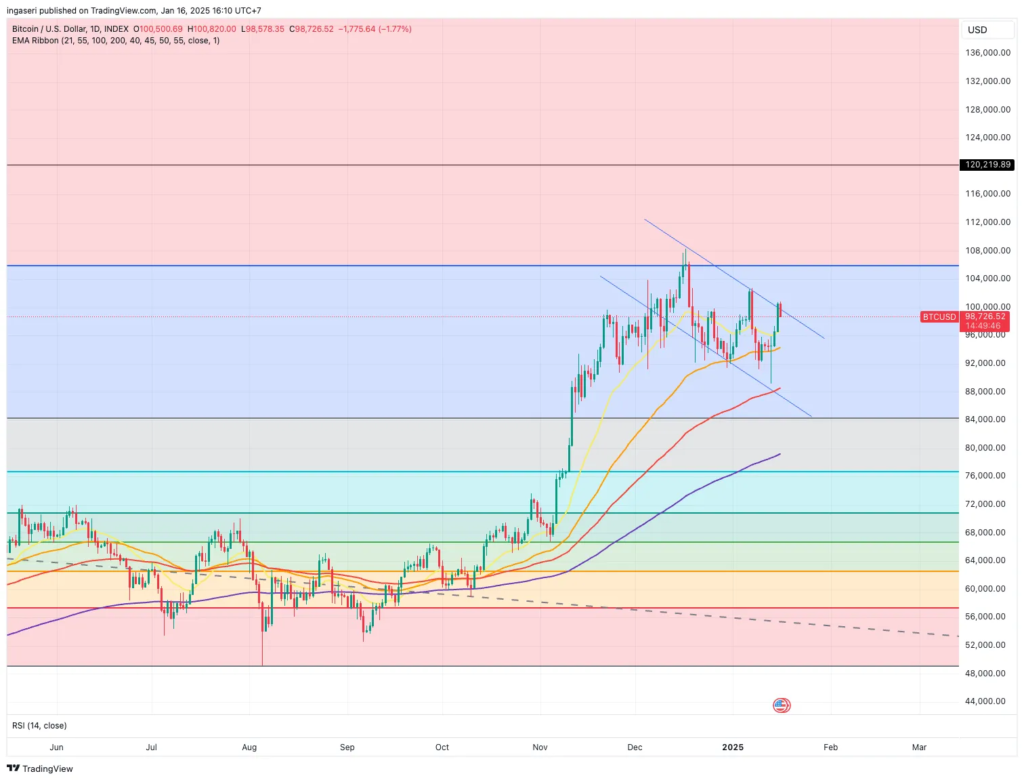
- 📝 BTC’s price found support and began a fresh recovery above $100k this week. BTC/USD climbed past the $99,500 and $95,500 levels, entering a short-term bullish zone.
- 💼 The economy added 2.23 million jobs during President Joe Biden’s final year in office, averaging 186,000 jobs per month. While below the 3 million jobs added in 2023, this aligns with the growth pace seen in 2018.
- 🏭 U.S. producer prices recorded a modest increase in December, with the PPI for final demand rising 0.2% MoM, falling short of market expectations of 0.3%.
- 🟢 The Consumer Price Index (CPI) rose by a seasonally adjusted 0.4% month-over-month (MoM), bringing the annual inflation rate to 2.9%, aligning with forecasts.
- 📉 The core CPI annual rate came in at 3.2%, a slight decline from the previous month and marginally below the expected 3.3%.
Macroeconomic Analysis
Unemployment Rate
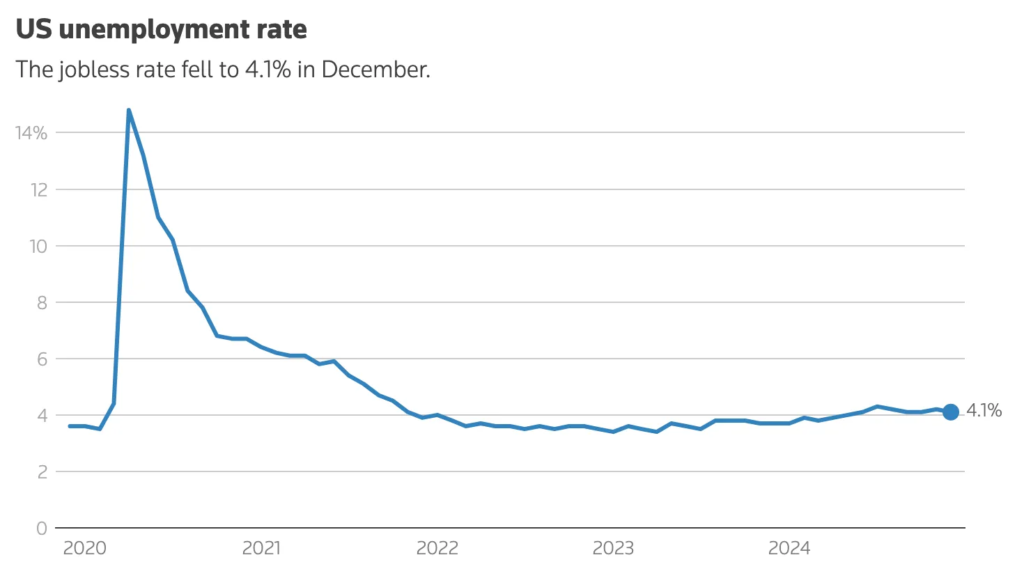
U.S. job growth unexpectedly surged in December, while the unemployment rate declined to 4.1%, signaling a robust end to the year for the labor market. This performance reinforces expectations that the Fed will keep interest rates unchanged this month.
The Labor Department’s highly anticipated employment report, released Friday, also revealed a decline in the number of people permanently unemployed and a reduction in the median duration of unemployment. These metrics, which had previously raised concerns about labor market deterioration, provided further optimism. The strong report supports the Fed’s cautious stance on monetary easing, as concerns persist that President-elect Donald Trump’s proposed policies such as imposing higher tariffs and deporting undocumented immigrants, could elevate inflation risks.
Minutes from the Fed’s December 17-18 meeting, published earlier this week, highlighted these concerns, with participants agreeing to adopt a “careful approach” when considering further rate cuts. Economists anticipate no rate reductions in the first half of this year.
Key Highlights:
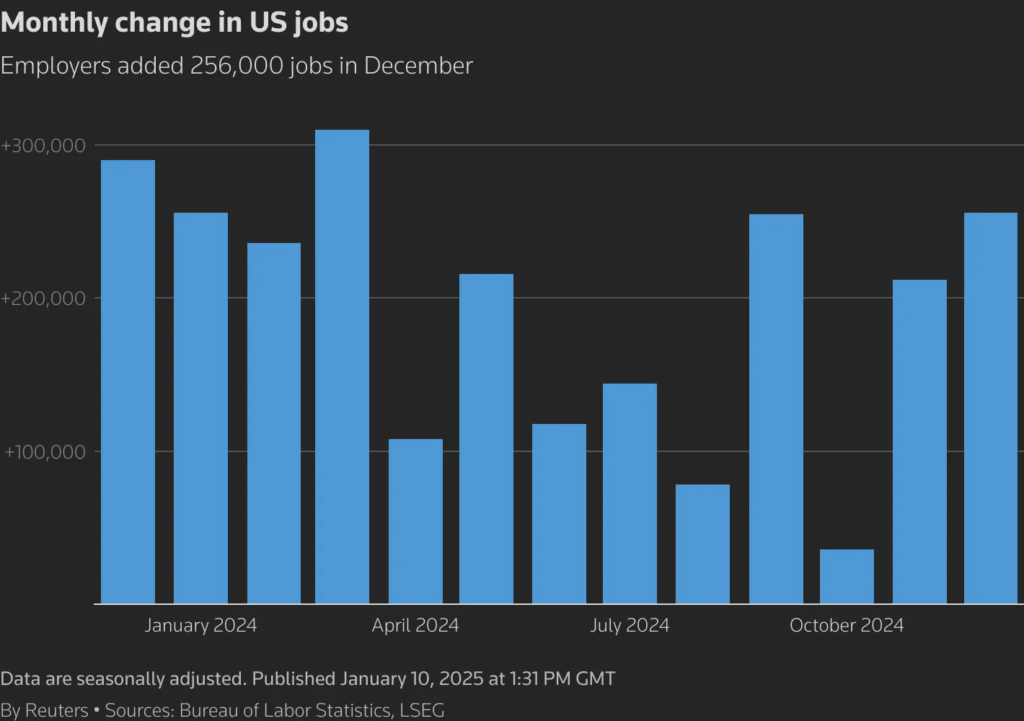
- Nonfarm Payrolls: Increased by 256,000 jobs in December, the highest gain since March.
- Revisions for October and November showed 8,000 fewer jobs than initially reported.
- Economists had forecast a gain of 160,000 jobs, with estimates ranging from 120,000 to 200,000.
2024 Job Gains: The economy added 2.23 million jobs during President Joe Biden’s final year in office, averaging 186,000 jobs per month. While below the 3 million jobs added in 2023, this aligns with the growth pace seen in 2018.
Sector-Specific Performance:
- Healthcare: Added 46,000 jobs, with gains across home healthcare services, nursing facilities, and hospitals.
- Retail: Rebounded with 43,000 new jobs, following a 29,000 decline in November, driven by hiring in clothing and general merchandise stores.
- Leisure and Hospitality: Increased by 43,000 jobs, including 29,800 in restaurants and bars.
- Government: Added 33,000 positions, contributing to the overall growth.
- Manufacturing: Lost 13,000 jobs, primarily in semiconductor and electronic component manufacturing.
- Mining and Logging: Also experienced job losses.
Economic Context: Despite the Fed’s aggressive rate hikes in 2022 and 2023, the labor market has shown resilience, supported by historically low layoffs and rising wages. This strength has bolstered consumer spending and sustained economic growth, which is currently exceeding the Fed’s estimated non-inflationary rate of 1.8%.
December’s job growth extended beyond non-cyclical industries, with gains in retail, leisure, and hospitality partially attributed to a late Thanksgiving holiday.
The U.S. labor market’s performance in December highlights its ability to withstand external pressures, even as certain sectors, such as manufacturing, face challenges. Looking ahead, the report provides optimism for continued economic momentum under new leadership.
Financial markets largely anticipate that the Fed will keep its benchmark overnight interest rate steady in the 4.25%-4.50% range during its meeting on January 28-29, according to the CME’s FedWatch tool. Since initiating its easing cycle in September, the Fed has reduced its policy rate by 100 basis points.
Last month, the Fed projected only two quarter-point rate cuts for this year, a reduction from the four cuts forecasted in September. This adjustment reflects the economy’s resilience and persistently high inflation. The policy rate had been increased by a total of 5.25 percentage points throughout 2022 and 2023.
In response to the data, stocks on Wall Street declined, the dollar strengthened against a basket of currencies, and yields on longer-term U.S. Treasury securities rose to their highest levels since November 2023.
Wage Growth and Labor Market Metrics:
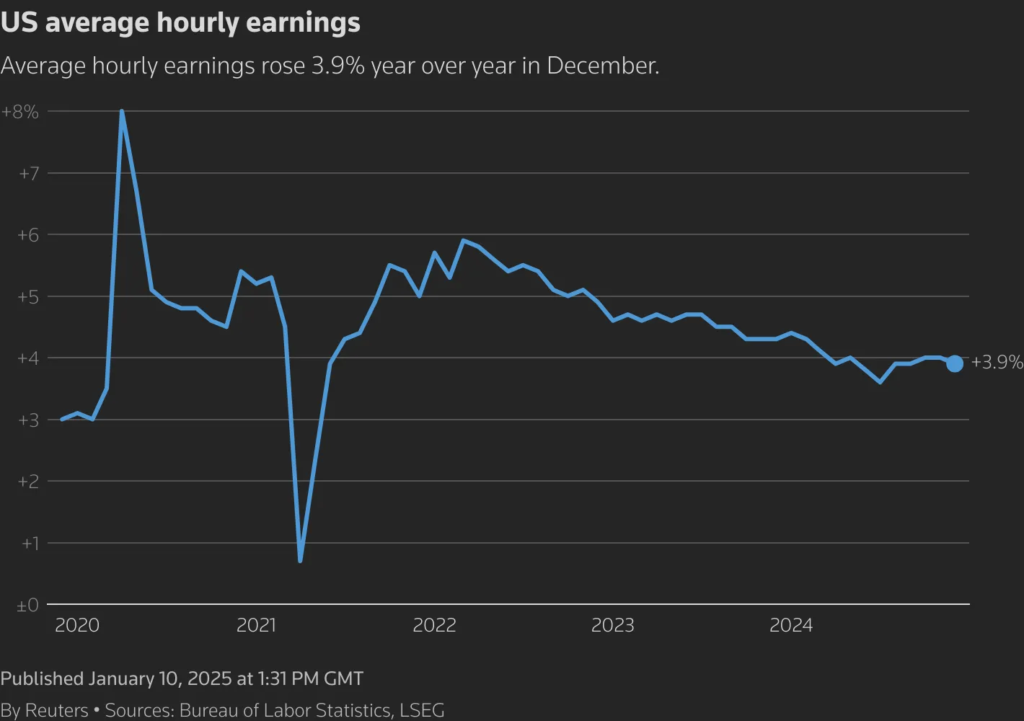
- Average hourly earnings rose 0.3% in December, following a 0.4% increase in November. Over the year, wages advanced 3.9%, slightly below the 4.0% gain recorded in November.
- The average workweek remained unchanged at 34.3 hours.
- Aggregate earnings increased 0.4%, while labor income grew at a seasonally adjusted annualized rate of 5.9% in the fourth quarter, the fastest pace since Q3 2023.
“This robust growth in nominal labor income, which is outpacing inflation, should continue to support consumer spending,” noted Michael Gapen, Chief U.S. Economist at Morgan Stanley.
Unemployment and Labor Market Dynamics:
- The unemployment rate fell to 4.1% in December, down from 4.2% in November. The jobless rate averaged 4.0% in 2024, compared to 3.6% in 2023.
- The government also issued revisions to seasonally adjusted household survey data from the past five years. While these revisions had minimal impact on the unemployment rate, the spike to 4.3% in July, which prompted the Fed’s substantial rate cut in September, was revised down to 4.2%.
- Household employment increased by 478,000 jobs in December, closing a gap with payroll employment figures. While household employment is considered volatile, this gain reflects ongoing labor market strength.
Labor force participation remained steady at 62.5% for the third consecutive month, even as 243,000 individuals entered the workforce. The employment-to-population ratio rose to 60.0%, up from 59.8% in November, highlighting improvements in the economy’s ability to generate jobs.
The number of people permanently losing jobs fell by 164,000, bringing the total to 1.7 million. The median duration of unemployment also declined to 10.4 weeks, reversing a rising trend that peaked at a near three-year high of 10.5 weeks in November.
Other Economic Indicators
- Michigan Consumer Sentiment: Consumer sentiment remained largely unchanged at the start of the year, according to the preliminary January report of the Michigan Consumer Sentiment Index. The index recorded a slight decline of 0.8 points (-1.1%), falling to 74.0 from December’s final reading. This figure came in slightly below the forecasted 74.0.
- PPI: U.S. producer prices recorded a modest increase in December, with the PPI for final demand rising 0.2% month-over-month (MoM), falling short of market expectations of 0.3%. The uptick was largely driven by a 0.6% MoM increase in goods prices, including a sharp 3.5% rise in energy costs. In contrast, prices for services remained unchanged. Excluding the more volatile components of food and energy, core PPI showed no change for the month, missing the expected 0.2% MoM increase.
- CPI: Consumer prices rose modestly in December, closing out 2024 with signs of easing inflation. The Consumer Price Index (CPI) increased by 0.4% month-over-month (MoM), bringing the annual inflation rate to 2.9%, in line with expectations. Economists had forecast MoM growth of 0.3% and an annual rate of 2.9%. Excluding volatile components like food and energy, core CPI rose 0.2% MoM, slightly below the expected 0.3%. On an annual basis, core CPI was up 3.2%, marginally lower than the forecasted 3.3%, and down from 3.9% a year ago.
BTC Price Analysis
BTC’s price found support and began a fresh recovery above $92,000 this week. BTC/USD climbed past the $92,500 and $93,500 levels, entering a short-term bullish zone.
On the 4-hour chart, the price broke out of a declining channel, overcoming resistance at $94,800. It also surpassed the 50% Fibonacci retracement level of the downward move from the $102,718 swing high to the $89,108 low.
BTC further cleared the 100 simple moving average (red, 4-hour) and tested the 200 simple moving average (green, 4-hour) but faced resistance near the $97,500 level. The 61.8% Fibonacci retracement level of the same downward move also acted as a key resistance.
To the upside, BTC may face resistance at $97,500, with the next major hurdle at $100,000. A decisive close above $100,000 could trigger another steady increase, potentially driving the price toward $102,500.
On the downside, immediate support lies near $95,850, followed by a key support level at $94,300. A break below $94,300 could push the price toward $92,500, with further losses potentially testing the $90,000 support zone.
On-Chain Analysis
- 📊 Exchange: As the exchange reserve continues to rise, it indicates higher selling pressure. Net deposits on exchanges are high compared to the 7-day average. Higher deposits can be interpreted as higher selling pressure.
- 💻 Miners: Miners’ are selling more holdings compared to its one-year average. Miner’s revenue is in a moderate range, compared to its one-year average.
- ⛓️ On-chain: More investors are selling at a profit. In the middle of a bull market, it can indicate a market top. Long term holders’ movement in the last 7days was lower than the average. They have a motive to hold their coins. Investors are in a Belief phase where they are currently in a state of high unrealized profits.
- 🏦 Derivative: Long position traders are dominant and are willing to pay to short traders. Selling sentiment is dominent in the derivatives market. More sell orders are filled by takers. As OI decreases, it indicates investors are closing futures positions and possibility of trend reversals. In turn, this might trigger the possibility of long/short-squeeze caused by sudden price movement or vice versa.
- 🔀 Technicals: RSI indicates a neutral condition. Stochastic indicates a neutral condition where the current price is in a moderate location between the highest-lowest range of the last 2 weeks.
News About Altcoins
- Trump Considers “America First” Strategic Crypto Reserve, Boosting Solana and XRP. Solana (SOL) and XRP outperformed the broader crypto market on Thursday (January 17) amid reports that President-elect Donald Trump is considering establishing a national strategic crypto reserve called “America First.” According to a report by the New York Post, Trump is reportedly open to the idea, involving assets like Solana, XRP, and the stablecoin USDC, all developed by blockchain projects based in the United States. Trump recently met with Ripple CEO Brad Garlinghouse, as well as the founders of Solana and Circle (the issuer of USDC). Circle also contributed $1 million worth of USDC to Trump’s inauguration committee.
News from the Crypto World in the Past Week
- $TRUMP Memecoin Shakes the Crypto Market, Reaching a $20 Billion Market Cap! Donald Trump launched a memecoin called $TRUMP through his Truth Social account, instantly drawing massive attention from the crypto industry. Within the first two hours, the value of $TRUMP skyrocketed by over 4,200%, reaching a market cap of $7.7 billion and eventually $14.5 billion, with a trading volume of $1 billion. One trader who purchased nearly 6 million $TRUMP for $1.1 million in USDC gained over $20 million in just 90 seconds.
Cryptocurrencies Market Price Over the Past Week
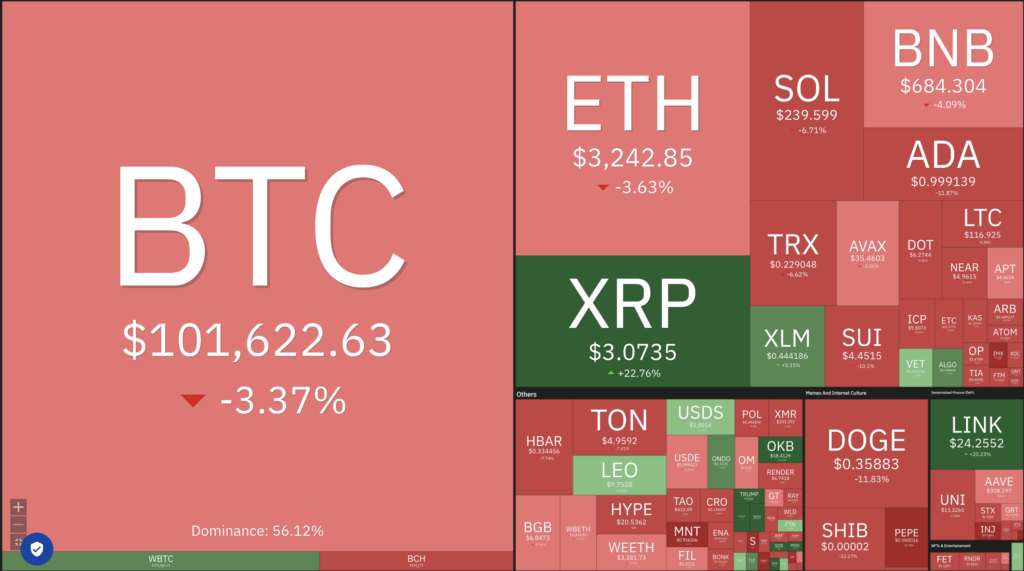
Cryptocurrencies With the Best Performance
- Raydium (RAY) +32.02%
- Solana (SOL) +29.34%
- Chainlink (LINK) +19.62%
- XRP (XRP) +18.12%
Cryptocurrencies With the Worst Performance
- Sonic (S) -24.72%
- Mantle (MNT) -17.72%
- Movement (MOVE) -15.57%
- FLOKI (FLOKI) -14.59%
References
- Dailyhodl, XRP and Solana Surge in Price Amid Rumors Trump Is Considering ‘America First’ Crypto Reserve: Report, accessed on 18 January 2025.
- Nikhil Pandey, Donald Trump’s $TRUMP Meme Coin Takes Crypto World By Storm With $14.5 Billion Market Capitalisation, ndtv, accessed on 18 January 2025.