
Over the week, Bitcoin (BTC) has been moving sideways, trading between $29,500 and $31,500, as it struggles to maintain its value above the psychological $30,000 level. In the absence of any driving factor for positive market sentiment, can BTC continue its rally? Read the full analysis below.
The Pintu trading team has gathered critical information and analyzed the general economic situation and the crypto market’s movements over the past week. However, it should be noted that all information in this Market Analysis is intended for educational purposes, not as financial advice.
- 📉 The University of Michigan’s Consumer Sentiment Index shows a rebound, rising to 64.4, exceeding the initial forecast of 63.9. However, consumers still anticipate a 3.3% annual inflation rate over the next year.
- 📈 US companies recorded significant job growth, with the construction, trade, transportation, and other service industries witnessing an increase. However, the number of unemployment benefit claims last week rose by 12,000 to a total of 248,000.
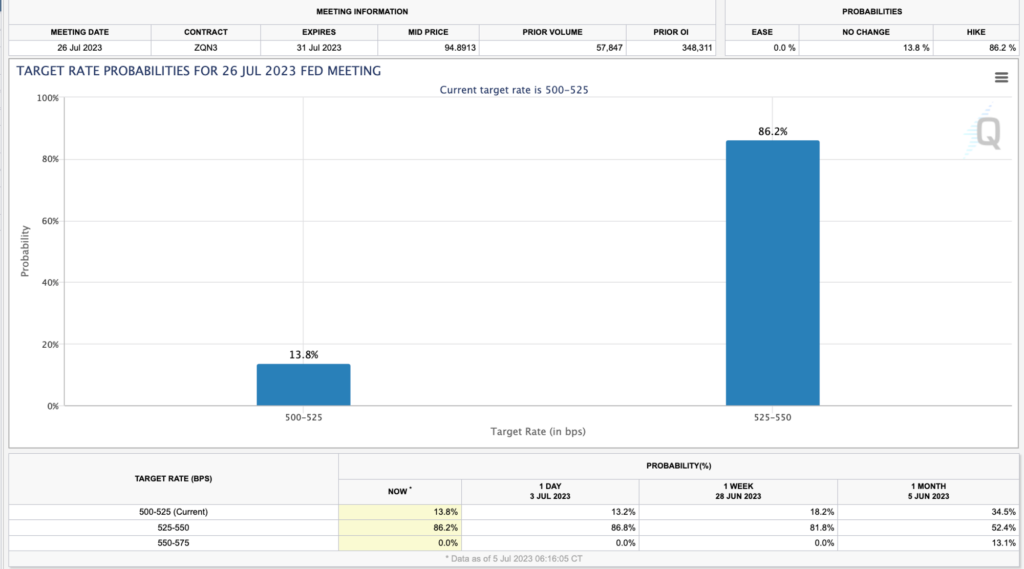
- 🔴 According to the CME Group, 86% of traders believe The Fed will approve a quarter-point interest rate hike at the upcoming meeting in July.
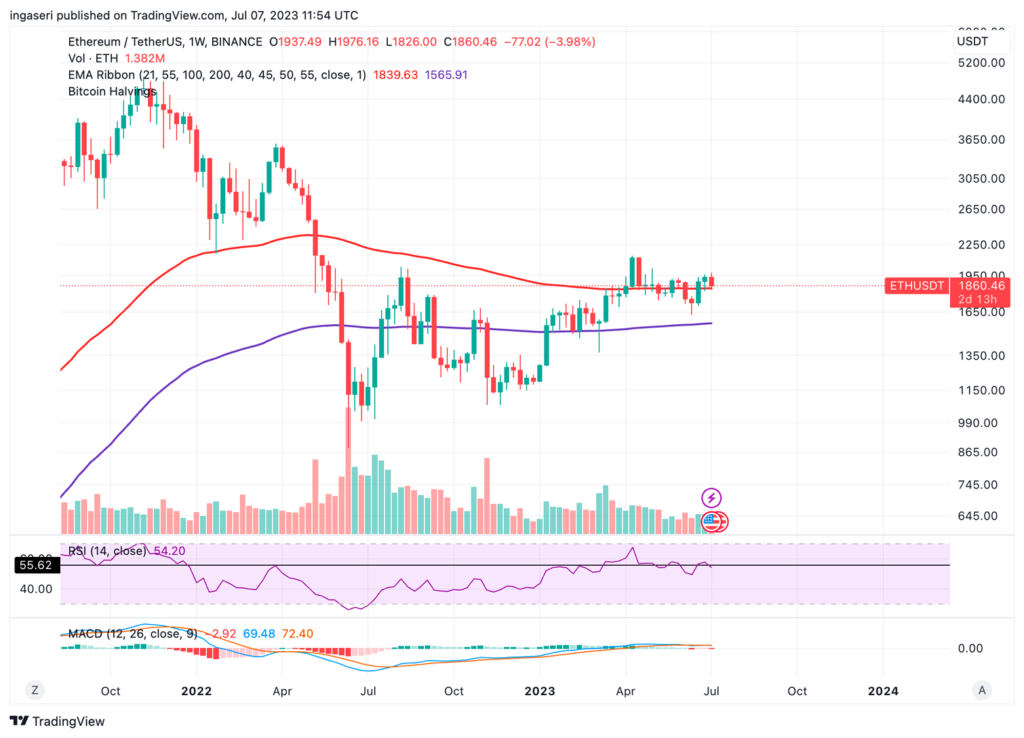
- ✍🏻 The performance of Bitcoin (BTC) and Ethereum (ETH) has shown volatility, with BTC moving sideways between $29,500 and $31,500 throughout the week, and ETH entering a consolidation phase after a rally that reached resistance levels at $2,000.
Macroeconomic Analysis
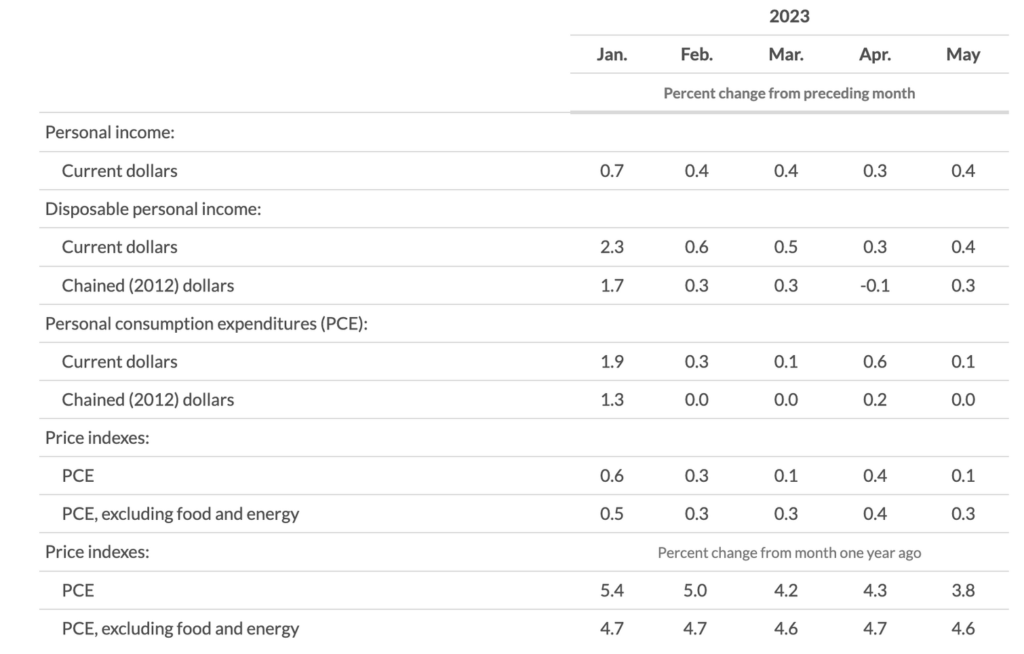
A report released last week by the U.S. Department of Commerce showed that inflationary pressures eased slightly in May due to a significant decline in consumer spending.
According to the latest data released by the Bureau of Economic Analysis, personal income increased by $91.2 billion (0.4% on a monthly basis) in May. Disposable personal income (DPI), which refers to personal income after personal taxes, increased $86.7 billion (0.4%).
In addition, personal consumption expenditures (PCE) increased $18.9 billion (0.1%), while excluding food and energy, the index increased 0.3%. The real DPI, which takes into account the effects of inflation, increased 0.3% in May.
Real PCE, which also takes inflation into account, decreased slightly less than 0.1%. Looking at specific categories, goods decreased by 0.4%, while services increased by 0.2%.
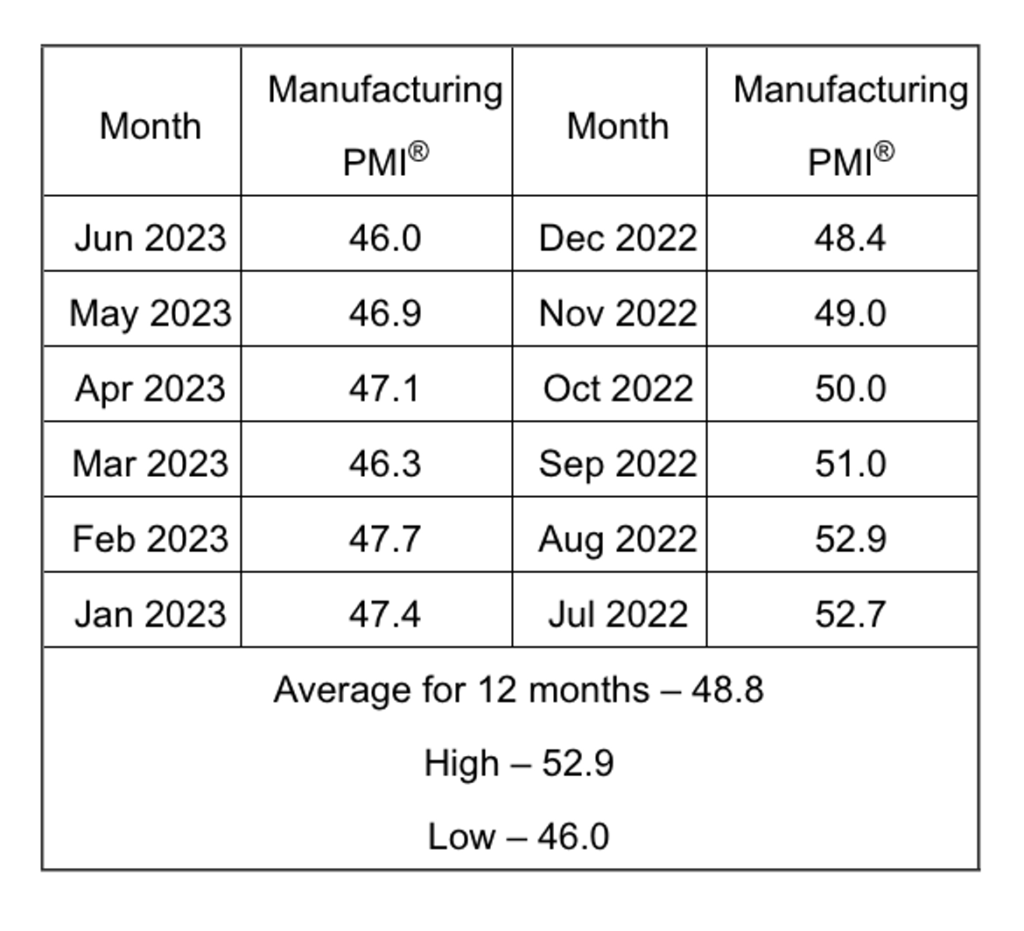
The U.S. manufacturing sector has contracted for eight consecutive months. The latest data from the ISM Manufacturing PMI showed a decline from 46.9 in May to 46. This figure is lower than the market consensus of 47.2 and reflects a negative outlook.
Economic contraction is characterized by falling demand, which leads to production slowdowns due to insufficient workloads. Then there’s the potential imbalance between supply and demand. Finally, there are signs of downsizing.
71% of the manufacturing sector experienced contraction in June, down slightly from 76% in May. However, a larger percentage of industries experienced significant contraction, with 44% of manufacturing GDP recording composite PMI calculations at or below 45%, which serves as a reliable indicator of an overall weakening in manufacturing.
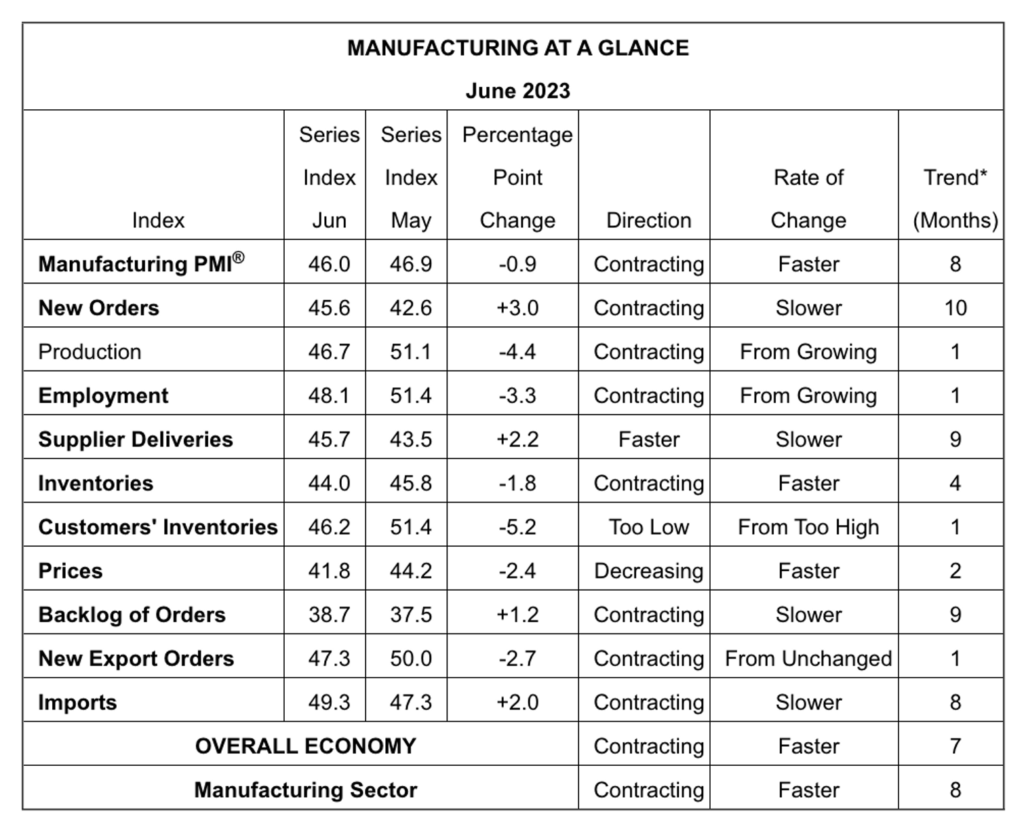
The equipment and transportation sectors were resilient to economic contraction in June, with both showing growth. According to the data, none of the ten sub-indices reached a level above 50 percent during this period, indicating contraction.
Historically, a Manufacturing PMI above 48.7% for an extended period of time indicates expansion in the overall economy. Therefore, the Manufacturing PMI of 46% in June indicates that the overall economy has contracted for seven consecutive months. Based on the relationship between the Manufacturing PMI and the overall economy, the June reading of 46% is equivalent to an estimated 1% annual decline in real gross domestic product (GDP).
According to the final reading released last week, the University of Michigan’s consumer sentiment index rose to 64.4, above the initial reading of 63.9. This indicates a rebound from May’s decline.
Consumers continued to expect prices to rise at an annual rate of 3.3% over the next year. The data showed that consumers expect cost increases of 3% over the next five to ten years.
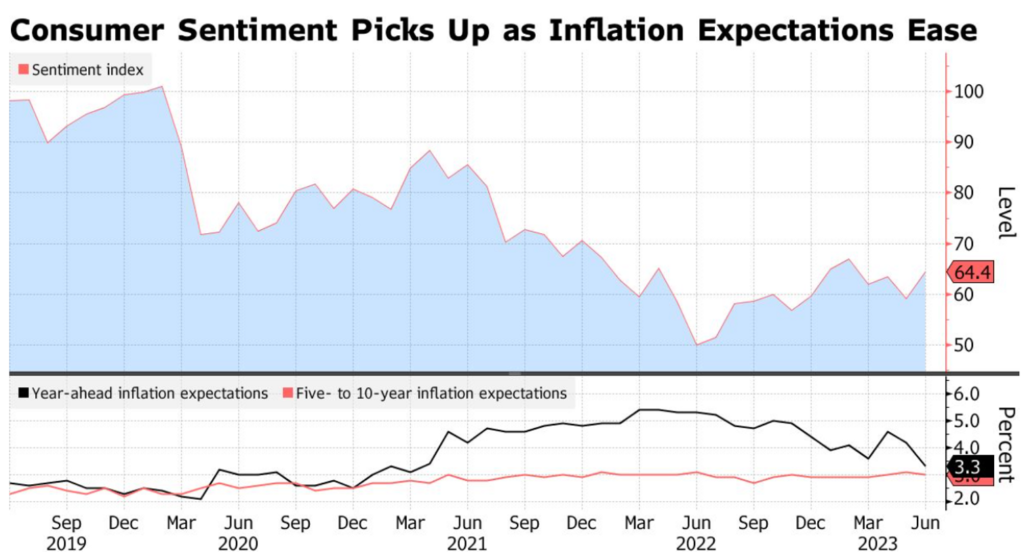
The report shows a significant decrease in uncertainty about short- and long-term inflation expectations. Very few consumers expect extremely high or low inflation in the future.
However, traders are currently pricing in about an 86% chance that the Fed will approve a quarter-point hike at its July meeting, according to CME Group calculations.
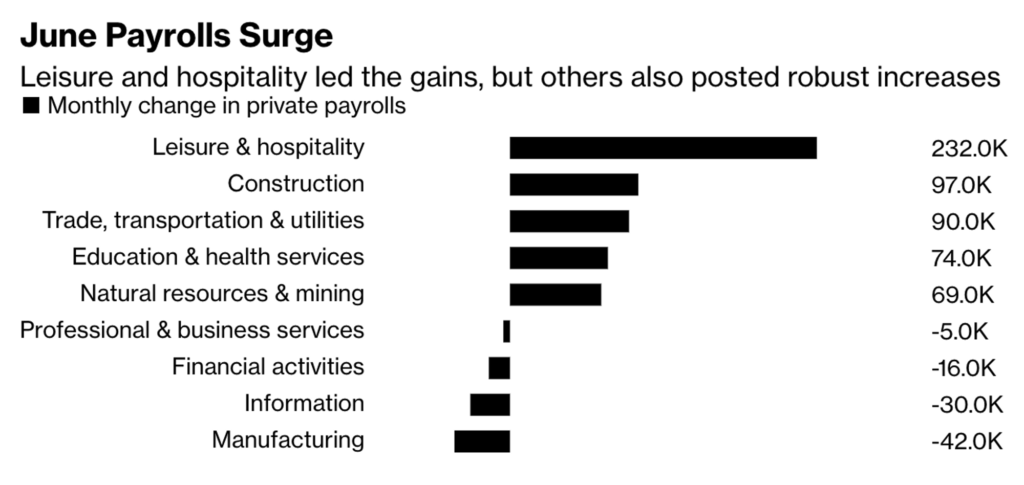
U.S. companies added significant jobs, with private payrolls surging by 487,000 from the previous month. This surge surpassed the highest level recorded in February 2022, demonstrating the resilience of the labor market.
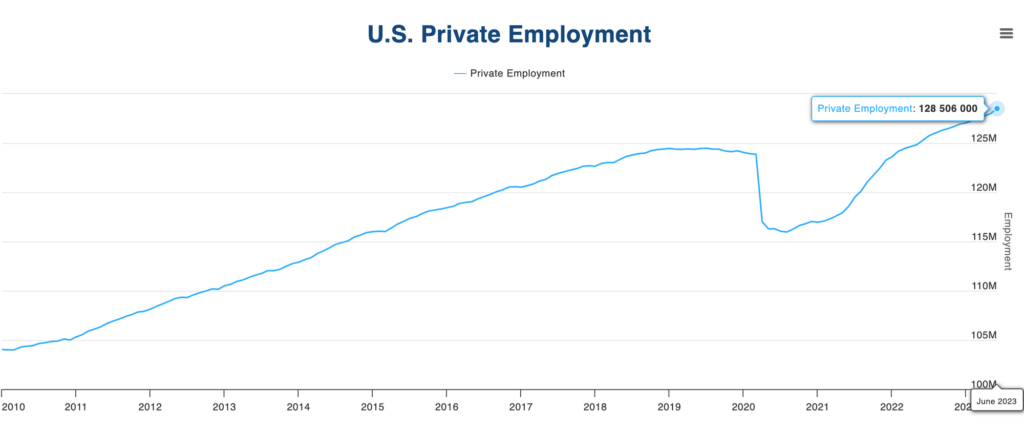
Significant job growth has been seen in sectors such as construction, trade, transportation, and other services. However, the most significant job growth has been in the leisure and hospitality sector.
Despite an increase in job openings, initial claims for unemployment benefits rose by 12,000 last week to a total of 248,000. However, continuing claims fell to 1.7 million, the lowest level in four months.
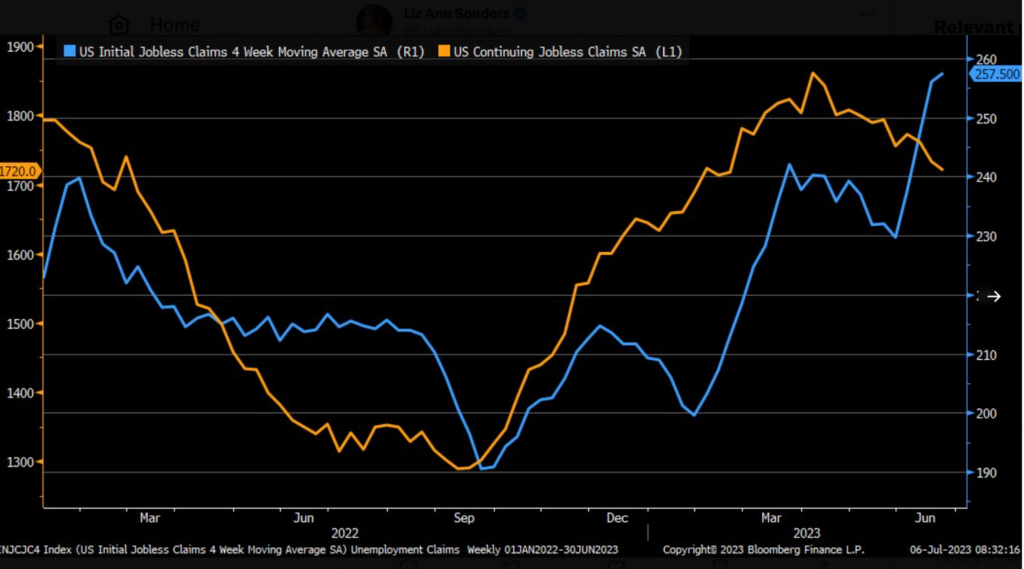
However, given the growth in hiring in various sectors and the relatively low level of jobless claims, the US labor market is showing resilience.
S&P Global reported that the U.S. services sector PMI for June came in at 54.4, slightly higher than the expected 54.1.
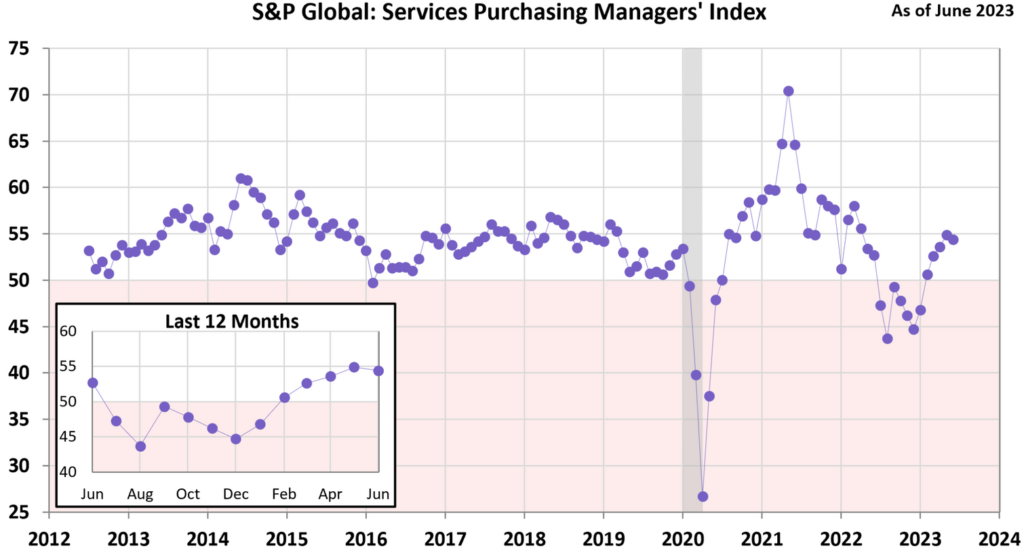
The upturn in the US services sector suggests robust resilience. Some surveys suggest that GDP growth will be below 2% in the second quarter. The Institute of Supply Management (ISM) released its services PMI for June. The composite index for the sector came in at 53.9, above the forecast of 51.0. This latest reading suggests that the index has remained in expansion territory for six consecutive months.
Despite the challenges posed by the rising cost of living and higher interest rates, demand for services remains strong. In particular, consumer spending has been boosted by the post-pandemic recovery. In addition, rising interest rates and recent market strength have boosted demand for certain financial services.
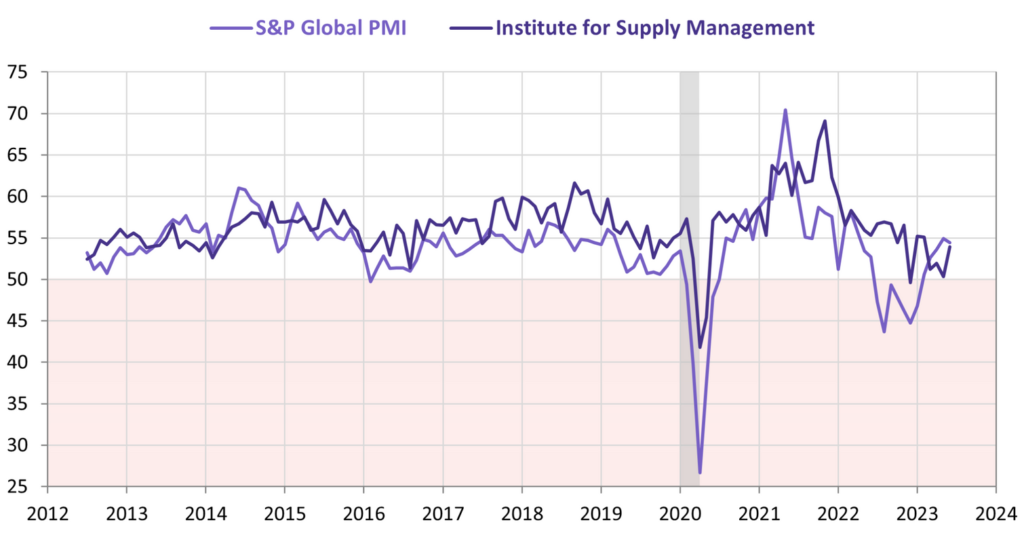
Here’s a comparison of the ISM and S&P PMI surveys. Historically, the ISM measure has been much more volatile than the other measures.
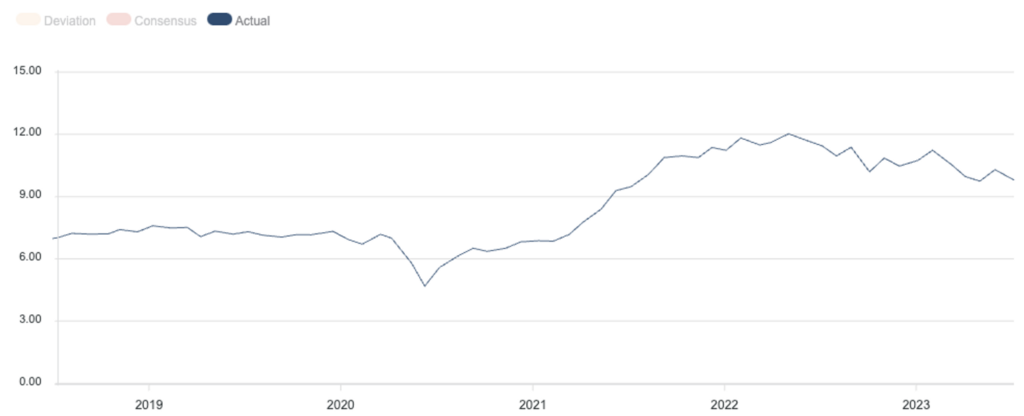
According to the latest report from the Bureau of Labor Statistics’ Job Openings and Labor Turnover Survey, the number of job openings in the United States declined in May after increasing slightly the previous month.
At the end of May, job openings fell to 9.82 million from an upwardly revised 10.3 million in April. This figure is below economists’ forecast of 9.935 million for May, according to Refinitiv. May’s JOLTS data also showed that hiring increased to 6.21 million from 6.1 million, while quits increased to 4.02 million from 3.77 million. On the other hand, layoffs fell to 1.56 million from 1.59 million.
The Fed continues to monitor the labor market for signs of slack. If there is an imbalance between the supply and demand of labor, it will lead to rising wages and potentially push inflation higher.
BTC & ETH Price Analysis
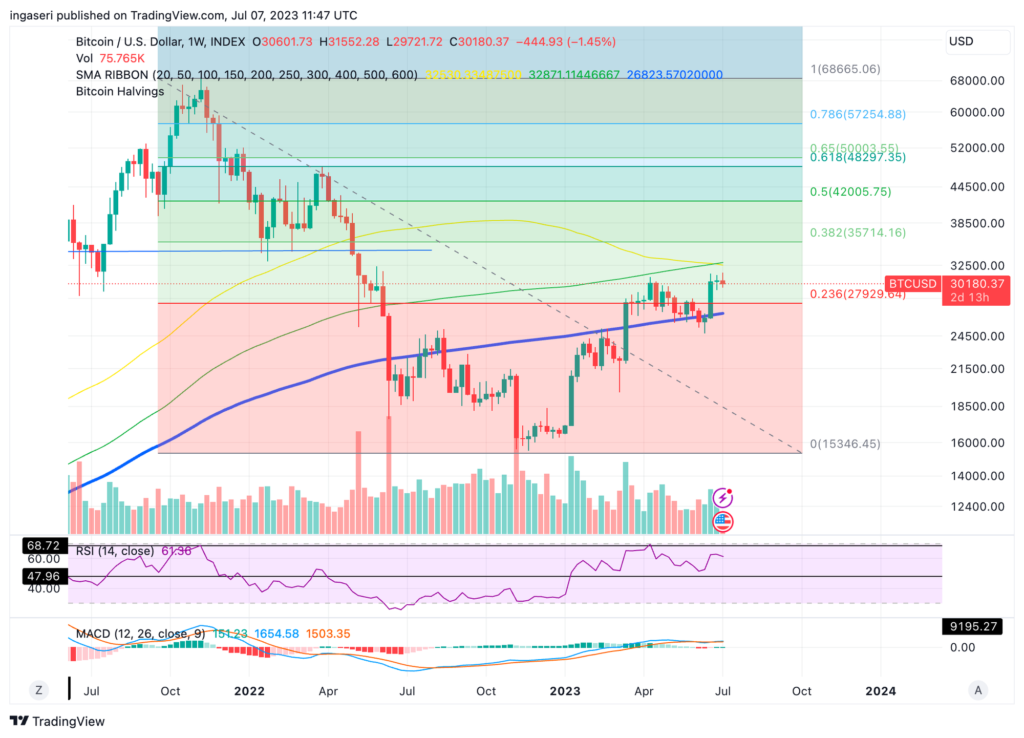
Over the past week, BTC has been moving sideways, fluctuating between $29,500 and $31,500 throughout the week. BTC is still struggling to stay above the psychological price of $30,000. Last week’s volatility led to several large liquidations. On Friday, 46,662 traders liquidated a total of $140.07 million. Currently, BTC has resistance at $32,500 and support at the 0.236 Fibonacci retracement at $28,000.
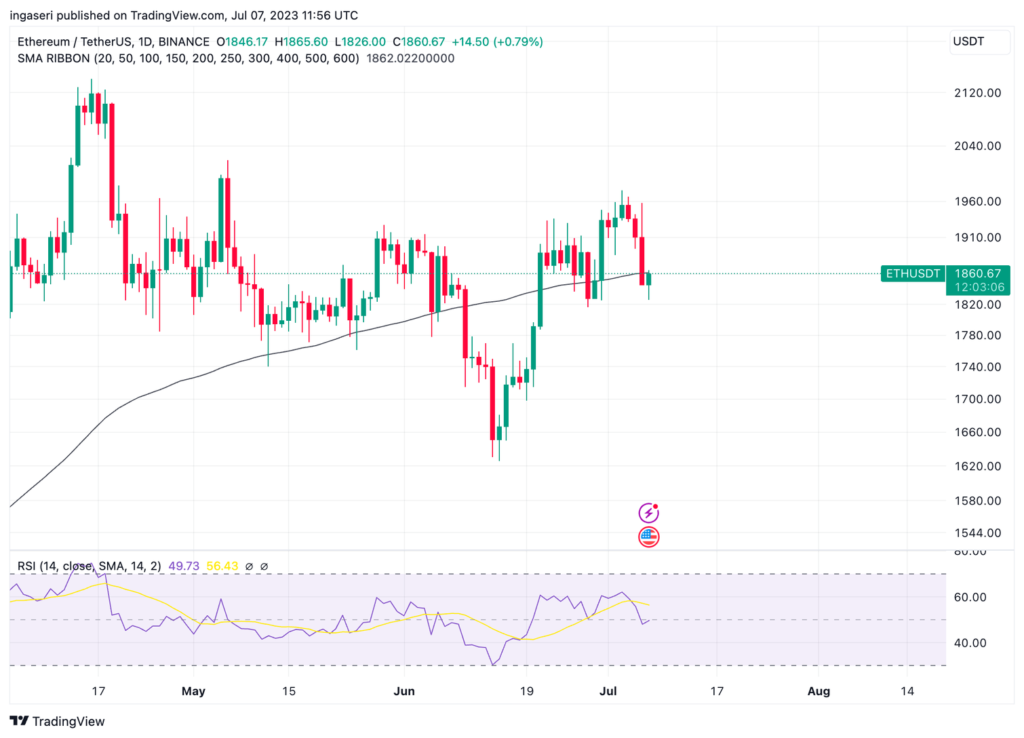
In the case of ETH, after a period of rising above the 100-day moving average (MA) and a subsequent pullback, the price of ETH began to rally, reaching key resistance levels at $2,000. However, the current price has entered a temporary pause, leading to a period of consolidation around key resistance levels. ETH’s support is at $1,850 while resistance remains at the psychological $2,000 level.
On-Chain Analysis
- 📊 Exchange: As the exchange reserve continues to rise, it indicates higher selling pressure. Net deposits on exchanges are low compared to the 7-day average. Lower deposits can be interpreted as lower selling pressure.
- 💻 Miners: Miners’ are selling more holdings compared to its one-year average. Miner’s revenue is in a moderate range, compared to its one-year average.
- 🔗 On-Chain: More investors are selling at a profit. In the middle of a bull market, it can indicate a market top. Investors are in a Anxiety phase where they are currently in a state of moderate unrealized profits.
- 🏦 Derivatives: Long position traders are dominant and are willing to pay to short traders. Buying sentiment is dominant in the derivatives market. More buy orders are filled by takers. As open interest decreases, it indicates investors are closing futures positions and possibility of trend reversals. In turn, this might trigger the possibility of long/short-squeeze caused by sudden price movement or vice versa.
- 🔀 Technicals: RSI indicates a neutral condition. Stochastic indicates a neutral condition where the current price is in a moderate location between the highest-lowest range of the last 2 weeks.
News About Altcoins
- Arbitrum has approved an upgrade proposal (AIP 1.1) to lock 700 million ARB tokens, worth $770 million. These funds will be gradually deposited into the Arbitrum Foundation over a period of four years. The original proposal, which directly allocated over 700 million ARB tokens to the Arbitrum Foundation, was rejected by the community. The Arbitrum Foundation stated that these funds will be used to support Arbitrum technology development initiatives.
- Blur V2 has announced two major updates. First, there is a 50% reduction in gas fees for transactions, increasing efficiency. Second, the introduction of “Trait Bidding” allows users to bid on collections such as Punks, Degods, Milady’s, and others to earn extra points. In addition, based on current gas fees, each NFT purchase on Blur v2 will save up to $16 in costs.
News from the Crypto World in the Past Week
- BlackRock CEO Larry Fink expressed his desire to work with regulators regarding concerns about a spot bitcoin ETF application. Larry believes in bitcoin’s potential to serve as “digital gold,” although he does not personally own bitcoin. He has stated that he wants to democratize crypto and make it more accessible to investors, as well as reduce the broad costs of buying and selling cryptocurrency.
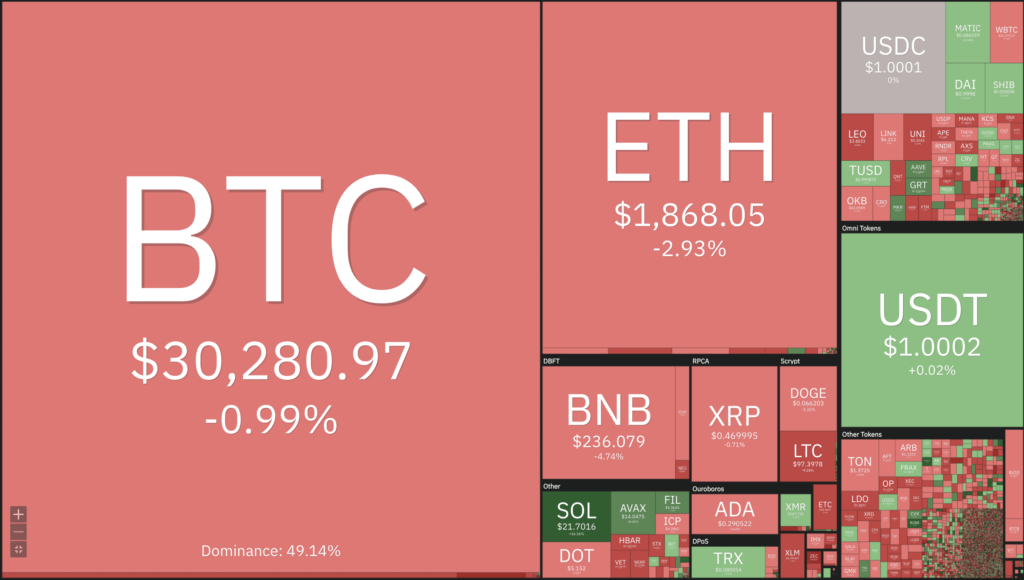
Cryptocurrencies Market Price Over the Past Week
Cryptocurrencies With the Best Performance
- Avalanche (AVAX) +7.97%
- Near Protocol (NEAR) +2.59%
- Fantom (FTM) +2.42%
- Injective Protocol (INJ) +2.30%
Cryptocurrencies With the Worst Performance
- Compound (COMP) -5.67%
- Maker (MKR) -2.99%
- Uniswap (UNI) -2.89%
- BitDao (BIT) -2.88%
References
- Vishal Chawla, Arbitrum DAO locks up $770 million in ARB tokens into vesting contract, Theblock, accessed on 9 July 2023.
- Adewale Olarinde, Will Blur V2 be the undoing to OpenSea’s dominance?, Ambcrypto, accessed on 9 July 2023.
- Nathan Crooks, BlackRock CEO Larry Fink sees bitcoin as ‘digitizing gold’, Theblock, accessed on 9 July 2023.