
In last week’s market analysis, the PINTU Trader team wrote that Bitcoin (BTC) could reach $115,000 in July. It turns out that this prediction was exceeded, with BTC hitting a new all-time high (ATH) of $120,000. Various indicators and fundamentals also show bullish market conditions, which means BTC could continue to rise in price this July. Read the full analysis from Pintu’s Trader Team in the article below.
Market Analysis Summary
- 🟢 While the current sentiment is largely bullish, with derivatives positioning skewed towards calls over puts, a decisive move above the $112,000 resistance is needed for BTC to enter a full “price discovery” phase towards higher targets like $136,000.
- 💪🏻 The S&P Global US Services PMI for June 2025 registered at 52.9, a slight dip from May’s 53.7, but still firmly in expansion territory.
- 📈 The ISM Services PMI for June 2025 showed a return to expansion, climbing to 50.8 from May’s contractionary reading of 49.9.
- 🗣️ FOMC minutes shows a clear split among Federal Reserve officials regarding the timing and necessity of interest rate cuts, reflecting the ongoing debate about the balance between managing persistent inflation and supporting economic growth.
Macroeconomic Analysis
S&P Global and ISM Services PMI
The latest Purchasing Managers’ Index (PMI) reports for the U.S. services sector in June 2025, from both S&P Global and the Institute for Supply Management (ISM), present a cautiously optimistic yet complex picture. While both indicate continued expansion, the nuances within each report highlight persistent challenges, particularly related to inflationary pressures stemming from tariffs and a mixed outlook on employment.
The S&P Global US Services PMI for June 2025 registered at 52.9, a slight dip from May’s 53.7, but still firmly in expansion territory (a reading above 50 indicates growth). This marks the 29th consecutive month of growth for the services sector, a significant driver of the U.S. economy. The report indicated sustained business activity driven primarily by domestic demand. However, a crucial detail was the continued contraction in export orders for the third consecutive month, largely attributed to tariff and trade policy uncertainties. This implies that while the domestic economy is providing some tailwind, international headwinds are preventing a stronger overall surge. Furthermore, input costs remained elevated, with firms reporting higher supplier prices and wage expenses, largely due to tariffs, although the rate of increase eased slightly from May’s peak.
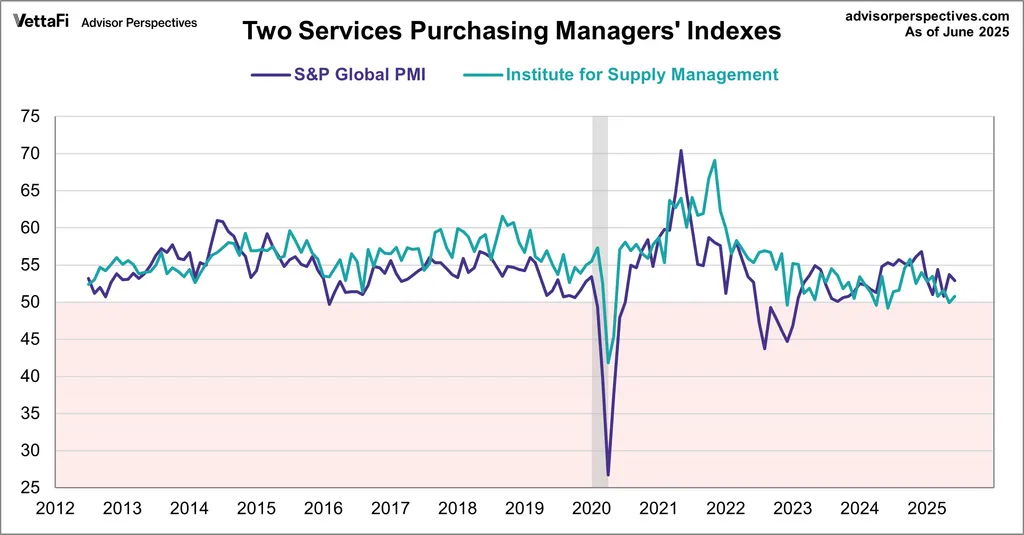
In parallel, the ISM Services PMI for June 2025 showed a return to expansion, climbing to 50.8 from May’s contractionary reading of 49.9. This was a welcome rebound, suggesting that the services sector’s brief dip into contraction was temporary. The report highlighted a notable improvement in Business Activity (54.2) and New Orders (51.3), both moving back into expansion. This indicates renewed demand and a pick-up in operational tempo within the service sector. However, a key area of concern from the ISM report was the Employment Index, which slipped back into contraction at 47.2, marking its third contraction in four months. This suggests that while business activity is growing, service providers are showing hesitancy in hiring or are experiencing a faster pace of departures than new hires, perhaps due to economic uncertainty or a focus on efficiency.
The combined message from these two influential reports is that the U.S. services sector continues to grow, underpinning overall economic expansion. The S&P Global data points to sustained activity but with cautious sentiment regarding exports and persistent cost pressures. The ISM report confirms a return to growth, particularly in new orders and business activity, but raises a red flag regarding employment trends. Both surveys frequently cited tariffs and broader economic uncertainty as significant factors impacting costs and future outlook.
For financial markets and the Federal Reserve, these reports offer a complex input. The continued expansion in services provides a buffer against concerns of a broader economic slowdown, potentially supporting the Fed’s “higher for longer” or “wait and see” stance on interest rates, especially given the ongoing inflation from tariffs. However, the signs of softening employment in the ISM report and the subdued business confidence (as highlighted by S&P Global) could argue for greater caution from the Fed if the labor market trends continue to weaken, potentially nudging them towards a rate cut later in the year. The diverging signals emphasize the delicate balance policymakers must strike between managing inflation and sustaining economic growth amidst evolving trade and macroeconomic conditions.
Other Economic Indicators
- FOMC Minutes: The latest FOMC minutes, released on July 9, 2025, provided a detailed look into the discussions and varying viewpoints among policymakers during their June 17-18 meeting. The key takeaway from these minutes is a clear split among Federal Reserve officials regarding the timing and necessity of interest rate cuts, reflecting the ongoing debate about the balance between managing persistent inflation and supporting economic growth. While the Committee ultimately opted to keep the federal funds rate unchanged at 4.25% – 4.50% at the June meeting, the minutes shed light on the diverging paths individual members foresee for monetary policy. A significant point of discussion revealed in the minutes was that “a couple” of policymakers indicated they would be open to considering a reduction in the target range for the policy rate as soon as the next meeting (July 30th), provided that incoming economic data aligned with their expectations for slowing inflation
BTC Price Analysis
Over the past week, from July 3rd to July 11th, 2025, BTC has continued its strong performance, pushing to new all-time highs and demonstrating significant resilience in the face of various market dynamics. After oscillating around the $105,000 to $109,600 range in the earlier part of the week, BTC made a decisive move, climbing close to the $112,000 mark on Wednesday, July 11th, even briefly touching a new peak of $118,780. This robust upward movement has been a key characteristic of BTC’s price action this week, cementing its position as a top-performing asset in 2025 with over 18% gains year-to-date.
BTC Technical Analysis
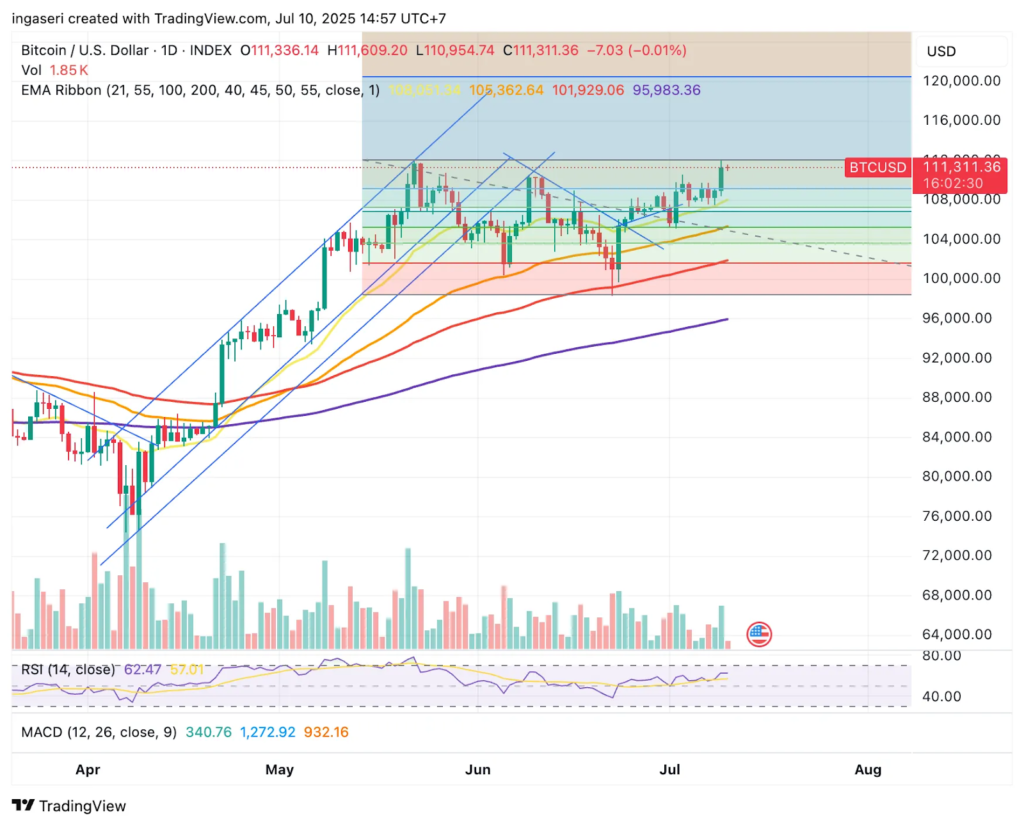
Technically, BTC has shown a firmly bullish short-to-long-term outlook. It has successfully broken through key resistance levels, notably at $107,710 and $109,000, signaling further potential for appreciation. The price has remained well above its 200-day Simple Moving Average (SMA) near $96,000, confirming a strong long-term uptrend. While the Relative Strength Index (RSI) has been in a neutral range around 58 for much of the week, its rising trend supports the overall positive momentum. However, some hourly charts on July 10th showed long upper shadows on candlesticks and KDJ indicators forming a converging dead cross at high levels, suggesting a potential for high-level fluctuations and a technical correction in the very short term.
Several fundamental factors have fueled this recent surge. Strong institutional demand has been a primary driver, with BlackRock’s spot BTC ETF (IBIT) surpassing 700,000 BTC in assets and continuing to see significant net inflows. Corporate treasuries, like MicroStrategy and Japanese firm Metaplanet, have also continued to add substantial amounts of BTC to their holdings. This growing institutional conviction, seeing BTC as a “macro asset” and a potential hedge against inflation, particularly amid expectations of “stagflation,” is crucial. Furthermore, the recent U.S. Federal Reserve’s June FOMC meeting minutes, which signaled support for at least one interest rate cut in 2025, sparked a “risk-on” mood in global markets, benefiting assets like BTC that thrive under easier monetary conditions and a weakening U.S. dollar.
Looking ahead, the market remains keenly focused on upcoming economic data, particularly the U.S. inflation data due on July 11th, and the Federal Reserve’s next policy decision. While the current sentiment is largely bullish, with derivatives positioning skewed towards calls over puts, a decisive move above the $112,000 resistance is needed for BTC to enter a full “price discovery” phase towards higher targets like $120,000 or more. The ongoing narrative of tightening supply (exchange reserves at 14.5% of total supply, lowest since 2018) and maturing demand, coupled with positive political rhetoric from the Trump administration regarding digital assets, continues to set a favorable stage for BTC’s performance in the second half of 2025.
Altcoin Analysis
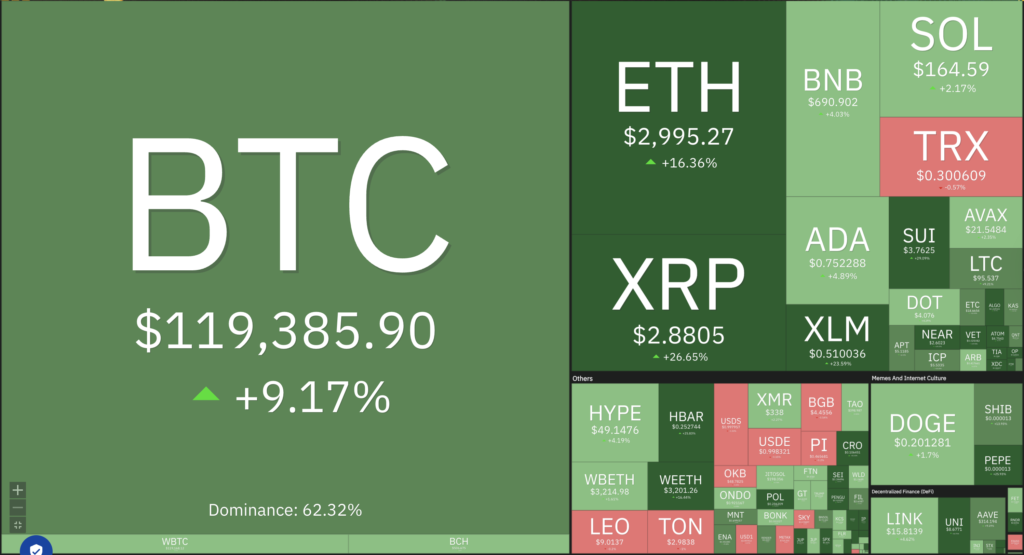
The broader cryptocurrency market, excluding BTC, has experienced a mixed but generally positive week from July 3rd to July 10th, 2025. While BTC’s continued rally to new all-time highs has certainly drawn attention, altcoins have shown varying degrees of participation in this “risk-on” environment. Overall, the market continues to maintain a bullish trend, largely driven by increasing institutional investment and a stabilizing global political climate.
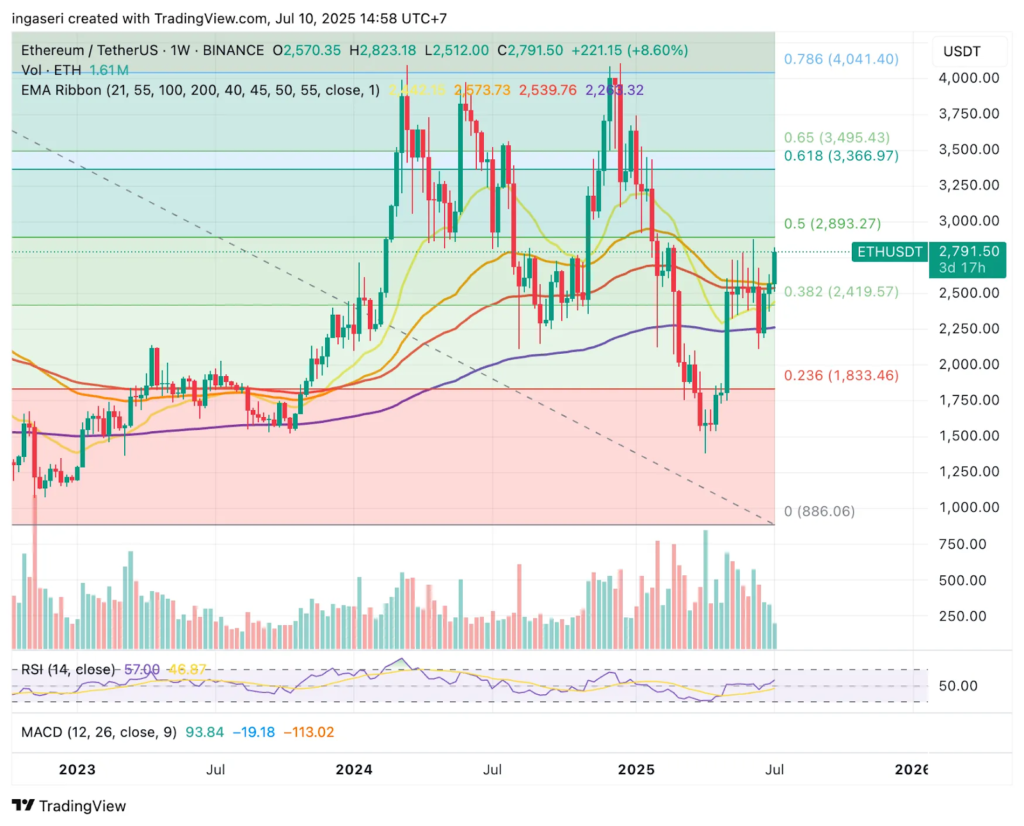
ETH as the largest altcoin by market capitalization, has demonstrated notable strength. After oscillating between roughly $2,400 and $2,600 earlier in the week, ETH staged a swift recovery, climbing above its 200-day moving average near $2,530. By July 9th, ETH was trading around $2,615 and continued its upward trajectory, with some reports showing it touching $2,816.73 by July 10th. This performance reflects growing bullish momentum, with ETH breaking out of a multi-week consolidation range. Key insights suggest that ETH is trading above its major EMAs, and its RSI is trending higher but remains below the overbought threshold, indicating room for further growth. The increasing institutional interest, partly due to the approval of ETH-based Exchange-Traded Funds (ETFs), is a significant catalyst for its price appreciation.
Beyond ETH, other major altcoins have exhibited diverse performances. SOL has also been a standout, experiencing a significant surge with a weekly gain of almost 6% to trade around $150. Its price has shown resilience, with daily closes mostly above $150 and even touching $157.28 on July 9th. Institutional interest in Solana is notably strong, evidenced by the launch of a SOL-based ETF staking product that has seen substantial trading volume. Furthermore, rising network activity, with Total Value Locked (TVL) in its ecosystem increasing and active addresses growing to 3.3 million, underscores the growing confidence and utility within the Solana network. Some technical analyses even point to a price fractal pattern similar to a previous rally, hinting at further upside potential.
However, it’s important to note that while some major altcoins have performed well, the broader altcoin market, particularly smaller-cap tokens, continues to face challenges. BTC’s dominance remains high, and as observed in previous cycles, a significant “altseason” where capital widely flows from BTC into a broad range of altcoins typically requires BTC dominance to decline below 60%. While there have been “short bursts of altcoin price pumps,” a sustained, broad-based alt-season like those seen in earlier cycles is becoming less likely due to the sheer number of cryptocurrencies (over 37 million as of July 2025). This oversupply often leads to diminished returns and higher risks for many smaller projects. Nonetheless, the overall market sentiment remains positive, with institutional adoption and the anticipation of potentially looser monetary policy acting as tailwinds for the more established altcoins.
On-Chain Analysis

News About Altcoins
- Aave Leads DeFi Growth with $25.4B TVL and Rising Market Dominance. Decentralized lending protocol Aave has surged ahead of the broader DeFi market, with its total value locked (TVL) rising over 52% to $25.4 billion by the end of Q2 2025, outpacing the overall DeFi TVL growth of 26%. Aave now commands 48% of the DeFi lending market and nearly 23% of total DeFi TVL. Key growth drivers include the launch of its native stablecoin GHO, cross-chain integrations, rising institutional interest, and upcoming innovations like the Aave V4 upgrade and Horizon initiative for real-world assets. While new competitors such as Spark, Morpho, and Venus are emerging, Aave remains the dominant and most trusted player in the lending space amid a broader flight to quality across Web3.
News from the Crypto World in the Past Week
- Jerome Powell Reportedly Considers Resigning as Bitcoin Hits New High. Federal Reserve Chair Jerome Powell is reportedly considering resigning, according to William Pulte, Chairman of the Board at Fannie Mae and Freddie Mac, who welcomed the possibility as a positive step for the U.S. economy. This comes amid ongoing pressure from former President Donald Trump, who has repeatedly demanded interest rate cuts and criticized Powell’s leadership. As speculation grows, the crypto market is soaring, with Bitcoin hitting a new all-time high of $118,856 on July 11. Trump credited his tariff policies for the crypto surge and again urged the Fed to lower rates. Despite the rumors, a Fed spokesperson stated that Powell intends to serve his full term.
Cryptocurrencies Market Price Over the Past Week
Cryptocurrencies With the Best Performance
- Stellar (XLM) +102%
- MOg Coin (MOG) +95.29%
- Pudgy Penguins (PENGU) +89.41%
- Hedera (HBAR) +57.33%
Cryptocurrencies With the Worst Performance
- UNUS SED LEO (LEO) -0.10%
References
- Jona Jaupi, Aave Outperforms DeFi Sector with 52% TVL Surge in Q2, thedefiant, accessed on 12 July 2025.
- Anand Shina, Fed Chair Jerome Powell reportedly considers resigning, William Pulte hints, thestreet, accessed on 12 July 2025.