
The world was shocked by the events experienced by US Presidential Candidate Donald Trump during a campaign in Milwaukee, where Trump’s ear was injured by a bullet. Surprisingly, this event had a positive impact on the price of Bitcoin (BTC), which returned to $60,000. However, will the Trump effect continue to positively influence crypto market movements going forward? Check out the analysis below.
As usual, the Pintu trading team has gathered critical information and analyzed the general economic situation and the crypto market’s movements over the past week. However, it should be noted that all information in this Market Analysis is intended for educational purposes, not as financial advice.
Market Analysis Summary
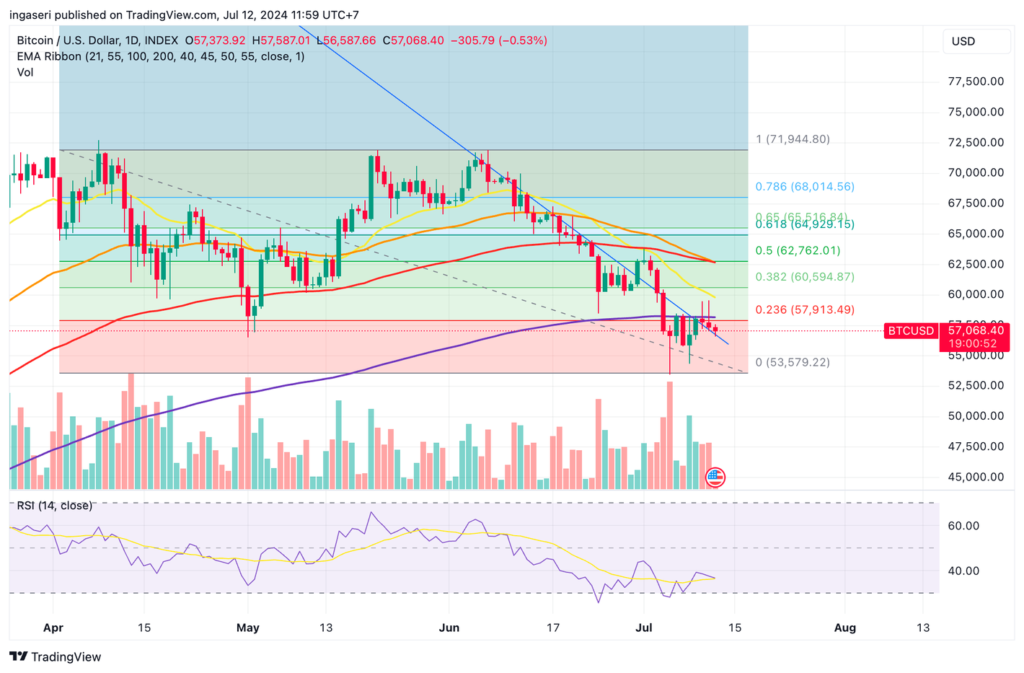
- 📝 BTC is still below the combined resistance of the 200-day Exponential Moving Average (EMA) and the 0.236 Fibonacci retracement level.
- 🟢 Financial markets anticipate that the United States (US) central bank will start cutting interest rates in September. Traders currently see about a 77% chance of a rate cut at the Fed’s September 17-18 meeting.
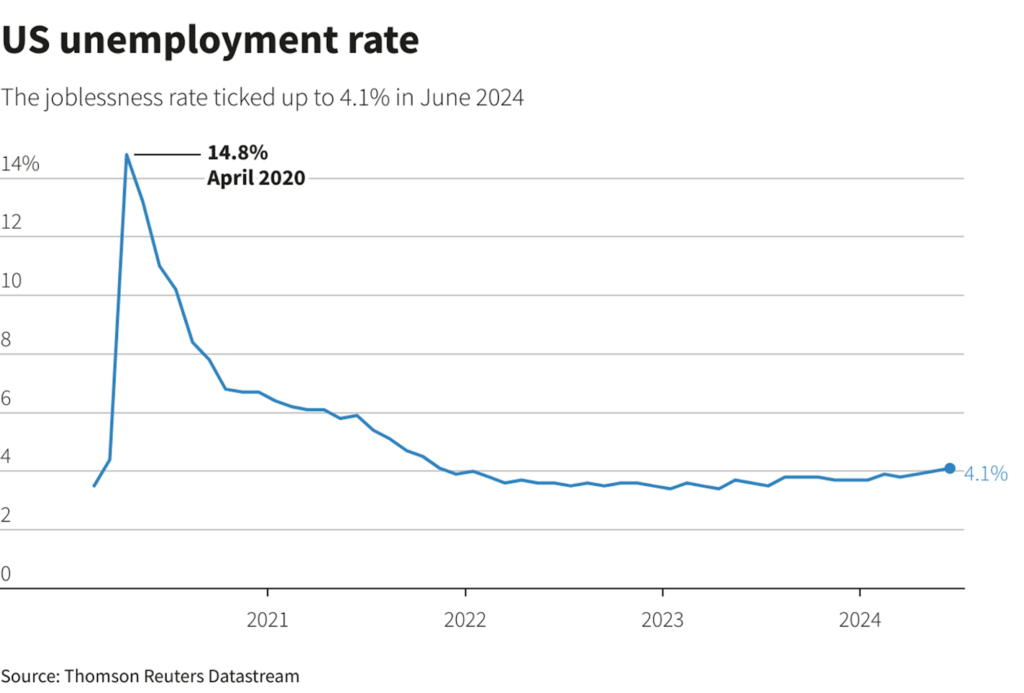
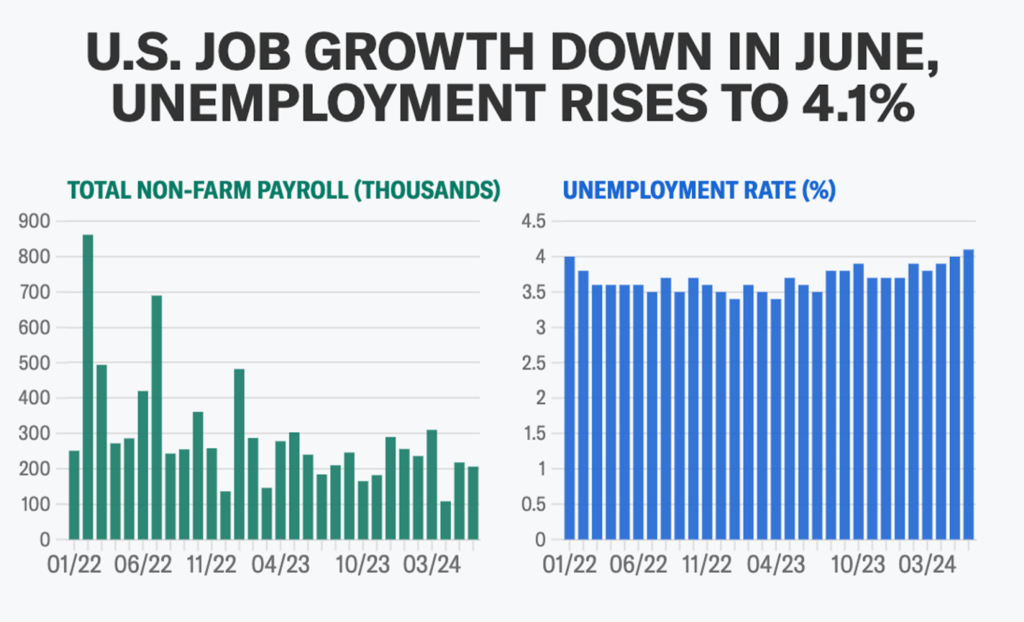
- 📈 The unemployment rate edged up to 4.1% from 4.0% with annual wage growth slowing to the lowest level in three years.
Macroeconomic Analysis
Unemployment Rate
U.S. employment saw a robust increase in June, with hiring in government and healthcare services accounting for roughly 75% of the total payroll gains. However, the unemployment rate rose to a 2.5-year high of 4.1%, indicating a softening labor market that could prompt the Fed to consider lowering interest rates soon.
The Labor Department’s highly anticipated report on Friday also revealed that the economy generated 111,000 fewer jobs in April and May than initially estimated, highlighting a decelerating trend in payroll growth.
Annual wage growth slowed to its lowest rate in three years, reflecting an expanding labor pool and adding to the growing concerns in the job market. Approximately 277,000 individuals entered the workforce, contributing to the increase in the unemployment rate from 4.0% in May to its highest level since November 2021.
Coupled with the moderation in prices in May, this report could reinforce Fed policymakers’ confidence in the inflation outlook, following disruptions to the disinflationary trend in the first quarter. Financial markets anticipate that the U.S. central bank, which implemented aggressive monetary policy tightening in 2022 and 2023, may begin easing rates by September.
Other Economic Indicators
- Nonfarm Payrolls: Nonfarm payrolls increased by 206,000 in June, fueled by government hiring. This surpassed economists’ expectations of 190,000 jobs, with the unemployment rate holding steady at 4.0%. Job growth averaged 222,000 per month in the first half of the year. Sectors like healthcare and government led the gains. Private payrolls grew by 136,000, though manufacturing and retail saw declines. Despite a rise in long-term unemployment and temporary job losses, wage growth slowed to 3.9% year-over-year.
- Core Inflation Rate: The core Consumer Price Index (CPI) rose by only 0.1% in June, lower than economists’ expectations, while the overall CPI dipped 0.1% due to declines in gasoline and energy costs. This lower inflation rate increases the chances of the Federal Reserve cutting interest rates by September, with futures pricing in at least two cuts by year’s end.
- Initial Jobless Claim: The latest jobless claims data shows initial claims at 222,000, lower than the expected 236,000, with the previous week’s claims revised slightly up to 239,000. The 4-week moving average of initial claims decreased to 233,500 from 238,750. Continuing claims fell to 1.852 million, below the forecast of 1.860 million, and the prior week’s continuing claims were revised down to 1.856 million. The 4-week moving average for continuing claims rose to 1.840 million from 1.831 million. This comes amid mixed signals in the labor market, where some sectors show resilience while others face challenges.
BTC Price Analysis
BTC has remained below its 200-day EMA for eight consecutive days, struggling to surpass the resistance level over the past two days. Despite attempts to break through, it continues to face significant selling pressure, keeping the price under the combined resistance of the 200-day EMA and the 0.236 Fibonacci retracement level.
Long-term Bitcoin holders are demonstrating significant resilience during the most substantial correction of the current BTC price cycle. Additionally, concerns are growing among miners, as they face a hashrate capitulation phase that mirrors the bear market bottom seen in late 2022.
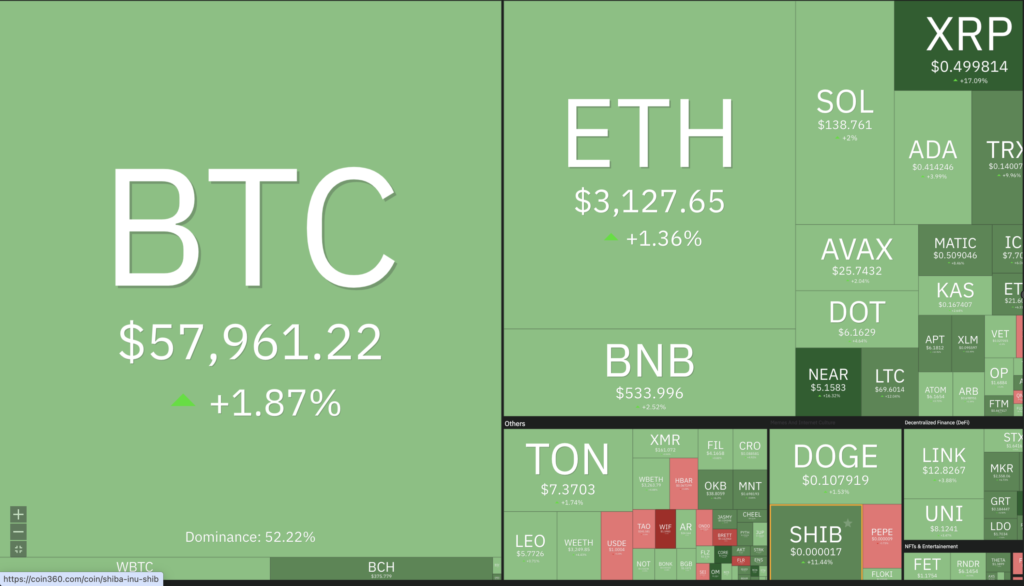
💡 The price of BTC surged past $60,000 after the shooting incident involving US Presidential Candidate Donald Trump. As of Monday (15/7) at 09:36 AM, the price of BTC is close to $62,000, reaching $62,149.
On-Chain Analysis
- 📊 Exchange: As the exchange reserve continues to fall, it indicates lower selling pressure. Net deposits on exchanges are high compared to the 7-day average. Higher deposits can be interpreted as higher selling pressure.
- 💻 Miners: Miners’ are selling holdings in a moderate range compared to its one-year average.Miner’s revenue is in a moderate range, compared to its one-year average.
- 🔗 On-Chain: More investors are selling at a loss. In the middle of a bear market, it can indicate a market bottom. Long-term holders’ movement in the last 7 days was lower than the average. They have a motive to hold their coins. Investors are in an anxiety phase where they are currently in a state of moderate unrealized profits.
- 🏦 Derivatives: Long-position traders are dominant and are willing to pay to short traders. Selling sentiment is dominant in the derivatives market. More sell orders are filled by takers. As open interest decreases, it indicates investors are closing futures positions and possibility of trend reversals. In turn, this might trigger the possibility of long/short-squeeze caused by sudden price movement or vice versa.
- 🔀 Technicals: RSI indicates a neutral condition. Stochastic indicates a neutral condition where the current price is in a moderate location between the highest-lowest range of the last 2 weeks.
News About Altcoins
- DOGS Meme Coin Airdrop. DOGS, a meme coin inspired by Telegram mascot Spotty and native to the platform, is offering a free airdrop. To claim, users must join the Dogs Bot Telegram Channel and verify their activity on Telegram. Users with longer activity will be awarded more DOGS tokens. The coin has gained massive popularity, boasting a community exceeding 3 million. Built on the TON blockchain, DOGS stands out with its unique clicker games and mini-apps. The token is expected to be listed on TON, suggesting potential future value growth. Users are encouraged to share the airdrop information to fuel broader community growth and token appreciation.
- Surge in TRUMP Token Price Following Trump Tragedy. Following the tragedy involving former President Donald Trump, the meme token associated with his name, maga (TRUMP), jumped over 40% against the U.S. dollar. The token experienced a wide intraday trading range, fluctuating between a low of $6.18 per coin and a 24-hour high of $9.68. At 8:30 p.m. EDT on Saturday, several hours after the incident, TRUMP was trading at $8.91 per coin. Trump owns 579,290 coins after the project’s creators airdropped the funds to him, with his stash now worth $5.25 million following a recent $1.6 million increase. By 8:44 p.m., TRUMP was up 33% at $8.35 per token. This development is expected to influence the 2024 election, where Trump will face incumbent President Joe Biden.
News from the Crypto World in the Past Week
- Germany’s Bitcoin Selloff and Market Impact. The German government has sold all its Bitcoin holdings, totaling approximately $2.9 billion, through a series of transactions completed in the past 24 hours. These holdings, initially comprising 50,000 BTC seized in January and valued at $2.8 billion, were tied to a 2013 case related to Movie2k.to. Their largest single-day sale of $900 million significantly impacted Bitcoin’s price, causing it to drop to a four-month low of just over $57,700. This selloff sparked market panic and a 15% price decline within 30 days. Despite this, market optimism persists, with expectations of a Bitcoin rebound supported by positive inflation data and the anticipated introduction of Ethereum ETFs.
Cryptocurrencies Market Price Over the Past Week
Cryptocurrencies With the Best Performance
- Notcoin (NOT) +50,61%
- MANTRA (OM) +32,71%
- Celestia (TIA) +30,46%
- Ronin (RON) +26,73%
Cryptocurrencies With the Worst Performance
- dogwifhat (WIF) -16,37%
- Flare (FLR) -5,71%
- Render (RNDR) -4,89%
- Quant (QNT) -2,34%
References
- WenJun, Get in the car quickly! DOGS free airdrops are now available, click to receive airdrops worth hundreds of dollars!, coinlive, accessed on 13 July 2024.
- Jaxon Gaines, German Government Sells off All Bitcoin Holdings, Totaling $2.9B, watcher.guru, accessed on 13 July 2024.
- Bitcoin.com, TRUMP Meme Coin Soars After Attack on Former US President, accessed on 14 July 2024.