
Bitcoin (BTC) has been quite dull throughout June 2024, dominated by bearish sentiment. However, this phase can actually be quite positive for investors who want to continue building their BTC portfolio. Technically, BTC still appears bearish and is in a consolidation phase. This suggests it could be the last consolidation phase before BTC resumes its bullish trend.
As usual, the Pintu trading team has gathered critical information and analyzed the general economic situation and the crypto market’s movements over the past week. However, it should be noted that all information in this Market Analysis is intended for educational purposes, not as financial advice.
Market Analysis Summary
- 🚨 BTC faces resistance at $62,650. It may drop further to around $58,200 and $56,500 before bullish momentum could potentially return.
- 📈 Business activity in the United States (US) reached a 26-month high, driven by a recovery in employment and easing price pressures.
- 🏠 Existing home sales declined, indicating reduced consumer confidence and spending. New home sales also fell, signaling potential challenges for the housing market and the broader economy.
Macroeconomic Analysis
S&P PMI
U.S. business activity reached its highest level in 26 months in June, driven by a recovery in employment, while price pressures eased significantly, suggesting that the recent decline in inflation may continue. According to S&P Global, the flash U.S. Composite PMI Output Index, which measures activity in both manufacturing and services, rose slightly to 54.6 in June. This is the highest reading since April 2022, up from 54.5 in May. An index reading above 50 indicates growth in the private sector, with both manufacturing and services sectors contributing to the increase in activity.
The flash services PMI increased to 55.1, a 26-month high, from 54.8 in May. That exceeded economists’ expectations for a reading of 53.7.
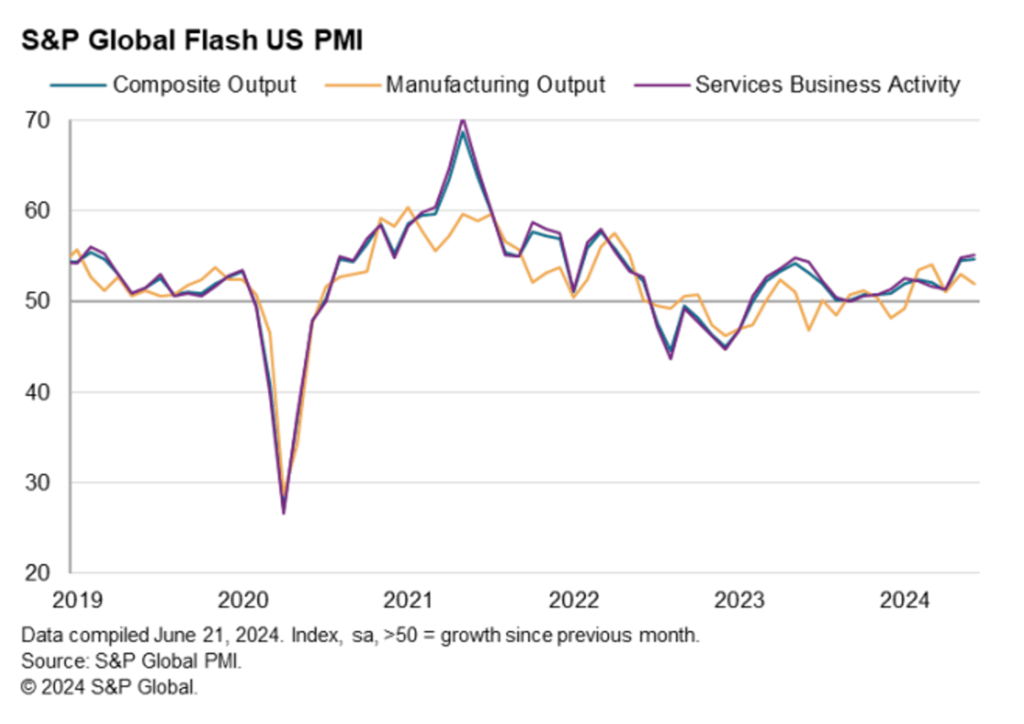
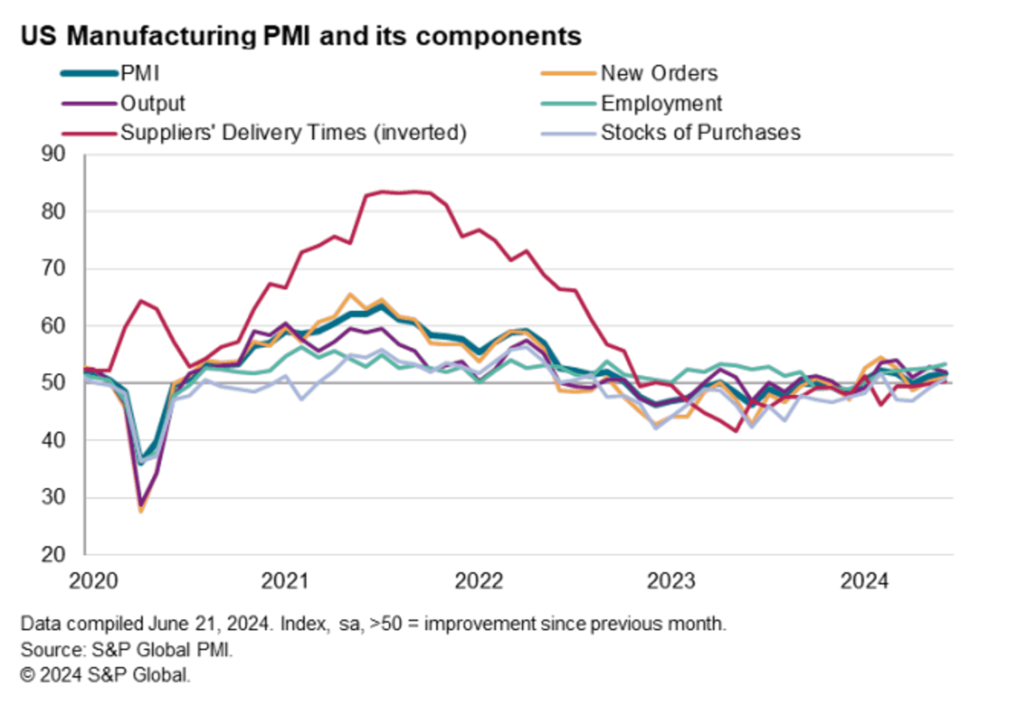
The S&P Global Flash US Manufacturing PMI increased from 51.3 in May to 51.7 in June, indicating improved business conditions in the goods-producing sector for the second consecutive month and the fifth time in six months. Although the latest PMI is lower than the levels seen in February and March, it is the third-highest recorded in the past 21 months. The rise in the PMI was driven by more positive contributions from new orders and employment compared to May, while suppliers’ delivery times and inventories shifted from being negative factors to providing positive support. However, the contribution from production moderated, offsetting some of the gains from other 4 components.
Other Economic Indicators
- Existing Home Sales: Total existing-home sales, according to the National Association of Realtors, declined 0.7% from April to a seasonally adjusted annual rate of 4.11 million in May. Year-over-year, sales declined by 2.8% (down from 4.23 million in May 2023). The decline in home sales suggests fewer people are buying homes, which can signal reduced consumer confidence and spending. This slowdown in the housing market, a significant driver of consumer spending, could dampen economic growth. However, if the increase in inventory leads to price stabilization, it could eventually support a more balanced and sustainable housing market.
- New Home Sales: In May 2024, new single-family home sales reached an annual rate of 619,000, based on seasonally adjusted estimates from the U.S. Census Bureau and the Department of Housing and Urban Development. This figure is 11.3% (±15.5%) lower than the revised April rate of 698,000 and 16.5% (±16.2%) less than the May 2023 estimate of 741,000. The decline in new home sales signals potential challenges for the housing market and broader economy, impacting prices, construction activity, consumer confidence, financial markets, and overall economic growth. It can lead to a cautious approach from both consumers and policymakers, influencing spending, investment, and monetary policies.
BTC Price Analysis
On the daily chart, BTC/USD is adhering to a significant bearish trend line, encountering resistance at $62,650. The price may drop further to around $ 58,200 and 56,500 before bullish momentum potentially returns.
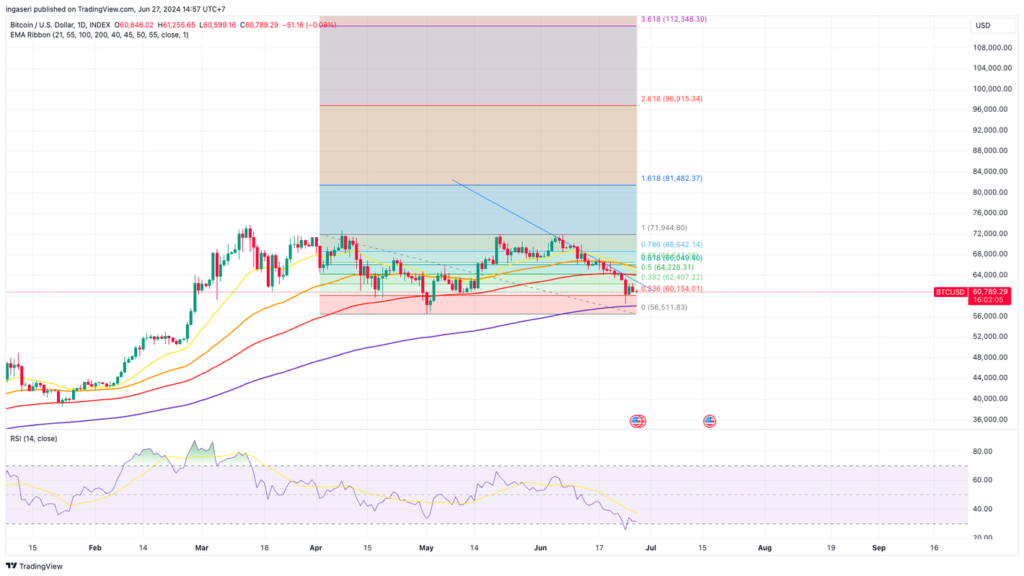
Throughout the week, the bears succeeded in driving the price below the $64,300 and $63,500 support zones. Over the week, the price plunged further, falling below $61,200 and $60,000. It reached a new monthly low of $58,555 before entering a consolidation phase. Recently, there was a minor recovery above $60,000, climbing past the 23.6% Fibonacci retracement level of the decline from the $71,950 high to the $58,555 low.
BTC’s price is currently exhibiting bearish tendencies below the $62,000 level and the 50-day simple moving average. It is also tracking a significant bearish trend line with resistance at $62,650 on the daily chart. If bears continue to dominate below this trend line resistance, the price could see further declines. Immediate support on the downside is around $60,150, with the first major support near $58,500.
A break below the $58,500 support zone could trigger additional bearish activity, potentially pushing the price down to the $56,500 support level. Further losses could pave the way for a decline toward the $52,800 support zone in the coming days.
Bull Case
On the other hand, BTC could remain above $60,000 and attempt a new rally. The immediate upside resistance is around $62,650 and the trend line. A close above this trend line could push the price toward the $65,000 resistance zone. Beyond $65,000, the next significant resistance is near $67,000 and the 50-day simple moving average. Breaking the $67,000 resistance could start a fresh uptrend for BTC.
The next critical resistance is at $68,800, and surpassing this level could build bullish momentum. In this scenario, the bulls might target the $72,000 region. Further gains could propel the price toward $75,000 and potentially a new all-time high.
On-Chain Analysis
- 📊 Exchange: As the exchange reserve continues to rise, it indicates higher selling pressure. Net deposits on exchanges are high compared to the 7-day average. Higher deposits can be interpreted as higher selling pressure.
- 💻 Miners: Miners’ are selling holdings in a moderate range compared to its one-year average. Miner’s revenue is in a moderate range, compared to its one-year average.
- 🔗 On-Chain: More investors are selling at a profit. In the middle of a bull market, it can indicate a market top. Long term holders’ movement in the last 7 days was lower than the average. They have a motive to hold their coins. Investors are in a Anxiety phase where they are currently in a state of moderate unrealized profits.
- 🏦 Derivatives: Long-position traders are dominant and are willing to pay to short traders. Selling sentiment is dominant in the derivatives market. More sell orders are filled by takers. As open interest decreases, it indicates investors are closing futures positions and possibility of trend reversals. In turn, this might trigger the possibility of long/short-squeeze caused by sudden price movement or vice versa.
- 🔀 Technicals: RSI indicates a oversold condition where 78.00% of price movement in the last 2 weeks have been down and a trend reversal can occur. Stochastic indicates a neutral condition where the current price is in a moderate location between the highest-lowest range of the last 2 weeks.
News About Altcoins
- Aevo Shifts Tokenomics Strategy: Ends Trading Rewards, Initiates Buybacks. Aevo has made significant changes to its $AEVO tokenomics, by ending the four-month Trading Rewards campaign. Staking rewards will remain at 100k $AEVO per week. The Aevo Marketing and Growth Committee may reinstate rewards for specific events or new product launches, but not for multi-month programs. In addition, Aevo will begin on-chain buybacks of $AEVO tokens, committing to at least 1 million $AEVO per month from July to December, funded by surplus protocol revenues. This transition aims to shift from aggressive growth to a more defensive strategy, enhancing value for token holders without the pressure of significant unlocks.
News from the Crypto World in the Past Week
- 21Shares Files for Spot Solana ETF, Adding to Growing Interest in Crypto ETFs. Fueled by growing interest in Solana ETFs, 21Shares files for a spot ETF. The fund, named 21Shares Core Solana ETF, tracks Solana’s performance by aggregating SOL trading activity across major spot exchanges. This filing, submitted shortly after VanEck’s application that boosted SOL’s price by 7%, did not have an immediate impact on SOL’s value, which dropped over 6% to $140.20. The increased interest in Solana ETFs highlights confidence in Solana as a viable institutional investment, with similar applications seen in Canada as well. Despite regulatory hurdles, experts like Bloomberg’s Eric Balchunas and CNBC’s Brian Kelly remain optimistic about the possibility of Solana ETFs being approved. They suggest that changes in US regulatory attitudes could pave the way for this to happen.
Cryptocurrencies Market Price Over the Past Week
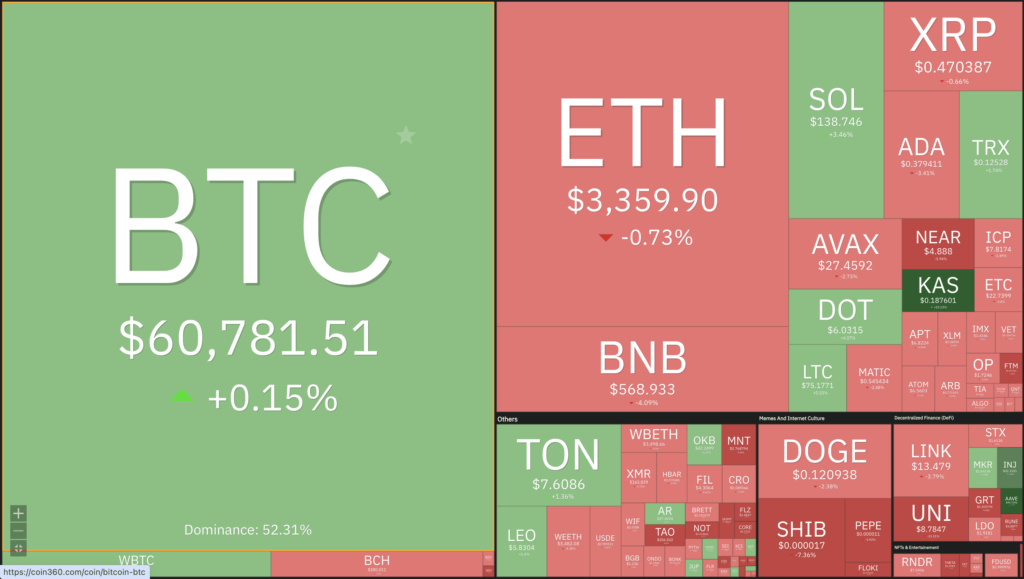
Cryptocurrencies With the Best Performance
- Akash Network (AKT) +24,35%
- Kaspa (KAS) +18,50%
- Aave (AAVE) +15,27%
- dogwifhat (WIF) +14,67%
Cryptocurrencies With the Worst Performance
- Ethena (ENA) -20,24%
- Pendle (PENDLE) -17,88%
- Worldcoin (WLD) -15,94%
- Gnosis (GNO) -14,10%
References
- Assad Jafri, 21Shares becomes second major firm to apply for a spot Solana ETF this week, cryptoslate, accessed on 30 June 2024.
- Aevo, AEVO Tokenomics Update, aevo.mirror, accessed on 30 June 2024.