
Crypto investors had a reason to smile last week as Bitcoin (BTC) prices returned to the $67K range. The increase in BTC price was driven by the positive inflows of BTC ETFs for 11 consecutive days. In addition, concerns about the German government’s BTC sales have eased. Is it possible for the crypto market to close July positively? Check out the analysis below.
As usual, the Pintu trading team has gathered critical information and analyzed the general economic situation and the crypto market’s movements over the past week. However, it should be noted that all information in this Market Analysis is intended for educational purposes, not as financial advice.
Market Analysis Summary
- 🟢 BTC is in a positive trend after successfully recovering to the $67k range. This positive trend is due to large inflows into BTC ETFs.
- 📈 PPI for final demand rose by 0.2% compared to the previous month. Annually, the PPI saw a 2.6% increase.
- ↔️ Retail sales in the US remained unchanged last month compared to the previous month.
- 🏠 In June, privately-owned housing units authorized by building permits reached a seasonally adjusted annual rate of 1,446,000.
Macroeconomic Analysis
PPI MoM
In June, U.S. producer prices increased slightly more than anticipated, driven by rising margins in the service sector, which counterbalanced a second consecutive month of falling goods prices.
Data from the Bureau of Labor Statistics released on Friday indicated that the producer price index (PPI) for final demand rose by 0.2% compared to the previous month. Annually, the PPI saw a 2.6% increase.
This report on wholesale inflation follows the consumer price index (CPI) report, which revealed the first decrease since the pandemic began, setting the stage for the Federal Reserve to potentially reduce interest rates as early as September.
The PPI report highlighted a 0.6% increase in service costs, with nearly all of the growth attributed to a 1.9% rise in margins for wholesalers and retailers. Meanwhile, goods prices declined by 0.5%. Excluding food, energy, and trade services—components that create more volatility—the index remained unchanged from the previous month and showed an annual growth rate of 3.1%.
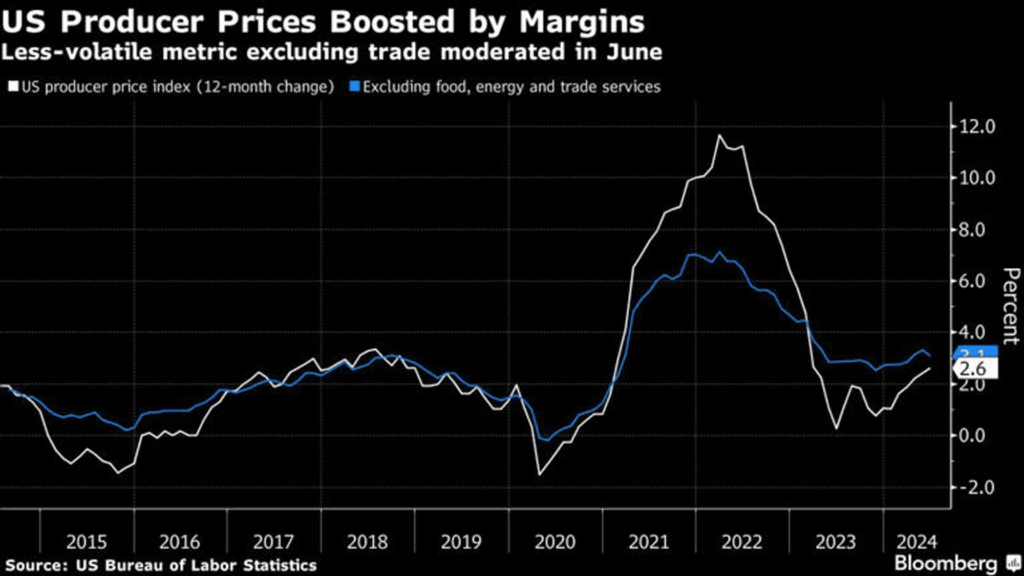
The rise in PPI is primarily driven by higher margins in the service sector, particularly among wholesalers and retailers. This suggests that these businesses are passing on higher costs to consumers, which can contribute to overall inflation. Also, the consecutive monthly decline in goods prices indicates some relief in the cost of goods, which can help mitigate inflationary pressures from the service sector.
The rising service costs but falling goods prices reflect a complex inflationary environment. While the PPI shows some inflation, the broader measure excluding food, energy, and trade services remains stable, suggesting underlying inflation might be moderating. This, in conjunction with the recent consumer price index (CPI) report showing the first decline since the pandemic, supports the Fed’s potential decision to lower interest rates. This could happen as soon as September, aiming to stimulate economic growth by making borrowing cheaper.
Other Economic Indicators
- Michigan Consumer Sentiment: According to the preliminary Michigan Consumer Sentiment Index report, consumer sentiment in July fell to its lowest level in eight months. The index declined by 2.2 points (a 3.2% drop) from June’s final figure, landing at 66.0. This latest reading was below the anticipated forecast of 68.5. This drop in consumer sentiment suggests caution among consumers and businesses, which could contribute to slower economic growth and influence monetary policy decisions.
- NY Empire State Manufacturing Index: Manufacturing activity in New York State saw a slight decline in July, as reported by the Empire State Manufacturing survey. The General Business Conditions index dropped to -6.6, down from -6.0 in June, and fell short of the expected -5.5. Overall, the index points to current challenges in manufacturing but also hints at potential improvement in the future, affecting employment, inflation, and economic growth prospects.
- Retail Sales: Retail sales in the United States stalled last month, surpassing market expectations of a 0.3 percent decline, indicating strong consumer spending despite high interest rates. June’s retail sales reached $704.3 billion, with an upward revision of May’s increase to 0.3 percent. The data showed increases in online sales (1.9 percent), health and personal care sales (0.9 percent), and clothing, accessories, and furniture sales (0.6 percent).
- Building Permits: In June, privately-owned housing units authorized by building permits reached a seasonally adjusted annual rate of 1,446,000. This marks a 3.4 percent increase from the revised May rate of 1,399,000 but is 3.1 percent lower than the June 2023 rate of 1,493,000. Single-family authorizations in June were at a rate of 934,000, which is 2.3 percent below the revised May figure of 956,000.
- Initial Jobless Claim: According to Labor Department data released Thursday, initial claims rose by 20,000 to 243,000 for the week ending July 13, reaching the highest level since August 2023. This exceeded the median forecast of 229,000 applications from a Bloomberg survey of economists. Continuing claims, representing the number of people currently receiving unemployment benefits, increased by 20,000 to 1.87 million for the week ending July 6, marking the highest level since November 2021.
BTC Price Analysis
The latter part of July has seen a strong bullish trend in the cryptocurrency market, driven by a high-momentum rally in BTC price. The easing of supply pressure on BTC came as the German government concluded its $3.5 billion selloff and the defunct Mt. Gox exchange successfully repaid 65% of its creditors. This renewed demand was further bolstered by substantial inflows into the BTC ETF, reflecting robust investor confidence.
The daily BTC chart shows a robust V-shaped recovery from the $53,500 support level. This bullish reversal has increased the coin’s value by 24.86%, at the time of writing (July 20, 2024) trading at $66,597, and boosted its market cap to $1.315 trillion.
💡 The price of BTC experienced volatility shortly after US President Joe Biden announced his withdrawal from the US presidential election and named US Vice President Kamala Harris as his running mate. BTC had fallen to $65,833 and recently (July 22nd) the price of BTC rose to around $68 thousand.
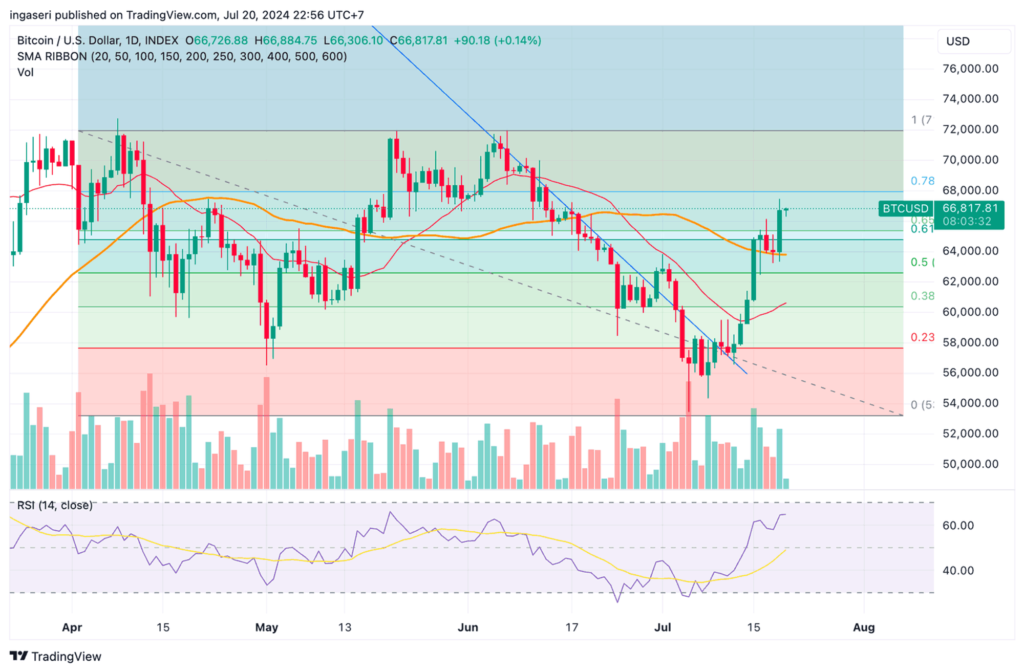
BTC price pushing against the upper Bollinger Band indicates buyer dominance in the current market. This positive trend is likely due to substantial inflows into the BTC ETF.
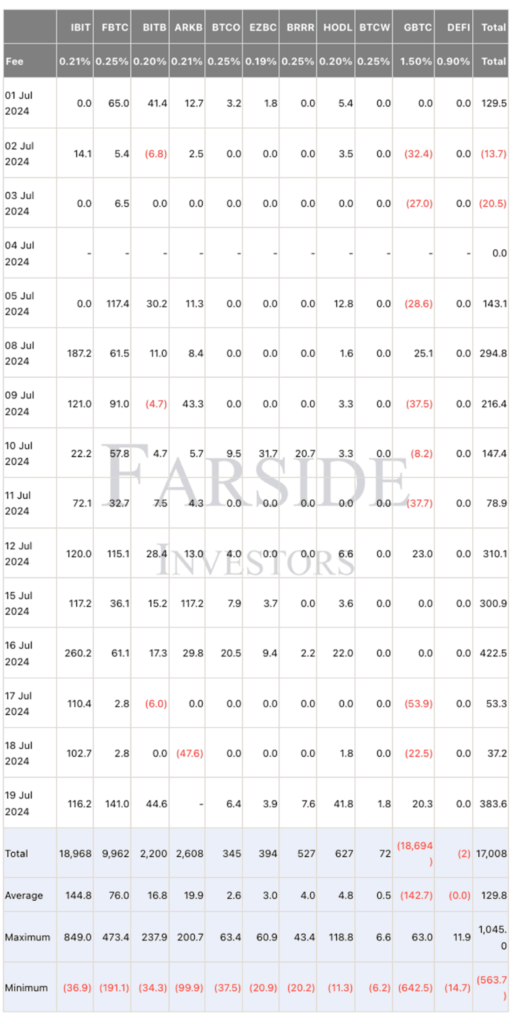
On July 19th, Bitcoin ETFs saw a net inflow of $383.6 million, marking 11 consecutive days of positive inflows.
On-Chain Analysis
- 📊 Exchange: As the exchange reserve continues to fall, it indicates lower selling pressure. Net deposits on exchanges are high compared to the 7-day average. Higher deposits can be interpreted as higher selling pressure.
- 💻 Miners: Miners’ are selling holdings in a moderate range compared to its one-year average. Miner’s revenue is in a moderate range, compared to its one-year average.
- 🔗 On-Chain: More investors are selling at a profit. In the middle of a bull market, it can indicate a market top. Long term holders’ movement in the last 7 days was lower than the average. They have a motive to hold their coins. Investors are in a belief ****phase where they are currently in a state of high unrealized profits.
- 🏦 Derivatives: Long-position traders are dominant and are willing to pay to short traders. Buying sentiment is dominant in the derivatives market. More buy orders are filled by takers. As OI increases, it indicates more liquidity, volatility, and attention are coming into the derivative market. The increasing trend in OI could support the current ongoing price trend.
- 🔀 Technicals: RSI indicates an overbought condition where 75.00% of price movement in the last 2 weeks have been up and a trend reversal can occur. Stochastic indicates an oversold condition where the current price is close to its high in the last 2 weeks and a trend reversal can occur.
News About Altcoins
- Solana Surges: TVL Nears $5 Billion as Raydium and Jupiter Hit New Records. Solana’s total value locked (TVL) in decentralized applications (dApps) nears $5 billion, reaching its highest point since February 2022 at $4.99 billion. This surge represents a 4% increase today and a 19% gain over the past week, solidifying Solana’s position as the third-largest blockchain in DeFi, surpassing Binance’s BNB Smart Chain. Within the Solana ecosystem, Raydium, the largest decentralized exchange, surpassed $1 billion in TVL, while Jupiter Perpetual Exchange reached over $500 million. Solana’s blockchain has attracted $1 billion worth of crypto since July 5, indicating strong momentum for its dApps and continued growth in the DeFi space.
News from the Crypto World in the Past Week
- SEC Greenlights Ether ETFs, Paving the Way for Wider Crypto Adoption. The U.S. Securities and Exchange Commission (SEC) has given preliminary approval to eight asset managers to launch exchange-traded funds (ETFs) tied to the spot price of ether. Trading could begin next Tuesday, pending the submission of final offering documents by the end of the week. This approval marks a significant step for the cryptocurrency industry, pushing digital assets further into the mainstream, following the successful launch of nine spot bitcoin ETFs in January. The price of ether, the world’s second-largest cryptocurrency, rose to $3,433.07, reflecting a 7.1% increase on Monday. While expectations for ether ETFs are more modest, industry experts remain optimistic about their success. The SEC’s approval comes after years of market manipulation concerns and a notable court challenge, with Chair Gary Gensler acknowledging the influence of past rulings on the decision.
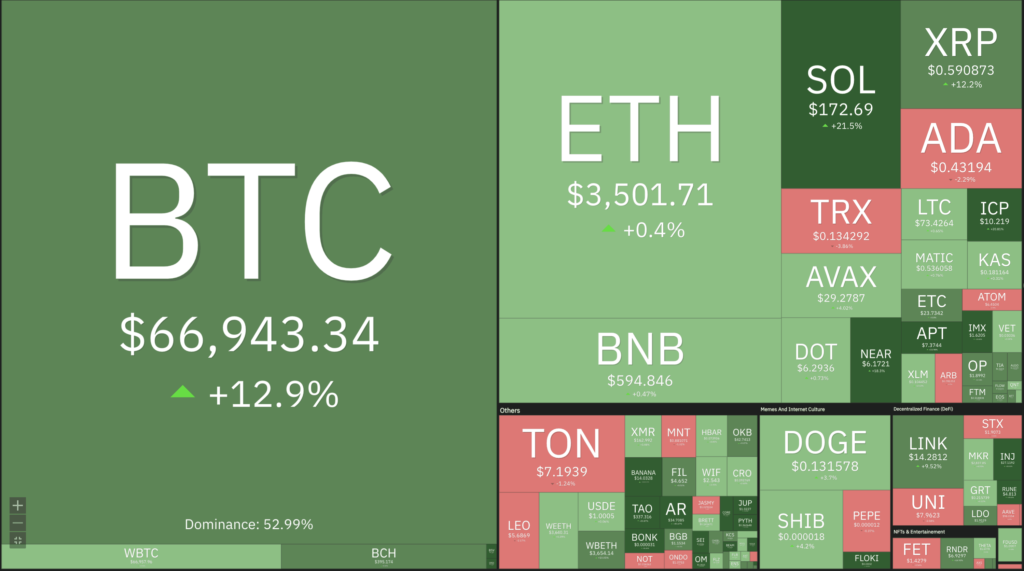
Cryptocurrencies Market Price Over the Past Week
Cryptocurrencies With the Best Performance
- dogwifhat (WIF) +46,23%
- Helium (HNT) +43,59%
- Arweave (AR) 40,96%
- Worldcoin (WLD) +38,83%
Cryptocurrencies With the Worst Performance
- Uniswap (UNI) -4,85%
- Aave (AAVE) -3,82%
- TRON (TRX) -2,97%
- Toncoin (TON) -2,03%
References
- Suzanne McGee, Spot ether ETFs likely to begin trading July 23, industry sources say, reuters, accessed on 21 July 2024.
- Anatol Antonovici, Solana TVL Inches Away from $5B, Hits Highest Since Feb 2022, nftgators, accessed on 21 July 2024.