
Bitcoin (BTC) has been ranging between $115,000 and $118,000 over the past week, but its price consolidation phase has turned out to be a blessing for altcoins—Ethereum (ETH), for example, has surged by as much as 20% during the week. Read the full analysis from Pintu’s Trader Team in the article below.
Market Analysis Summary
- 🎯 BTC could rise back above $120,000 soon and potentially reach between $125,000 and $128,000 by late July, representing a 6% to 8% rally from current levels.
- 🏤 U.S. retail sales in June 2025 rose 0.6% month-over-month (MoM), rebounding robustly after two months of declines.
- 🏠 In June 2025, U.S. housing starts increased by 4.6% month-over-month (MoM) to a seasonally adjusted annual rate of 1.321 million units.
- 👷🏻♂️ In June 2025, U.S. building permits edged up by 0.2% month-over-month to a seasonally adjusted annual rate of 1,397,000 units.
- 📈 The University of Michigan’s Consumer Sentiment Index for July 2025 increased modestly to 61.8, marking the highest reading in five months and rising from 60.7 in June.
Macroeconomic Analysis
June 2025 U.S. Retail Sales
U.S. retail sales in June 2025 rose 0.6% month-over-month (MoM), rebounding robustly after two months of declines. This jump far outpaced the consensus forecast of 0.1% and marks a pivotal shift for the sector, which had faced declining numbers in April and May. The gains were broad-based across the majority of categories, highlighting renewed consumer momentum despite macro-level uncertainties surrounding inflation and tariff policies.
On a year-over-year (YoY) basis, total retail sales climbed 3.9% in June, building on May’s 3.3% advance. The annual rate indicates durable underlying strength in U.S. consumer demand. With total sales for April through June 2025 up 4.1% from the same period a year earlier, retailers are benefiting from a combination of steady job growth, moderate wage gains, and ongoing resilience in discretionary spending—even as consumer sentiment remains cautious.
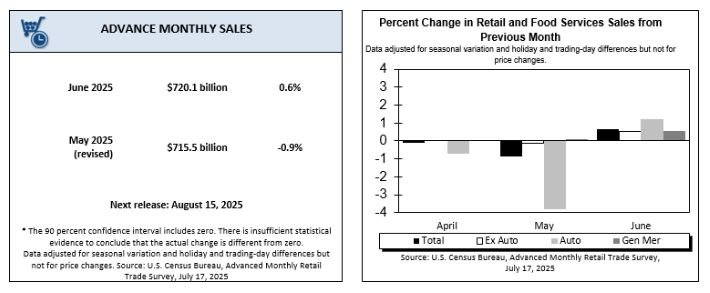
Retail sales excluding gasoline stations and auto dealers—a useful gauge of underlying consumer demand—rose 0.6% MoM in June. This matched the increase in headline sales and marks a significant rebound from the previous month’s flat reading. Sectors such as clothing (+0.9%), health and personal care (+0.5%), and non-store (e-commerce) retailers (+0.4%) were key contributors, with essentials and value-focused segments outperforming amid ongoing price pressures.
Sales excluding the volatile auto sector advanced by 0.5% MoM in June. This improvement over May’s 0.2% decline points to more sustainable consumer activity across the broader retail landscape. The underlying strength hints at ongoing household willingness to spend beyond big-ticket transportation items and highlights important support for GDP calculations coming from categories like building materials, general merchandise, food and beverage, and restaurants.
June’s sales figures surpassed expectations on all major fronts, with the “control group” (excluding food services, autos, building materials, and gasoline stations) also rising 0.5% MoM—signaling steady momentum for underlying consumer activity. Automotive sales, despite their typical volatility, provided an upside surprise, while declining gasoline prices curbed sales at the pump but benefited other retail categories. These results suggest that consumer spending remains a powerful driver of U.S. economic growth, even in the face of persistent inflationary and trade headwinds
Other Economic Indicators
- Housing Starts: In June 2025, U.S. housing starts increased by 4.6% month-over-month (MoM) to a seasonally adjusted annual rate of 1.321 million units, recovering from a sharp 9.7% decline in May and roughly meeting market expectations of about 1.3 million units.
- Building Permits: In June 2025, U.S. building permits edged up by 0.2% month-over-month to a seasonally adjusted annual rate of 1,397,000 units, slightly surpassing market expectations of 1.39 million permits. Despite this minor monthly uptick, the year-over-year comparison reveals a 4.4% decline from the June 2024 rate of 1,461,000 units, highlighting ongoing headwinds faced by the residential construction sector.
- Michigan’s Consumer Sentiment: The University of Michigan’s Consumer Sentiment Index for July 2025 increased modestly to 61.8, marking the highest reading in five months and rising from 60.7 in June. This figure slightly exceeded expectations, which had forecast a rise to around 61.5.
BTC Price Analysis
Over the past week leading up to July 23, 2025, BTC showed signs of consolidation and slight weakness, trading around $118,000 to $119,000. After a brief false breakout near local resistance of $119,239, BTC failed to sustain upward momentum and pulled back slightly. Trading volumes declined, reflecting an absence of strong buying or selling pressure and resulting in a consolidation phase between $117,000 and $120,000. Technical indicators like the MACD slipped into negative territory, and BTC moved below key exponential moving averages (EMAs) in the $117,868 to $118,247 range, signaling short-term bearish momentum.
Despite this minor correction, BTC remains above critical support levels near $115,000 to $112,000, which many analysts see as a floor that could underpin a resumption of upward movement. Looking ahead, experts predict that BTC could rise back above $120,000 soon and potentially reach between $125,000 and $128,000 by late July, representing a 6% to 8% rally from current levels. However, failure to hold above $118,000 might provoke a pullback toward lower support bands before a new uptrend begins.
Market sentiment remains relatively positive despite the recent pullback. The total crypto market cap is strong, and BTC continues to lead with an estimated market cap around $2.32 trillion. Trading volume elevated by nearly 20% in the last 24 hours indicates active market participation, while the Fear & Greed Index is at 67/100 (“Greed”), reflecting elevated investor confidence compared to a month ago. This optimism is fueled partly by expectations of possible Federal Reserve rate cuts later in July, which could provide a macroeconomic tailwind for crypto assets.
BTC Technical Analysis
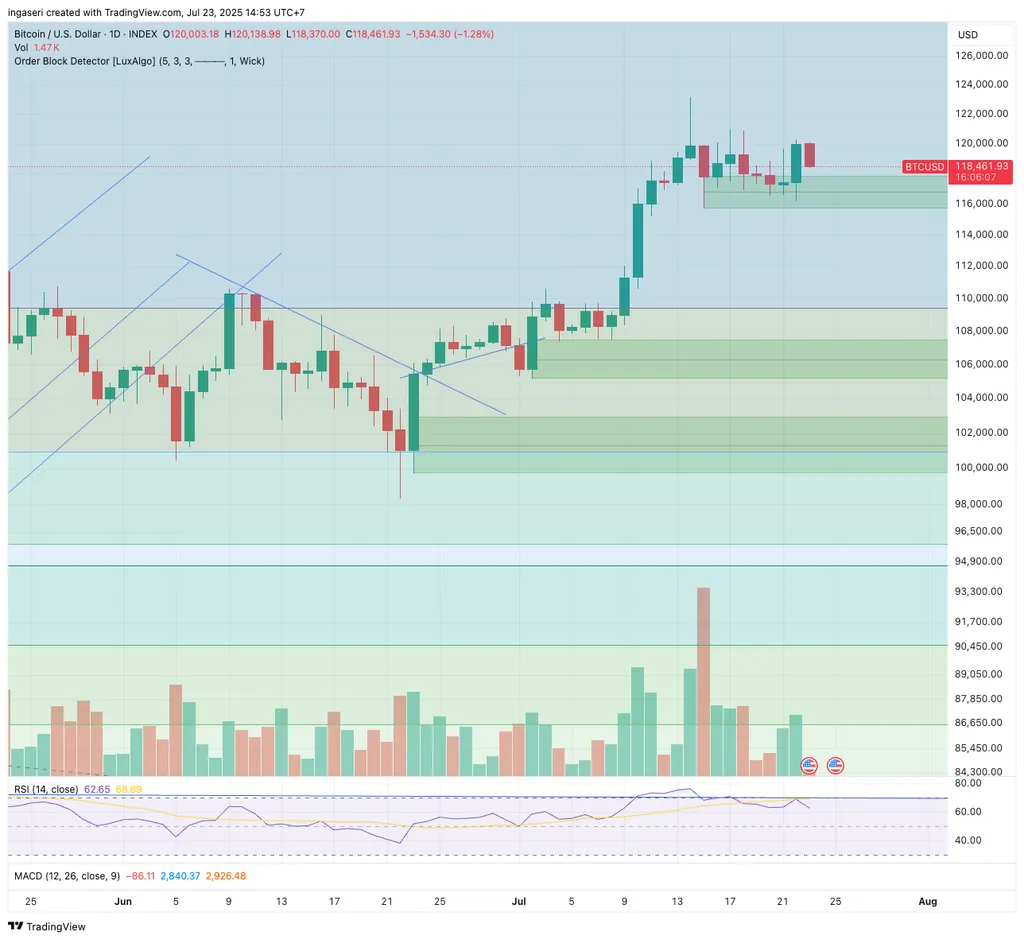
In short, BTC’s price action over the past week reflects a pause and consolidation following recent gains, with the market weighing near-term risks and waiting for clear directional signals. While short-term technical indicators suggest some pressure, strong support zones and positive institutional interest underpin a cautiously bullish outlook. If BTC can decisively close its weekly candles above the $119,482 level, it may confirm renewed strength; otherwise, a correction down toward $112,000 to $115,000 remains possible before price resumes an upward trajectory
ETH Price Analysis
Over the past week, ETH has demonstrated robust performance and consolidation following a period of strong gains. As of July 23, 2025, ETH is trading around $3,674.9, with a slight daily decrease of 0.63% . This follows a volatile push earlier in the week where ETH briefly touched $3,082 and then rallied further to reach highs around $3,758.05 . The sustained price above key psychological levels like $3,000 indicates that bullish sentiment remains largely in control.
Mid-week, around July 16, ETH was trading near $2,989 and saw a significant surge, outperforming BTC and breaking above $3,400 for the first time since January . This rally was supported by rising institutional accumulation, including a $67.3 million ETH treasury expansion by Bit Digital . Technical indicators suggested a weak bullish crossover on the MACD and expanding Bollinger Bands, indicating fresh volatility and potential for further upward movement .
Looking ahead, analysts are optimistic about ETH’s near-term trajectory. Predictions for July 23, 2025, placed ETH around $3,689.39, with expectations of further gains towards $3,943.83 by July 26 and potentially reaching $4,125.35 by July 28 . The sustained price above its long-standing ascending trendline from the April swing low near $1,900 further supports the bullish outlook . However, some analysts predict that ETH might face resistance at the $4,000 level and could experience a pullback before a more significant breakout .
ETH Technical Analysis
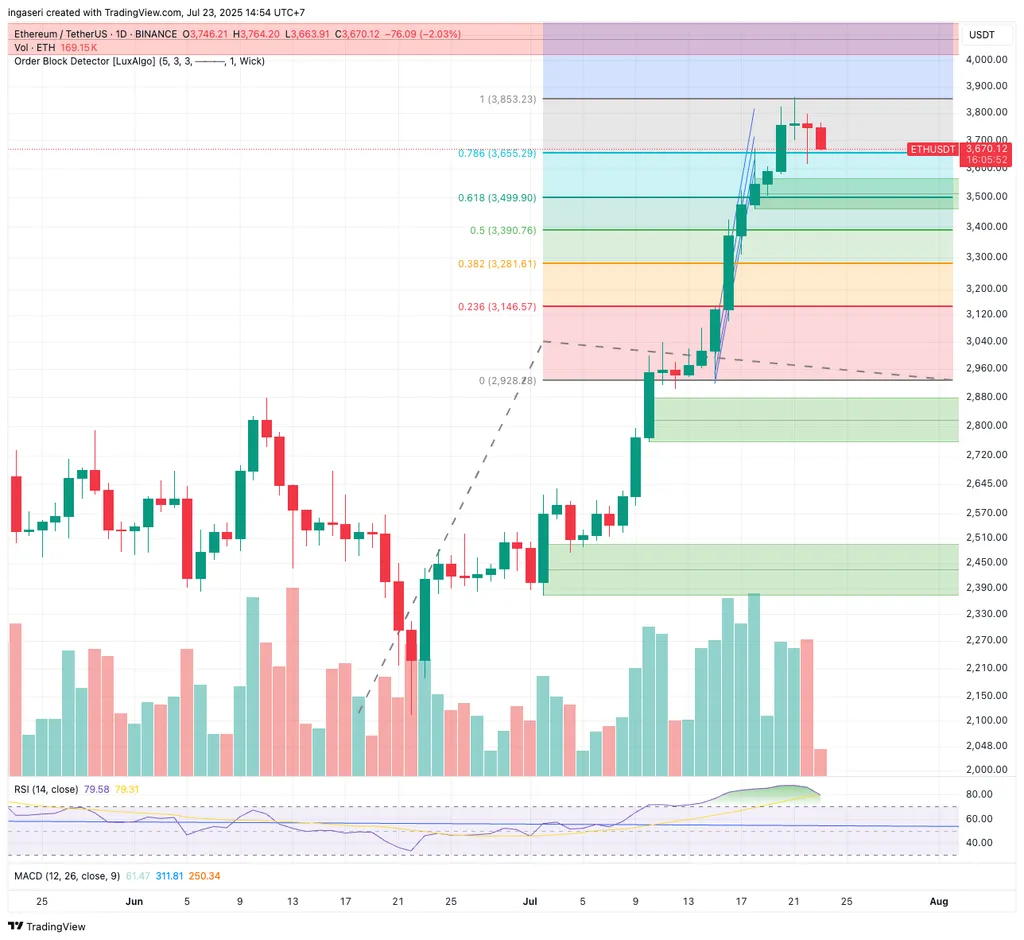
The overall market sentiment for ETH remains strong, with its market cap growing by over $150 billion in July, reflecting weekly gains of approximately 20% and significant inflows . Despite the minor daily fluctuations, ETH has shown considerable resilience and an upward trend over the past week, with its price up 6.58% compared to a year ago . The current price also significantly surpasses its 50-day and 200-day moving averages of $2,732.71 and $2,480.83 respectively, reinforcing its bullish momentum .
Altcoin Analysis
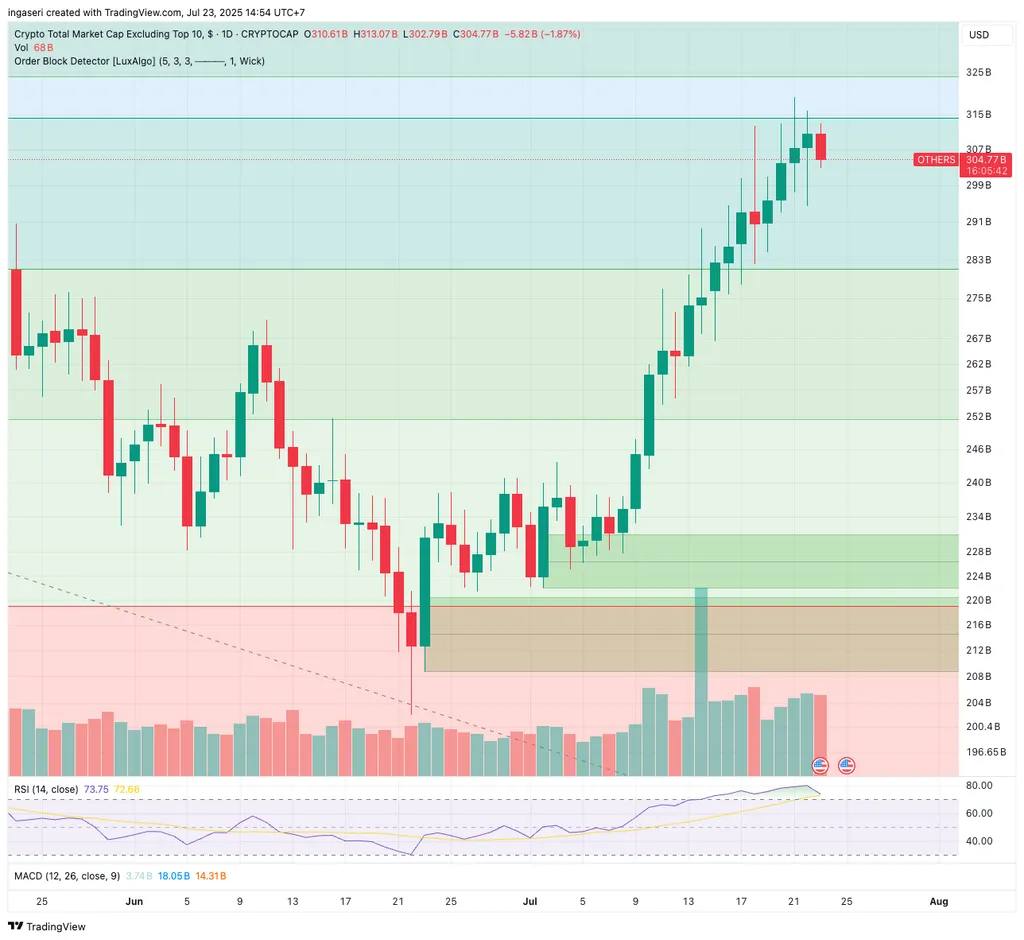
Over the past week ending July 22, 2025, the wider crypto market experienced strong momentum and notable sector-specific gains, driven by positive regulatory developments and growing investor interest in altcoins. The total crypto market cap surpassed $4 trillion, buoyed mainly by the passage of the GENIUS Act in the U.S., which fostered optimism about regulatory clarity and future crypto adoption. This positive sentiment coincided with a rotation of capital into more speculative assets, especially memecoins, which showed the largest growth, while privacy coins were the only sector that declined over the period.
Several altcoins posted impressive gains, underscoring renewed altcoin season dynamics. For example, Conflux surged by 125%, fueled by a major upgrade announcement that included launching a native stablecoin and boosting its transaction throughput to 15,000 per second. Other notable gainers included DIA (+143%), UMA (+58%), and Tezos (+55.5%), all benefiting from network activity growth, positive regulatory developments, or improved project fundamentals. XRP also spiked 21.1%, reaching a seven-year high of $3.66 amid encouraging regulatory news, signaling institutional accumulation and increased investor confidence.
This altcoin strength contributed to BTC dominance falling from around 65.5% to approximately 61%, while ETH’s share rose modestly from 9.7% to 11.6%, indicating investors are diversifying capital into a broader set of tokens beyond the two largest cryptocurrencies. The altcoin season index climbed from 32 to 56, signaling a marked shift favoring altcoins over BTC in the short term. Despite BTC’s recent price volatility and slight weekly decline, altcoins benefited from this regime shift, supported by ongoing institutional inflows and legislative clarity.
Sector-wise, exchange tokens underperformed relative to other altcoin sectors, reflecting investors’ preference for tokens associated with network utility and DeFi projects rather than centralized exchange-related tokens. Memecoins, meanwhile, saw speculative-driven gains, reflecting a higher risk appetite among some market participants. Stablecoins also received increased attention as instruments of liquidity and capital rotation within the crypto ecosystem.
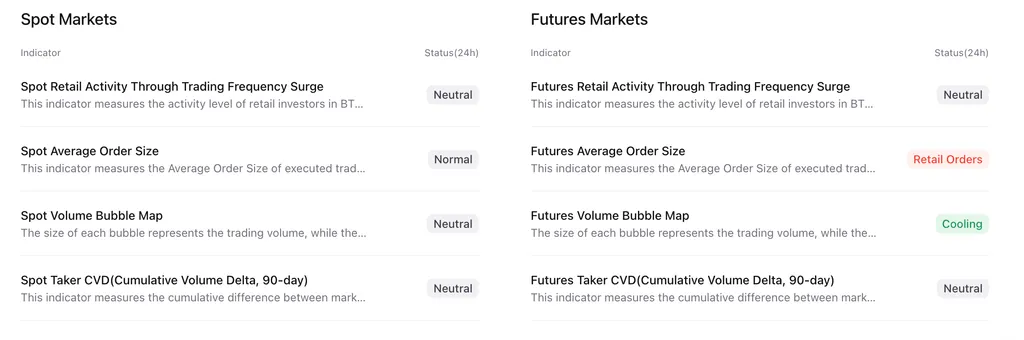
On-Chain Analysis
News About Altcoins
- Bonkfun Surges Ahead in Solana’s Meme Coin Arena. Bonkfun has emerged as the dominant meme coin launchpad on Solana, accounting for 55% of all token launches and capturing up to 80% of market share in trading volume. Its strategic use of buy/burn mechanics and strong community momentum have attracted significant liquidity from Pumpfun, whose growth has slowed with a drop in daily token launches. Generating nearly $2 million in fees in just 24 hours, Bonkfun demonstrates strong traction, though analysts caution that meme coin trends remain volatile. Its continued success will depend on innovation, regulation, and market sentiment.
News from the Crypto World in the Past Week
- Trump Meets Powell Amid Rate Cut Push and Renovation Dispute. President Donald Trump met Federal Reserve Chair Jerome Powell during a rare visit to the central bank’s headquarters, where they discussed interest rates and clashed over the cost of ongoing building renovations. While Trump praised Powell as a “very good man” after previously criticizing him, economists expect no change in rates at the upcoming policy meeting. Trump also voiced frustration over trade negotiations with Canada and the EU, suggesting unilateral tariffs. Despite Trump’s claim that inflation has been eliminated, it rose to 2.7% last month. The Fed reiterated its commitment to making independent, non-political decisions.
Cryptocurrencies Market Price Over the Past Week
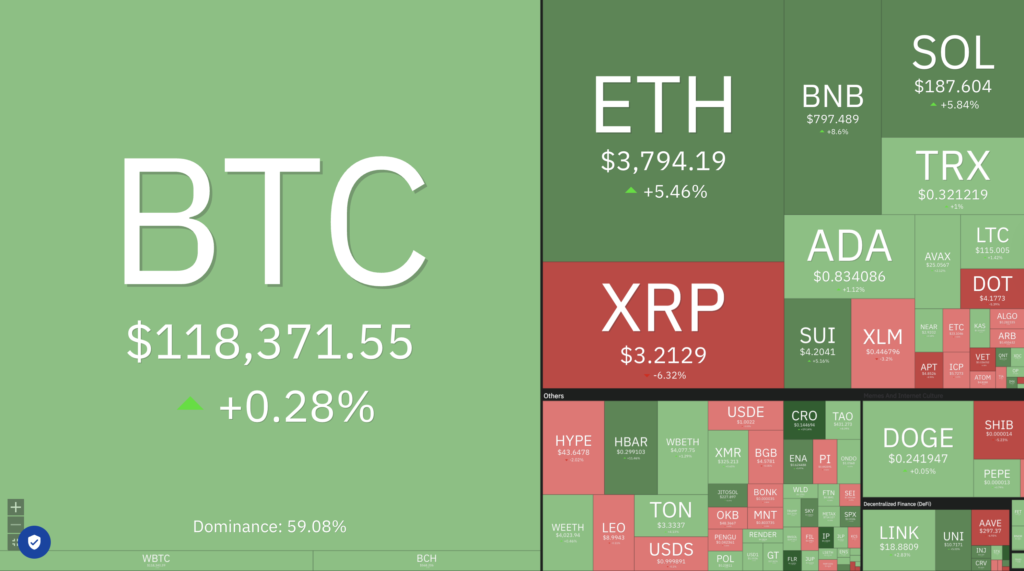
Cryptocurrencies With the Best Performance
- Conflux (CFX) +52.71%
- Pudgy Penguins (PENGU) +36.79%
- Ethena (ENA) +35.26%
- Flare (FLR) +25.40%
Cryptocurrencies With the Worst Performance
- Tezos (XTZ) -18.58%
- Sonic (S) -13.59%
- Virtuals Protocol (VIRTUAL) -10.34%
- Aptos (APT) -8.57%
References
- Aljazeera, Trump signals positive meeting with Powell on US interest rates, Aljazeera, accessed on 27 July 2025.
- Coin World, Solana News Today: Bonkfun’s Deflationary Tokenomics Fuel $127.5M Volume Surge, Overtaking Pumpfun on Solana, ainvest, accessed on 27 July 2025.