
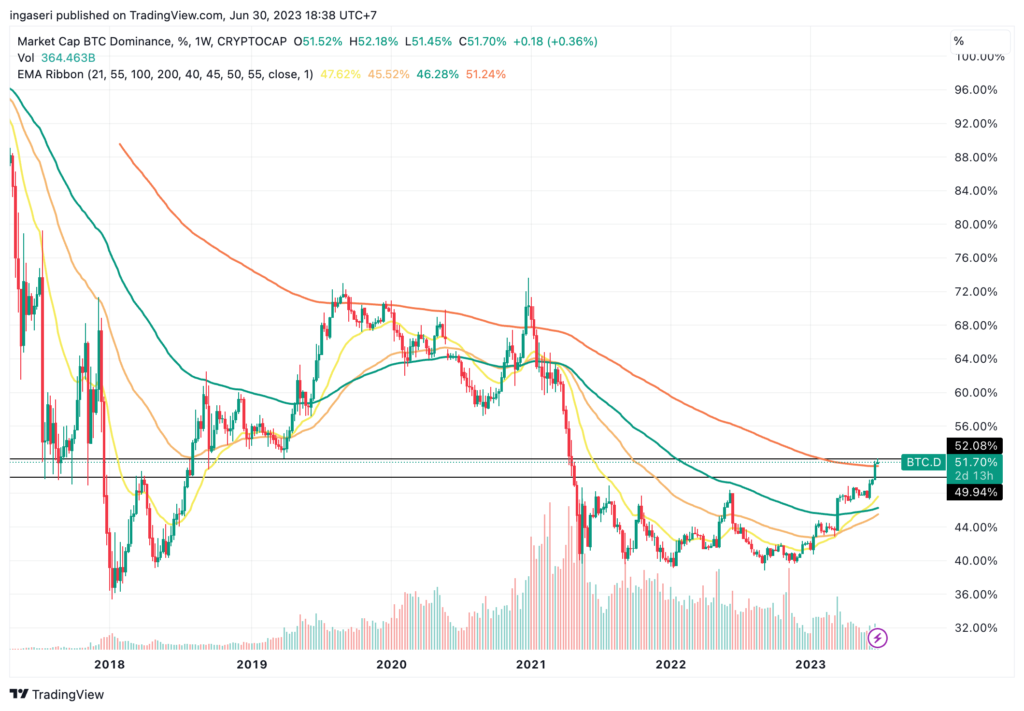
As a result of BTC price spike that touched US$31,500, BTC Dominance also rose to its highest level since April 2021. Currently, BTC Dominance is at 52% which historically serves as a strong resistance. Where will BTC go next? Check out the analysis below.
The Pintu trading team has gathered critical information and analyzed the general economic situation and the crypto market’s movements over the past week. However, it should be noted that all information in this Market Analysis is intended for educational purposes, not as financial advice.
- 📈 The US Census Bureau report shows a 1.7% increase in durable goods orders in May, indicating that US companies continue to invest long-term despite economic uncertainty.
- 🏠 New home sales in the U.S. rose at the fastest pace since January 2022, indicating that the housing sector has bottomed out and is contributing to economic growth.
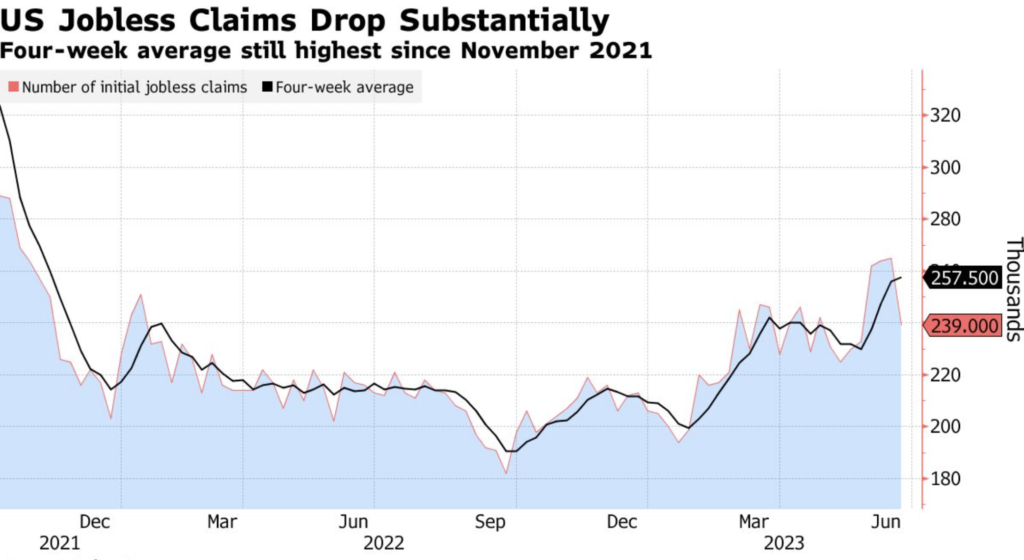
- 📉 Initial unemployment claims dropped by 26,000, reaching 239,000 for the week ending on June 24, even though demand for labor gradually decreases in line with The Fed’s interest rate hike.
- 🔝 Fidelity Investments follows BlackRock’s move to apply for approval for a Bitcoin ETF. Large institutions’ interest in BTC has driven the price up as well as BTC Dominance which has now reached its highest level since April 2021.
Macroeconomic Analysis
The U.S. Census Bureau reported that new orders for manufactured durable goods in May increased 1.7% or $4.9 billion to a total of $288.2 billion. This growth followed a 1.2% increase in April and exceeded market expectations for a 1% decline. This second consecutive monthly increase in U.S. business orders for domestic factory equipment indicates that companies continue to make long-term investments amid economic uncertainty.
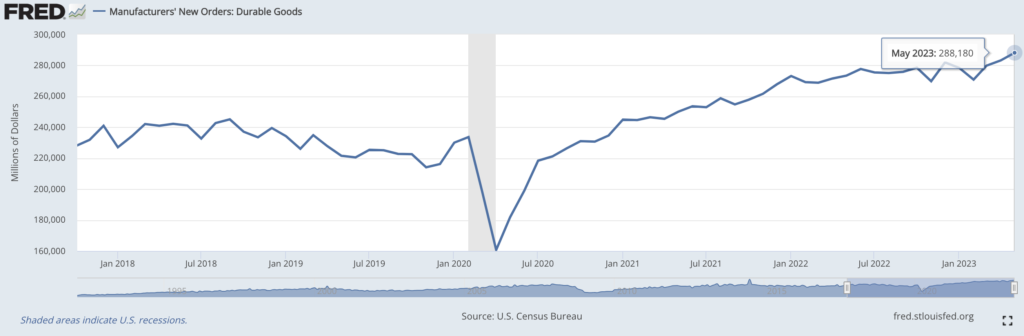
New orders outside of transportation increased 0.6%, while new orders outside of defense increased significantly by 3.0%. The increase in orders was primarily driven by transportation equipment, which increased by $3.9 billion or 3.9% over the last three months to $102.6 billion.
The steady pace of capital spending suggests that companies are actively improving efficiency in response to rising labor and material costs. However, there is a risk that high borrowing costs, limited access to credit, and slow economic growth could reduce investment, although U.S. home sales are on a positive trend.
New home sales rose at the fastest pace in more than a year. Purchases of single-family homes rose 12.2% to an annual rate of 763,000 units last month, marking the third consecutive monthly increase in new home sales. The increase is due to the limited availability of inventory in the resale market.
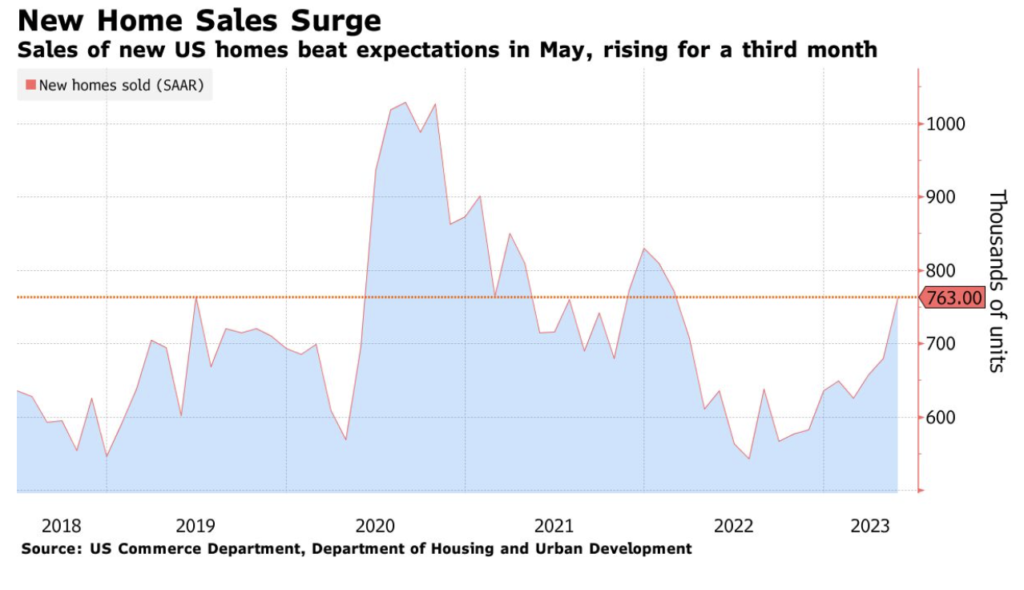
New home sales are considered an accurate indicator compared to existing home purchases. Nevertheless, for the third month in a row, the number of homes sold and under construction in May showed the highest backlog since January 2022. About 428,000 homes were available for sale at the end of last month, representing a six- to seven-month supply at the current sales rate, the lowest since February 2022.
The average price of new home sales has fallen for two consecutive months by 7.6%, or $416,300, from a year ago. Therefore, home sales have increased in all four regions, with the South recording the highest sales since late 2021. The housing sector has contributed to economic growth amid the issue of high mortgage rates.
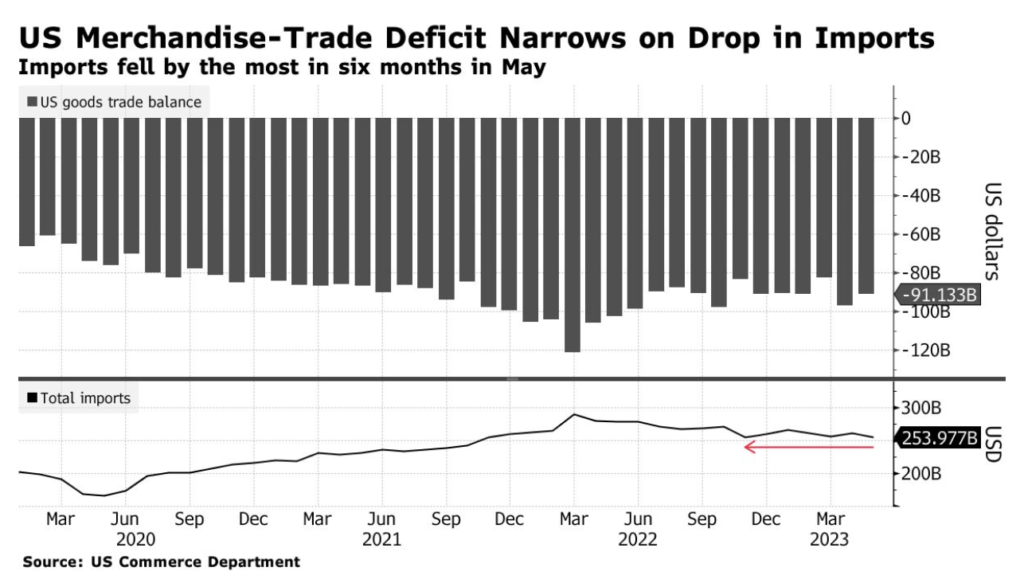
Another issue is the trade sector, where data released by the Commerce Department on Wednesday showed that the goods trade deficit narrowed by 6.1% to $91.1 billion in May. Imports also experienced their smallest decline since November, falling 2.7% to $254 billion. Exports, on the other hand, fell slightly by 0.6% to $162.8 billion, reflecting a decline in outbound shipments of food and industrial supplies. The U.S. goods trade deficit narrowed more than expected, mainly due to a significant drop in the value of imports.
There was also a decline in unemployment claims for the week. According to a report from the Labor Department on Thursday, initial jobless claims fell by 26,000 to 239,000 for the week ending June 24.
In the week ending June 17, the number of continuing claims, which include individuals who have been receiving unemployment benefits for more than one week, fell to 1.7 million.
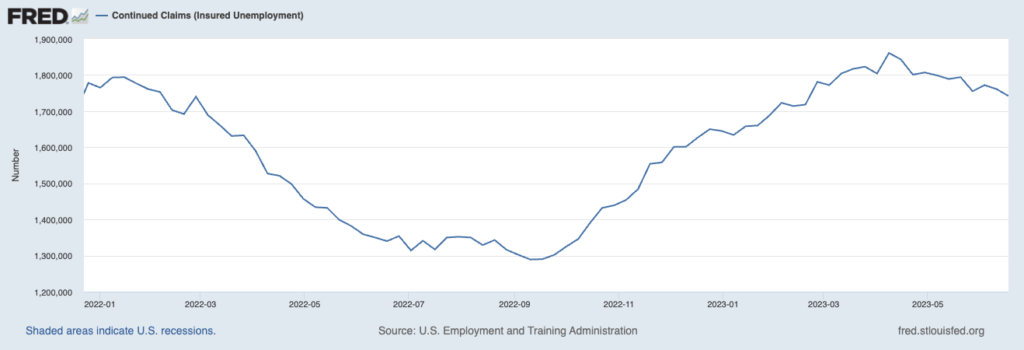
Amid the decline in claims, the demand for workers is beginning to decline as the effects of the Federal Reserve’s interest rate increases over the past year begin to work their way through the economy. The claims data are volatile from week to week, especially during the holiday season. The four-week moving average of initial claims rose slightly to 257,500, the highest level since late 2021.
BTC & ETH Price Analysis
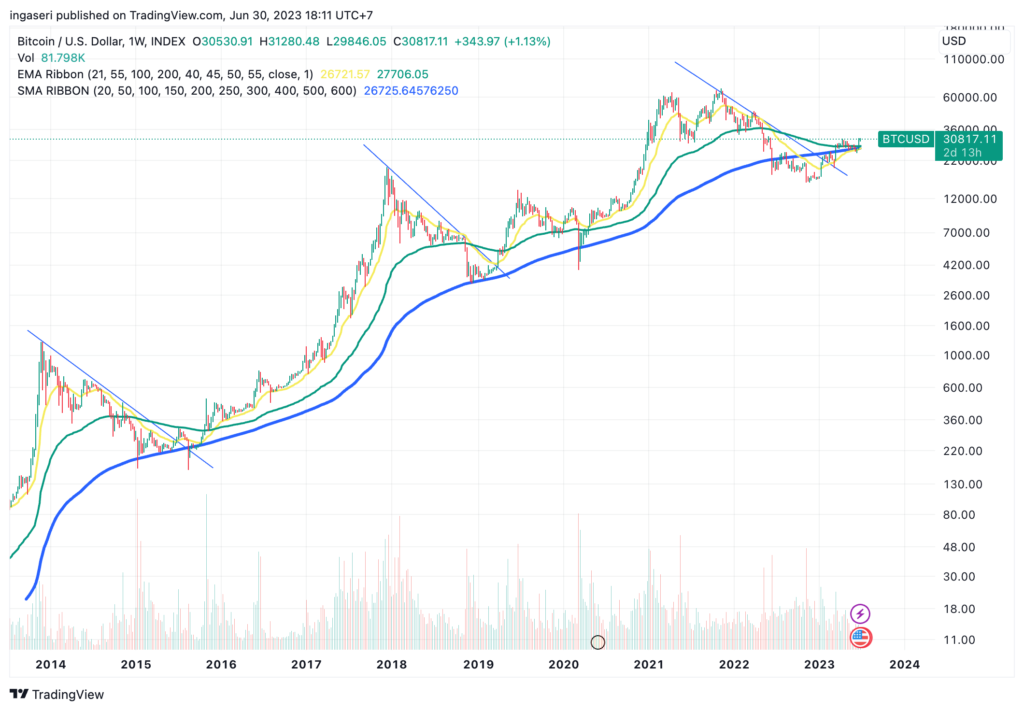
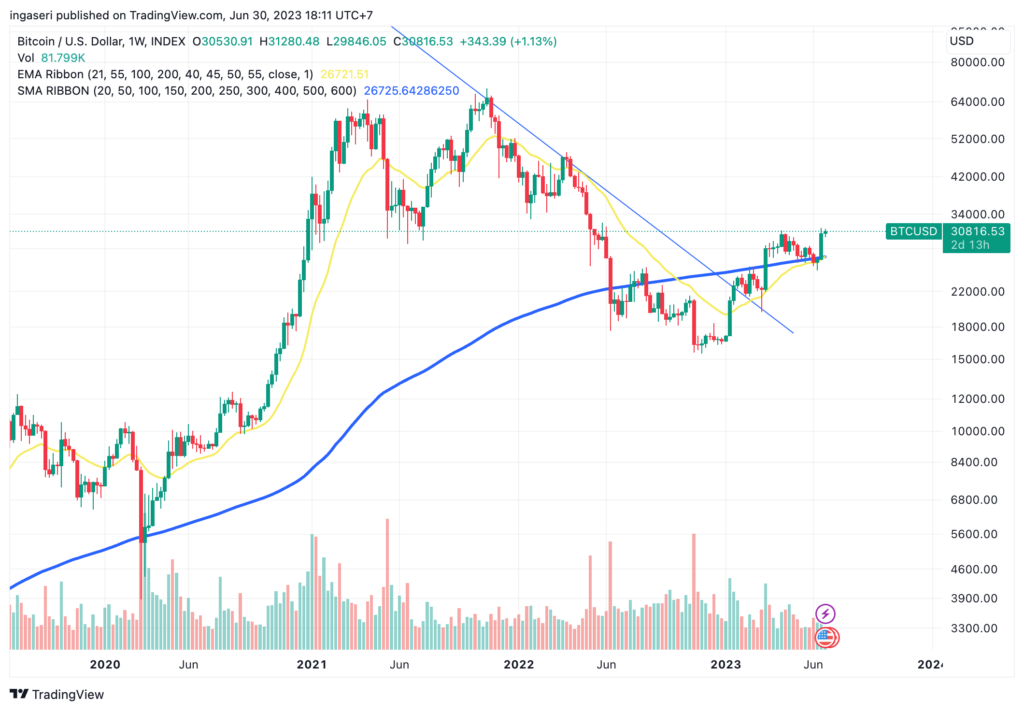
Bitcoin experienced an extraordinary surge last week from $26,500 to over $30,000, peaking at $31,500 before hitting resistance and stabilizing relatively in the $30,000 to $31,000 range. The spike was triggered by the news that Fidelity Investments would follow in BlackRock’s footsteps and seek approval for a bitcoin ETF. However, the price briefly dipped below $30,000 on Wednesday as investors paused to assess the potential timing of SEC approval and the impact of inflationary pressures.
Riding the wave of BTC’s price increase, MicroStrategy (MSTR) announced that it had acquired an additional 12,338 bitcoins between April 27 and June 27, with an average purchase price of $28,136. MicroStrategy’s total bitcoin holdings increased to 152,333 with an average price per BTC of $29,688 across all holdings, and the total asset value of its BTC holdings reached $4.6 billion.
All of last week’s positive news helped drive the price of BTC higher. As shown in the chart below, BTC is well above its 200-week moving average (blue line). On two previous occasions, the price broke out of the descending triangle, which implies a straight up momentum. This time, however, BTC is moving sideways.
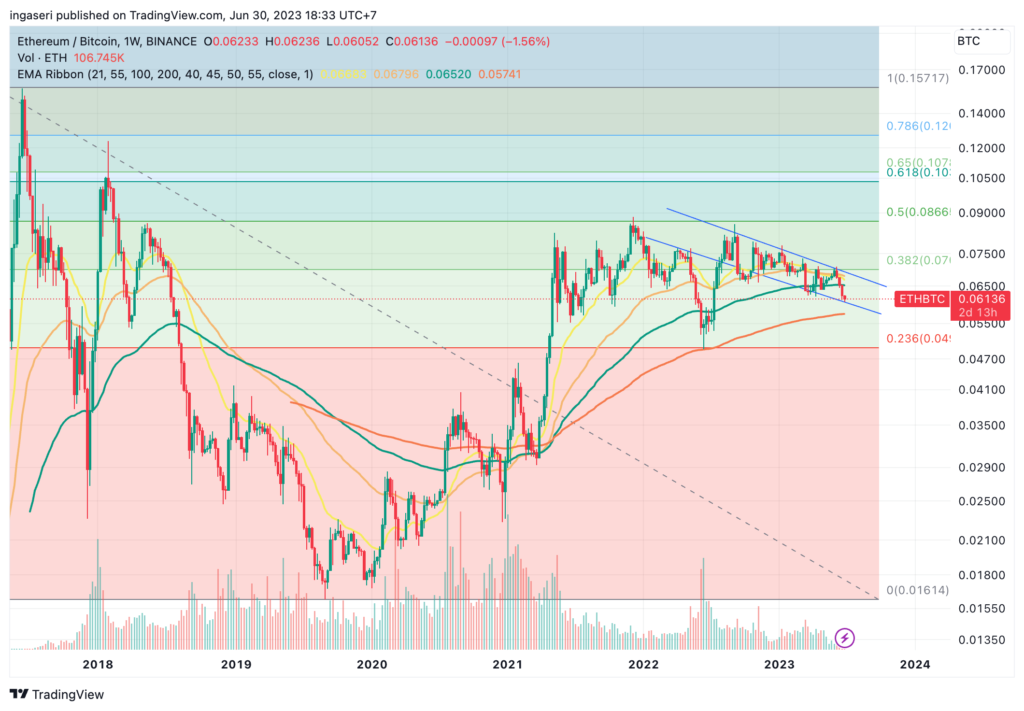
ETH remains in a falling wedge continuation pattern with support at 0.0585. ETH is still expecting upward momentum in the ETH/BTC ratio after successfully breaking the upper support from the falling wedge pattern.
With BTC’s significant rise, bitcoin’s dominance has reached its highest level since April 2021. Resistance is expected at 52%, which has historically served as a strong resistance level.
On-Chain Analysis
- 📊 Exchange: As the exchange reserve continues to rise, it indicates higher selling pressure. Net deposits on exchanges are low compared to the 7-day average. Lower deposits can be interpreted as lower selling pressure.
- 💻 Miners: Miners’ are selling more holdings compared to its one-year average. Miner’s revenue is in a moderate range, compared to its one-year average.
- 🔗 On-chain: More investors are selling at a profit. In the middle of a bull market, it can indicate a market top. Long term holders’ movement in the last 7days were lower than the average. They have a motive to hold their coins. Investors are in an anxiety phase where they are currently in a state of moderate unrealized profits.
- 🏦 Derivatives: Long position traders are dominant and are willing to pay to short traders. Buying sentiment is dominant in the derivatives market. More buy orders are filled by takers. As open interest decreases, it indicates investors are closing futures positions and possibility of trend reversals. In turn, this might trigger the possibility of long/short-squeeze caused by sudden price movement or vice versa.
- 🔀 Technicals: RSI indicates a neutral condition. Stochastic indicates a neutral condition where the current price is in a moderate location between the highest-lowest range of the last 2 weeks.
News About Altcoins
- Ethereum Name Service (ENS) has announced plans for expansion into the Layer 2 ecosystem. The proposed expansion aims to achieve interoperability with ENS domains on Layer 2 solutions, as well as marking a significant advancement for the future, with the objective of making domain name registration and trading more accessible to a broader range of users. The expansion plan involves utilizing off-chain resolvers and leveraging off-chain ENS registration contracts and various service providers such as cb.id, Lens Protocol, and OptiNames. Additionally, this year will see the introduction of DNS domain trading as NFTs on the Ethereum blockchain, with hopes to support “gasless” domain imports by the end of the year.
- ZkSync has revealed ZK Stack. ZK Stack is a flexible framework designed for a collection of personalized blockchains known as Hyperchains within the Ethereum layer-2 ecosystem. These Hyperchains, similar to Optimism’s Superchains, will function as an additional layer built on top of the existing layer-2 protocol. They will offer composability and interoperability, enabling fast liquidity and flash loan transfers between different protocols. The purpose of these Hyperchains is to cater to the needs of various projects, including gaming platforms, social networks, exchanges, and financial institutions, that require specific features such as enhanced privacy, speed, and data availability.
News from the Crypto World in the Past Week
- Azuki’s New Collection Draws Negative Attention. Azuki, one of the most popular anime NFT collections, recently released the Elementals collection which earned $38 million US dollars in just 15 minutes. However, the situation took a 180-degree turn when the Elementals holders sold their collections below the original price after being disappointed to see that the artwork was not much different from Azuki’s previous collections.
Cryptocurrencies Market Price Over the Past Week
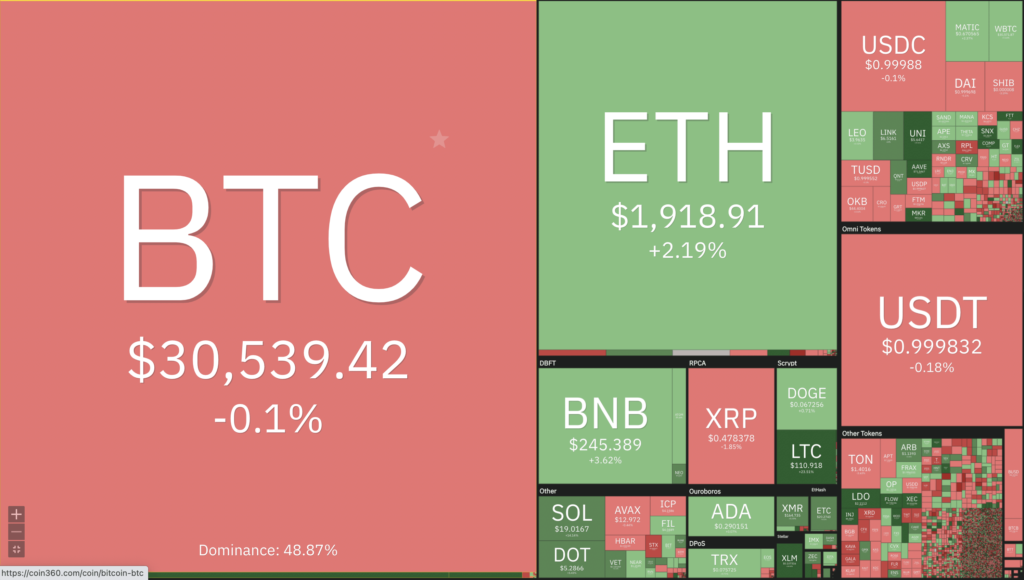
Cryptocurrencies With the Best Performance
- Flow (FLOW) +31,46%
- Compound (COMP) +17,22%
- Maker (MKR) +7,14%
- Uniswap (UNI) +6,42%
Cryptocurrencies With the Worst Performance
- Neo (NEO) -6,45%
- Rocket Pool (RPL) -6,37%
- VeChain (VET) -3,03%
- ApeCoin (APE) -2,68%
References
- Vishal Chawla, Ethereum Name Service plans expansion to Layer 2 ecosystem, Theblock, accessed on 2 July 2023.
- Cam Thompson, Azuki ‘Elementals’ Mint Mishap Highlights the Fragile State of the NFT Market, accessed on 2 July 2023.
- zkSync, Meet ZK Stack, Twitter, accessed on 2 July 2023.