
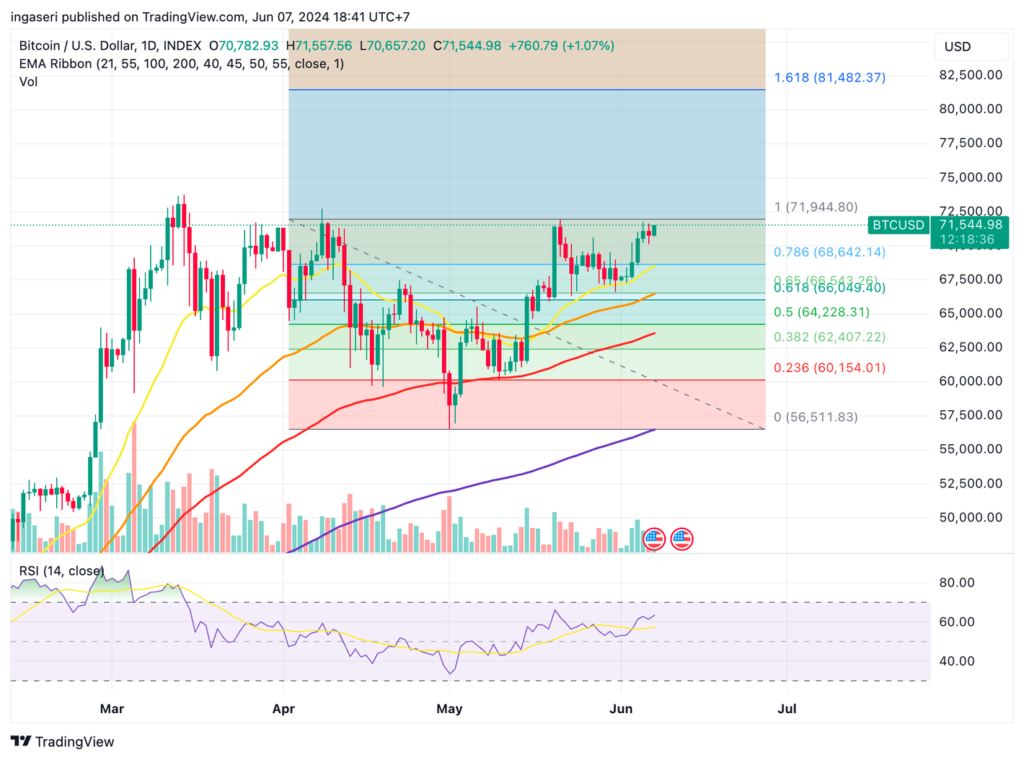
Bitcoin (BTC) surged to $71,000 again on June 5, fueled by the highest inflow of US spot Bitcoin ETF funds since March 2024, reaching $880 million. Overall, the crypto market sentiment remains bullish, with investors anticipating continued growth in BTC prices. Read the full analysis below for a deeper dive.
As usual, the Pintu trading team has gathered critical information and analyzed the general economic situation and the crypto market’s movements over the past week. However, it should be noted that all information in this Market Analysis is intended for educational purposes, not as financial advice.
Market Analysis Summary
- 🟢 If BTC can break through the key resistance level of $72,000, it is predicted to reach a new all-time high (ATH).
- ✍🏻 Interest rates are predicted to remain unchanged in the near future.
- 💪🏻 US consumer spending on personal consumption remained at $20.1 trillion in April.
- 💼 US unemployment claims rose to a four-week high of 229,000, with no significant indications of an increase in layoffs.
- 📉 US job openings fell to 8.059 million at the end of April, the lowest level since February 2021.
Macroeconomic Analysis
PCE Price Index
April’s data on the Fed’s preferred inflation measure, the personal consumption expenditures (PCE) price index, suggests that the central bank will likely maintain current interest rates for now. While the data doesn’t worsen the outlook, it shows slow progress towards the Fed’s inflation targets.
According to the Bureau of Economic Analysis, the headline PCE price index increased by 0.3% in April, marking the slowest monthly rise since December. Year on year, the index rose by 2.7%, compared to the Fed’s 2% annual inflation target.
After a sharp decline in the second half of 2023, the downward trend in inflation has largely stalled in 2024. April’s figures continue this pattern without indicating a troubling acceleration that might force the Fed to reconsider raising interest rates.
April also saw steady, albeit slower, growth in income and spending, which is a positive sign for the Fed. These figures suggest a resilient U.S. labor market and an economy gradually cooling off from previous overheated conditions.
Fed officials have stressed the need for more concrete evidence of inflation moving towards their 2% target before adjusting interest rates. Although Friday’s data does not provide the necessary confidence, it also does not complicate the current economic picture.
The Federal Open Market Committee’s next meeting is scheduled for June 12. As of Friday morning, interest-rate futures suggested a 99% probability that rates would remain unchanged at that meeting.
Other Economic Indicators
- Core PCE Index: The core personal consumption expenditures (PCE) price index, which excludes food and energy, slightly missed expectations in April. According to the Bureau of Economic Analysis, the core PCE price index increased by 0.24917% in April, which rounds to 0.2%. This was just below the economists’ consensus forecast of a 0.255% rise, which rounds to 0.3%. In March, the core PCE price index rose by 0.33416%, rounding to 0.3%, so the April slowdown to 0.24917% is notable. On a year-over-year basis, the core PCE price index increased by 2.8% in both March and April, matching the consensus expectations.
- Personal Spending: According to the Bureau of Economic Analysis, consumer spending for personal consumption in the US reached $20.1 trillion in April, an increase of 0.2% but short of expectations of a 0.3% rise. Personal income also increased 0.3% to $23.8 trillion in April, in line with expectations. Personal disposable income rose 0.2% to $20.8 trillion, with the savings rate remaining low at 3.6%, the same as March. Although increased consumer spending is positive for the economy, low savings rates indicate that consumers may be depleting their savings to maintain spending habits.
- Manufacturing PMI S&P: The S&P Global US Manufacturing PMI for May increased to 51.3, up from 50.0 in April, signaling a modest enhancement in the manufacturing sector’s health for the fourth time in the last five months. This figure surpassed the predicted reading of 50.9.
- Manufacturing ISM: In May, the Manufacturing PMI dropped to 48.7 percent, a 0.5 percentage point decrease from April’s 49.2 percent. Despite this decline, the overall economy has remained in expansion for 49 consecutive months, following a brief contraction in April 2020. Historically, a Manufacturing PMI® above 42.5 percent signals economic expansion over time.
- Service PMI S&P: S&P Global’s May U.S. Services PMI reached 54.8, the highest in a year, marking the 16th consecutive month of expansion. The U.S. service sector saw significant growth, rebounding from April’s dip due to a surge in new business, alongside a similar uptick in manufacturing. However, services employment declined for the second month, as companies hesitated to hire amid uncertainty. Despite this, wage pressures drove up input costs, leading to a faster increase in selling prices and highlighting persistent inflation concerns.
- Service PMI ISM: The Institute of Supply Management (ISM) has published its May services purchasing managers’ index (PMI). The headline composite index rose to 53.8, exceeding the forecast of 51.0. This is the highest level the index has reached in the past nine months, signaling a return to expansion after a brief period in contraction.
- JOLTs Job Opening: U.S. job openings dropped more than anticipated in April, reducing the number of available positions per job-seeker to its lowest point in almost three years. This decline indicates a softening labor market, potentially aiding the Federal Reserve’s efforts to control inflation. According to the Labor Department’s Bureau of Labor Statistics’ Job Openings and Labor Turnover Survey (JOLTS), job openings fell by 296,000 to 8.059 million at the end of April, the lowest level since February 2021.
BTC Price Analysis
BTC’s price surpassed market predictions by climbing 5% over the past week, reaching $71K, nearing the key resistance level of $72K. The overall market sentiment remains bullish, with BTC trending within a flag pattern that suggests a potential 45% rally.
A more realistic target is a rise to the current all-time high of $73,650. Surpassing this level would set a new ATH for BTC.
On-Chain Analysis
- 📊 Exchange: As the exchange reserve continues to fall, it indicates lower selling pressure. Net deposits on exchanges are high compared to the 7-day average. Higher deposits can be interpreted as higher selling pressure.
- 💻 Miners: Miners’ are selling less holdings compared to its one-year average. Miner’s revenue is in a moderate range, compared to its one-year average.
- 🔗 On-Chain: More investors are selling at a profit. In the middle of a bull market, it can indicate a market top. Long term holders’ movement in the last 7 days was lower than the average. They have a motive to hold their coins. Investors are in a belief phase where they are currently in a state of high unrealized profits.
- 🏦 Derivatives: Long position traders are dominant and are willing to pay to short traders. Selling sentiment is dominant in the derivatives market. More sell orders are filled by takers. As OI increases, it indicates more liquidity, volatility, and attention are coming into the derivative market. The increasing trend in OI could support the current ongoing price trend.
- 🔀 Technicals: RSI indicates a neutral condition. Stochastic indicates a neutral condition where the current price is in a moderate location between the highest-lowest range of the last 2 weeks.
News About Altcoins
- Memecoins Plummet Amid “Roaring Kitty” Livestream Comeback. A group of GameStop-inspired memecoins, including GME and ROAR, plunged by as much as 31% during Keith Gill’s (“Roaring Kitty”) first livestream in three years. Despite a surge in triple digits in overnight trading, GME and ROAR fell by 24% and 31% respectively, and KITTY dropped 17% by the end of the 45-minute stream. None of these memecoins are officially affiliated with Gill, whose influence in 2021 sparked a retail frenzy in stocks like GameStop. Concurrently, GameStop’s NYSE stock dropped by 40%, and the broader crypto market faced selling pressure, with Bitcoin down 2.7%.
News from the Crypto World in the Past Week
- Trump vows to be ‘crypto president’ at San Francisco fundraiser. During an exclusive fundraiser in San Francisco that raised $12 million, Donald Trump vowed to be a “crypto president” while criticizing Democrats’ regulatory approach to the industry. The event, hosted by venture capitalists David Sacks and Chamath Palihapitiya, was attended by notable crypto leaders, including Coinbase executives Tyler and Cameron Winklevoss. Despite San Francisco’s liberal reputation, many local venture capitalists and crypto investors support Trump due to concerns about regulation under President Joe Biden’s administration. While Trump has not offered specific policy proposals for the crypto industry, Biden’s administration has expressed a desire to work with Congress on a regulatory framework that balances innovation with risk protection.
Cryptocurrencies Market Price Over the Past Week
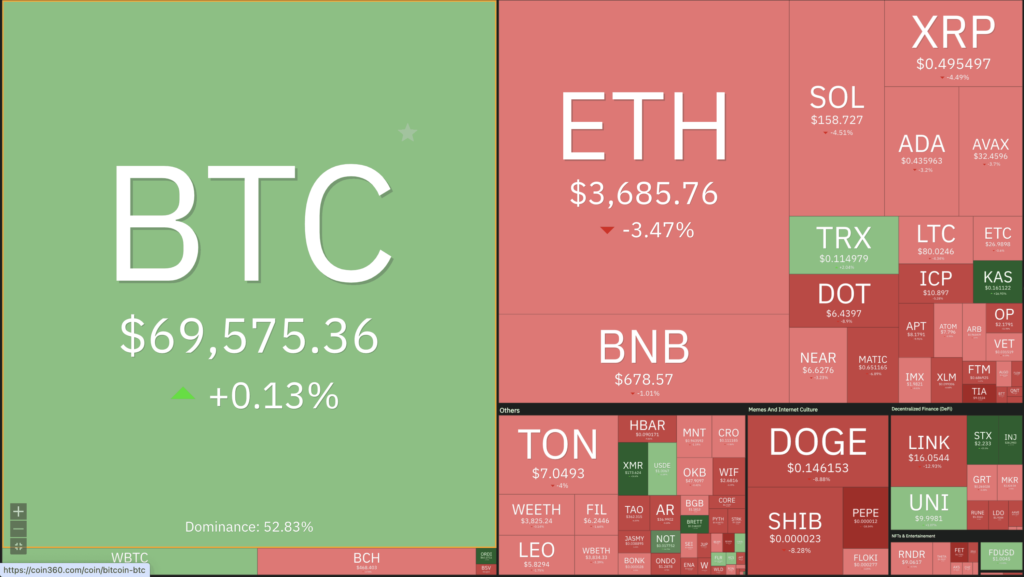
Cryptocurrencies With the Best Performance
- Ordi (ORDI) +23,58%
- Stacks (STX) +19,73%
- Kaspa (KAS) +16,44%
- Injective (INJ) +13,81%
Cryptocurrencies With the Worst Performance
- Beam (BEAM) -21,41%
- Celestia (TIA) -20,92%
- Lido DAO (LDO) -20,64%
- Chiliz (CHZ) -19,68%
References
- Elizabeth Napolitano, GME, other memecoins fall with GameStop as Roaring Kitty livestream draws huge audience, theblock, accessed on 9 June 2024.
- Mike Millard, Trump reportedly tells $12m San Francisco fundraiser he would be ‘crypto president’, dlnews, accessed on 9 June 2024.