
In response to the Federal Reserve’s tightening of monetary policy, bitcoin (BTC) has fallen to its lowest level in three months. Similarly, Ethereum continues to trend lower, maintaining support at the 200-day moving average. So far, it remains uncertain whether BTC and ETH will continue their bearish trajectory, or if they will reverse and begin a bullish trend. For an in-depth analysis, please see the full report below.
The Pintu trading team has gathered critical information and analyzed the general economic situation and the crypto market’s movements over the past week. However, it should be noted that all information in this Market Analysis is intended for educational purposes, not as financial advice.
Market Analysis Summary
- 🆘 The Federal Reserve has halted the rise in interest rates over the past 15 months and signaled a continuation of monetary tightening to combat inflationary pressures. The benchmark federal funds rate remains within a target range of 5% to 5.25%.
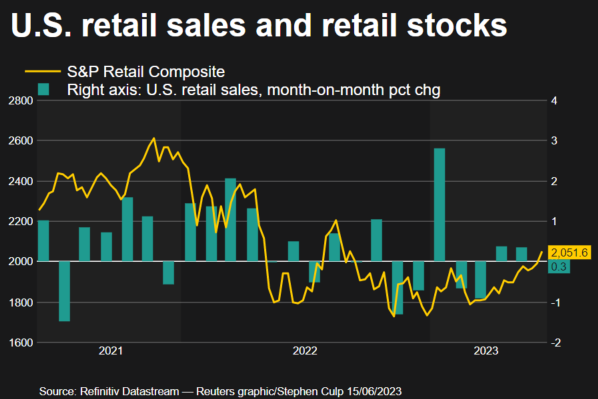
- 💪🏻 Retail sales in the U.S. experienced an increase of 0.3% in May following a 0.4% rise in April, demonstrating sustained consumer demand in spite of economic obstacles.
- 📉 Import prices saw a decline in May, and the year-on-year price decrease is the largest in the last three years. This offers encouraging news in relation to inflation.
- ✍🏻 The crypto market has responded negatively to The Fed’s monetary tightening, with Bitcoin falling to its lowest level in the last three months. At present, BTC is trading around US$26,000, and ETH has found support in the 200-day Moving Average zone at a price of US$1,600.
Macroeconomic Analysis
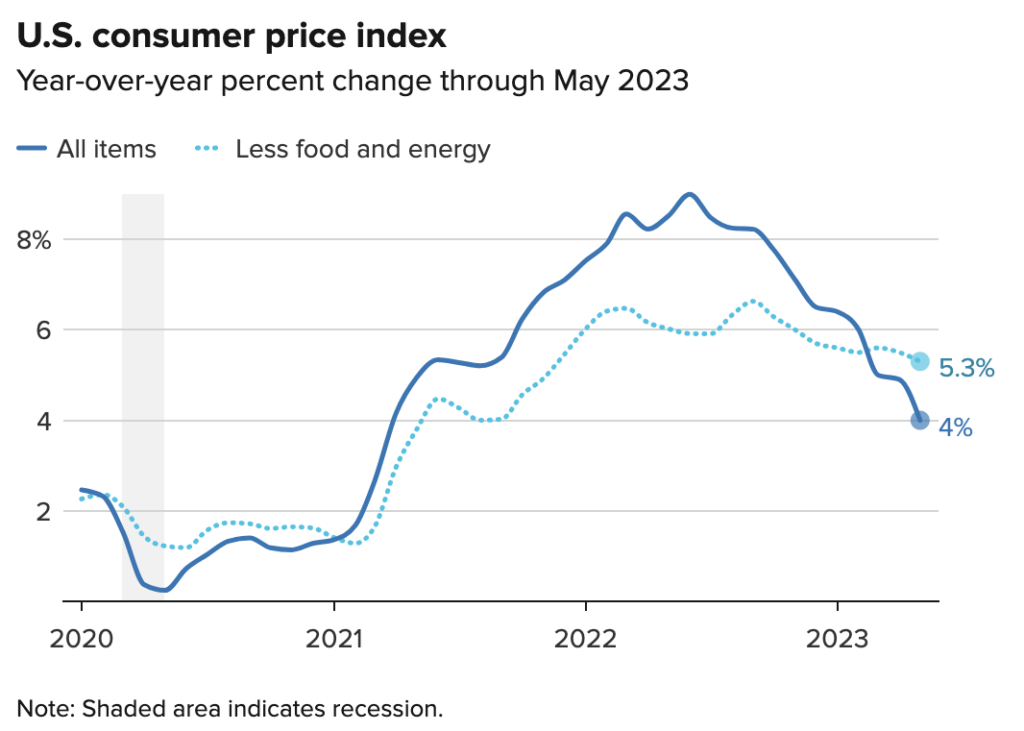
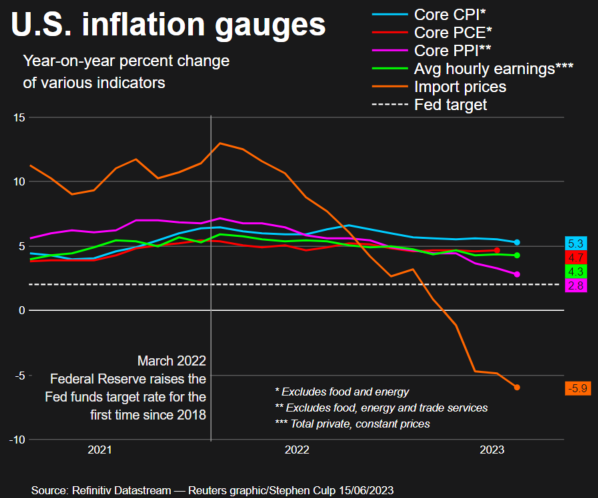
The Consumer Price Index (CPI) and the core price index, which excludes food and energy, are showcasing a downturn in their annual growth rates, signifying a diminution of inflation from its zenith last year. As per the data disseminated on Tuesday by the Bureau of Labor Statistics, the year-on-year inflation currently stands at 4% (versus consensus 4.1% vs. preceding 4.9%), achieving the nadir level since March 2021. This downward trajectory is predominantly driven by the reduction in energy prices, encompassing gasoline and electricity. However, there are certain facets of household budgets that have not manifested significant amplification in recent months, potentially becoming a cause for apprehension.
Both the Consumer Price Index (CPI) and the core CPI, excluding food and energy components, are indicating a decrease in their annual growth rates, reflecting a contraction in inflation since its apogee last year. Based on the data divulged on Tuesday by the Bureau of Labor Statistics, the year-on-year inflation currently resides at 4% (versus the consensus of 4.1% and previous 4.9%), marking the lowest level since March 2021. This descent is primarily propelled by a reduction in energy prices, including gasoline and electricity. Nonetheless, certain aspects of household budgets have not exhibited substantial increments in the recent months, which could potentially be a matter of concern.
This week’s macroeconomic market analysis commences with a contraction in the annual growth rate of both the Consumer Price Index (CPI) and the core CPI, which excludes food and energy. Additionally, inflation has also receded since reaching its zenith in 2022. This inflation contraction is corroborated by the data released by the United States Bureau of Labor Statistics, documenting a current year-over-year inflation rate of 4% (versus the consensus of 4.1% and the preceding 4.9%)—the lowest mark since March 2021. This contraction is primarily propelled by diminishing energy prices, encompassing both gasoline and electricity. However, certain aspects of household budgets that have yet to display significant increments in recent months warrant closer inspection and could potentially be a focal point of concern.
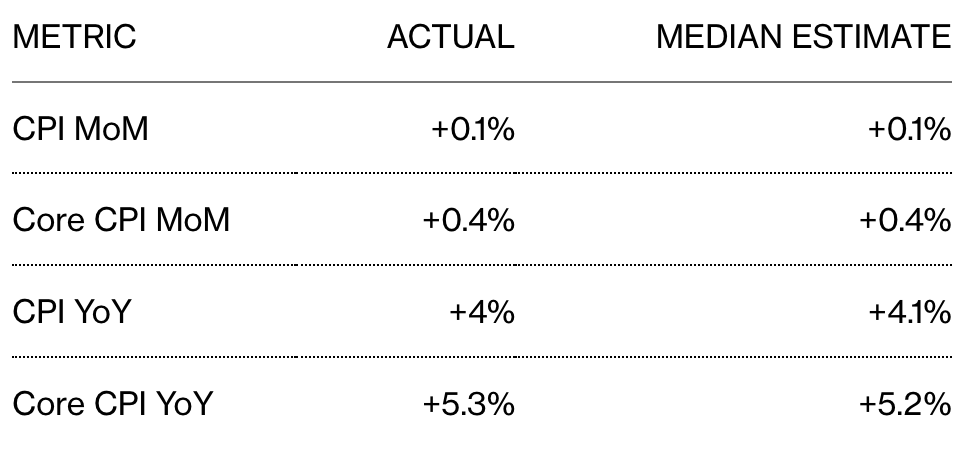
Nevertheless, a critical measure of price levels that the Federal Reserve closely monitors continues to rise at an alarming rate. Specifically, the core CPI managed to maintain its 0.4% increase for the third consecutive month, in line with expectations. On the other hand, the headline CPI posted a smaller increase of 0.1% (versus the consensus of 0.2% and the previous 0.4%), which was mitigated by lower gasoline prices.
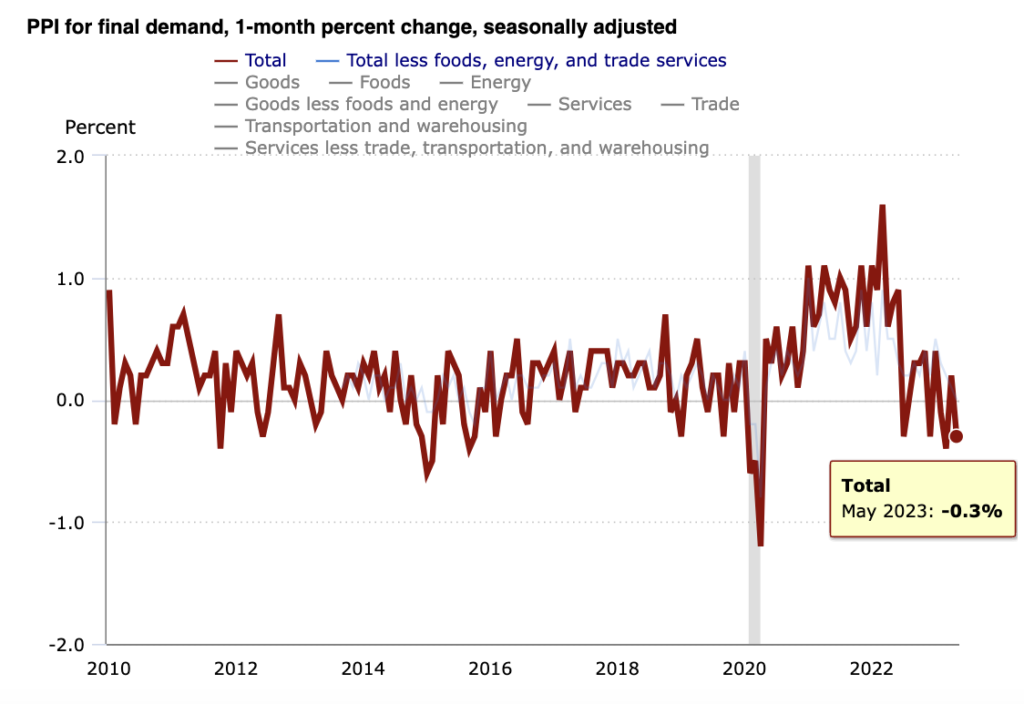
The U.S. Producer Price Index (PPI) for May showed a monthly decline of -0.3%, below the expected increase of -0.1%. Broken down, the PPI for goods fell to -1.6% on a monthly basis, while the PPI for services rose by 0.2%. However, the overall PPI excluding food, energy and trade services was unchanged from the previous month.
On a year-over-year basis, the PPI surprisingly decelerated from 3.1% to 2.8% for the 12-month period ending in May. This figure was lower than the anticipated 2.9%. Even when omitting food, energy, and trade services from the PPI data, there was a deceleration from the previous 3.3% to 2.8% year-on-year.
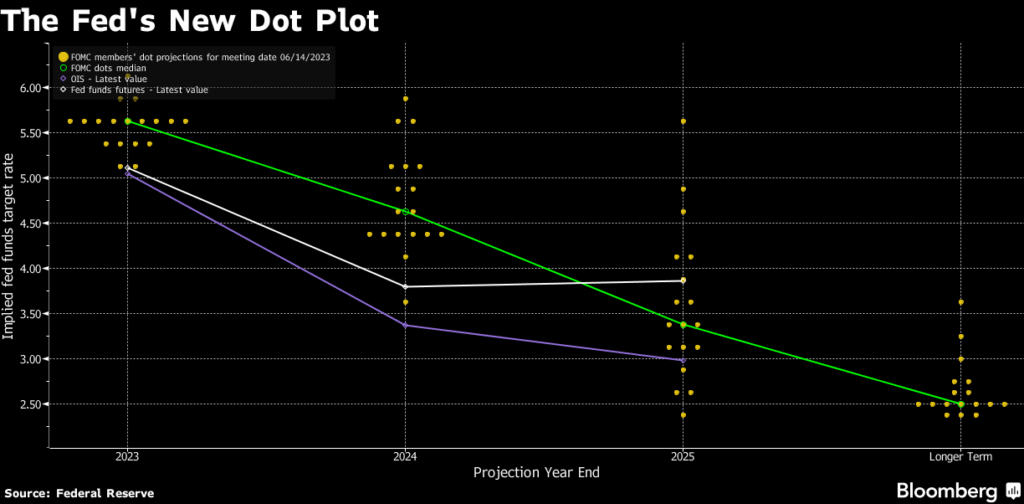
Following the Federal Reserve’s decision last Wednesday to stop raising interest rates after 15 months of continuous increases, the central bank signaled its intention to resume tightening measures to combat inflationary pressures.
In the wake of this decision, the benchmark federal funds rate remains within the target range of 5% to 5.25%. The Fed’s latest quarterly projections anticipate borrowing costs will climb to 5.6% by year-end, compared to last year’s projection of 5.1%. This increase refers to the median projection.
In terms of the Fed’s decision, the vote was unanimous among the Federal Open Market Committee (FOMC). Of the 18 policymakers, 12 projected rates above the median range of 5.5% to 5.75%, indicating a consensus among the majority of policymakers that further tightening remains necessary to combat inflationary pressures. In addition, Fed officials are expected to raise rates two quarter-point increases or a half-point increase by the end of 2023.
In response to the Fed’s vote, the S&P 500 Index showed a downward trend. In contrast, the depreciation of the U.S. dollar against a basket of currencies seemed to slow. In addition, the yield on the two-year Treasury note rose significantly to its highest level since March 2023.
Amid the current economic slowdown, Fed officials are projecting mixed signals. According to a survey, consumer confidence in the economy declined in May; however, there was an increase in consumer spending in April.
The labor market sector also experienced an improvement. Fed Chairman Jerome Powell stated that employers added about 339,000 jobs to payrolls in May and that job openings remain at high and highly competitive levels.
Further improvement was seen in the personal consumption expenditures index, the Fed’s preferred measure, which rose 4.4% over the 12 months ending in April. This positive increase comes amid a still relatively high inflation rate that’s receding from last year’s peak.
In May, the Labor Department’s Consumer Price Index showed further cooling, and the details of the data presented encouraging signs of an economic slowdown just ahead of the Fed officials’ meeting on Tuesday morning.
In a surprise development on Thursday, U.S. retail sales rose in May, pointing to continued strength in consumer demand despite mounting economic hurdles.
According to data released by the U.S. Department of Commerce on Thursday (15/6), retail purchases rose 0.3% after a 0.4% increase in April (vs. consensus of -0.1%), or on a year-over-year basis, retail sales rose 1.6% in May. However, excluding auto and gasoline sales, retail sales still showed growth, rising 0.4%.
Amid the aforementioned improving conditions, it is speculated that the Fed may still consider raising interest rates next month if there are strong demand indicators. However, such a decision will depend heavily on the upcoming employment and inflation reports for the month of June.
There is some good news on the inflation front. A separate Labor Department report released Thursday showed that import prices fell in May, and the annual price decline was the largest in three years.
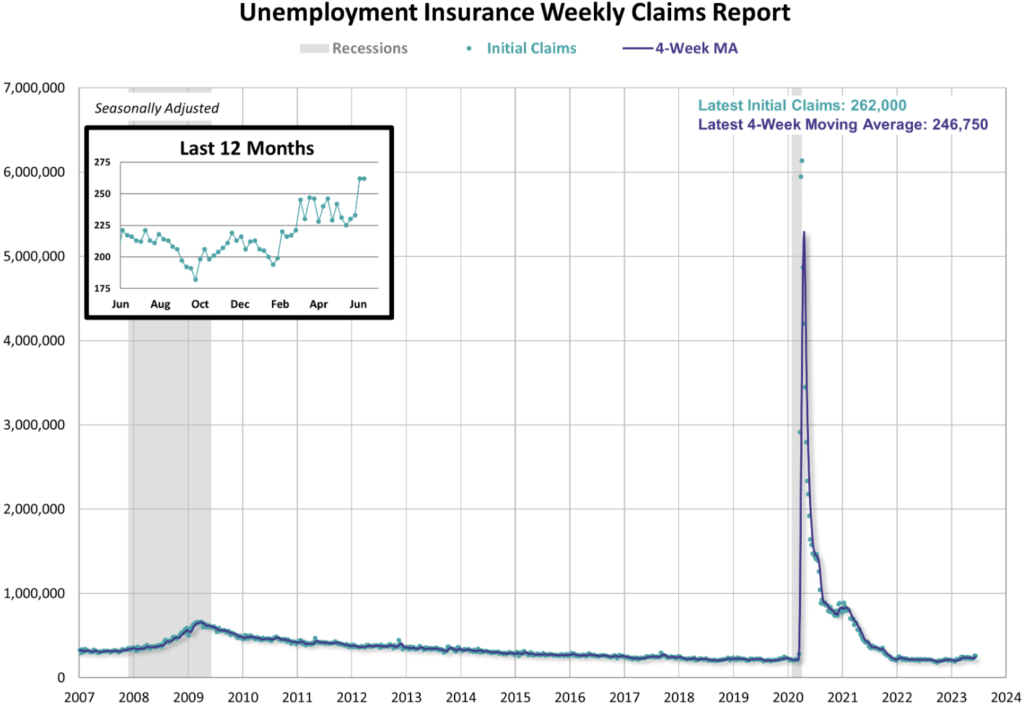
Reviewing the data on initial claims for state unemployment benefits, there remains no change in seasonally adjusted figures, standing at 262,000 for the week ending on June 10th. This claims level is consistent with figures observed in October 2021. In fact, economists had anticipated approximately 249,000 claims for this week, indicating a slight disparity from prior predictions, with initial claims persisting at the highest level since October 2021.
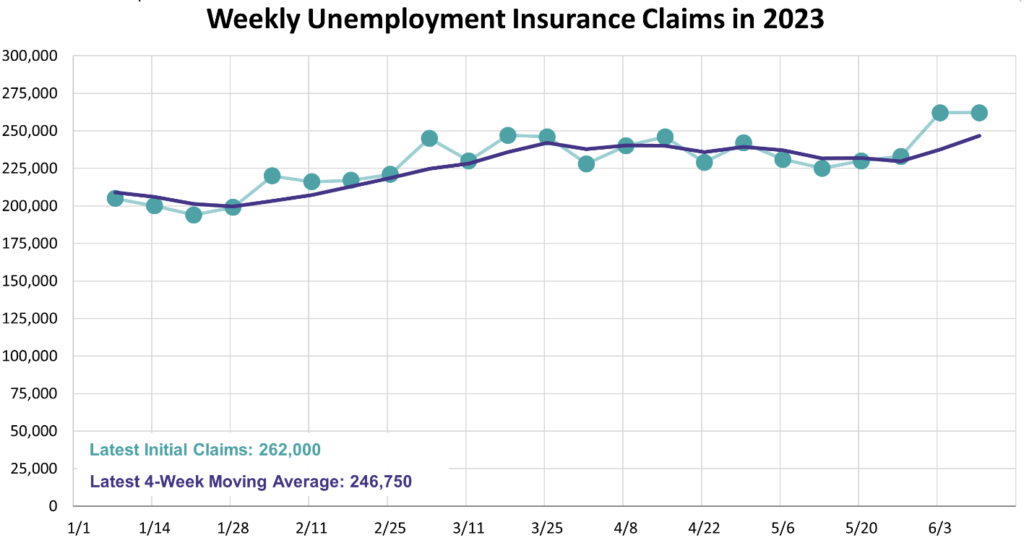
On the other hand, the four-week moving average provides a more comprehensive view of the overall pattern and currently stands at 246,750, an increase of 9,250 from the previous week’s reading. The current four-week moving average is the highest since November 2021.
BTC & ETH Price Analysis
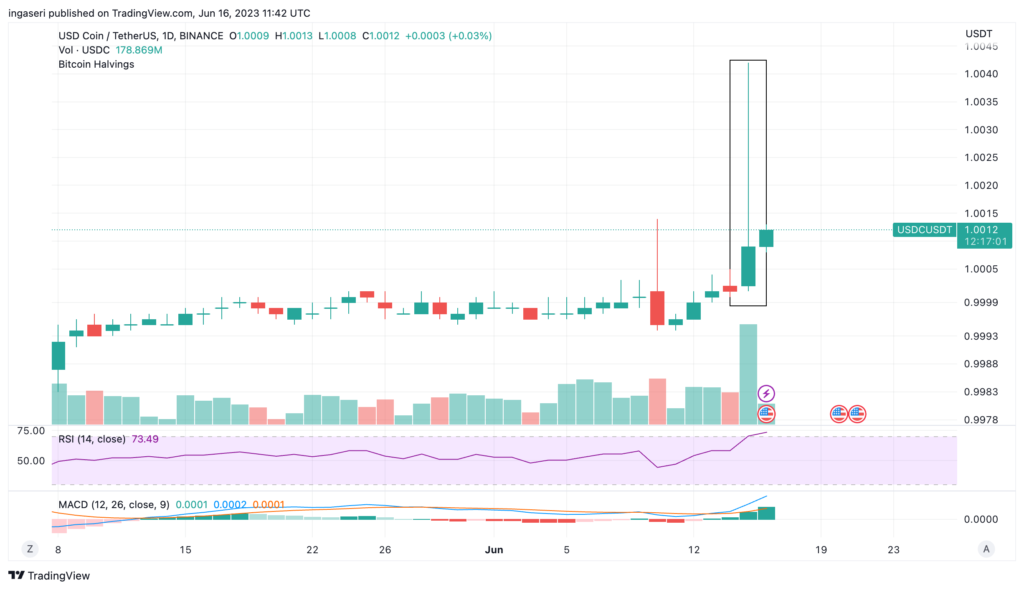
Turning to crypto market analysis, on June 15th, the USDT (Tether) stablecoin experienced a slight deviation from its peg to the US dollar. This deviation was caused by an imbalance in Curve’s 3pool, resulting in a 0.3% decline in the price of USDT, which settled at around $0.997. Meanwhile, its weighting in the Curve 3pool rose to over 70%, exceeding its typical level of 33.1%. Ultimately, this discount was resolved the following day.
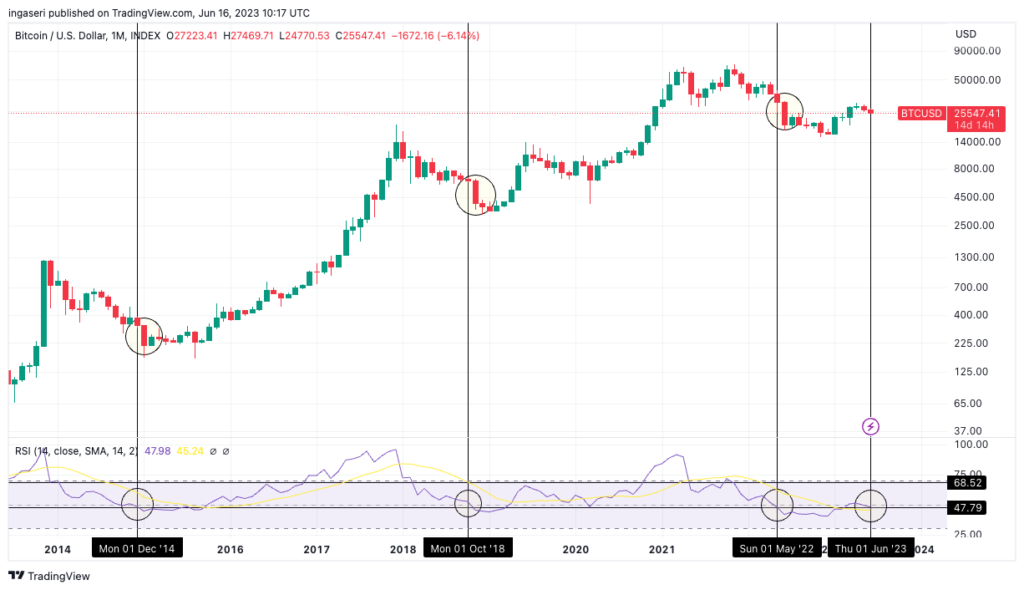
Negative sentiment also caused bitcoin to fall to its lowest level in the past three months. As the Federal Reserve’s determination to tighten monetary policy increased, the crypto market reacted negatively. This tightening caused BTC to fall below a key price level on Wednesday of last week. The drop in BTC marked the first time since mid-March that it had fallen below this threshold. Despite the central bank’s decision to delay interest rate hikes for the first time in 14 months, market sentiment caused a significant drop in the crypto market. Currently, BTC is trading around $26,000, a level it has been hovering around for several weeks prior to the tightening event.
When the Relative Strength Index (RSI), an indicator commonly used by analysts to compare the bullish and bearish momentum of prices, reached the support level of 48, historical data shows that on three previous occasions it crossed below the 48 level, resulting in significant price corrections. In those instances, BTC experienced price corrections ranging from 33% to 37%. If BTC were to experience a 37% correction from its current price, it would reach $16,000, coinciding with the largest institutional volume profile. Currently, BTC has support at the 200-day moving average (MA) at a price of $23,700.
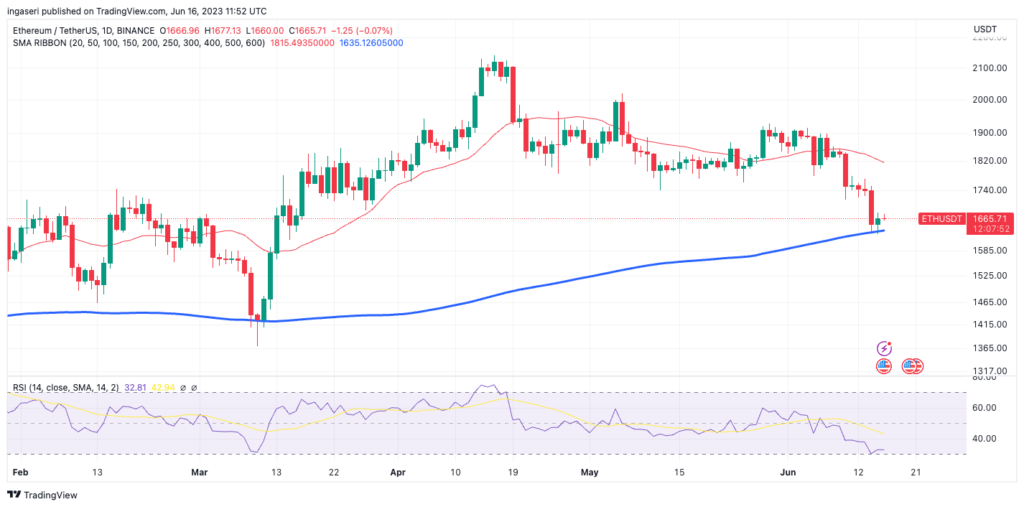
Similar to BTC, ETH also encountered resistance at the 21-day moving average (MA) at a price of $1,850 on the daily chart, resulting in a subsequent drop below $1,800. ETH continues to trend lower, but still finds support at the 200-day moving average (MA) at $1,600.
The 200-day MA is an important trend indicator. If the price of ETH falls below this level, the market will face bearish sentiment, which could lead to a drop in the price of ETH towards the $1,300 area.
On-Chain Analysis
- 📊 Exchange: As the exchange reserve continues to rise, it indicates higher selling pressure. Net deposits on exchanges are low compared to the 7-day average. Lower deposits can be interpreted as lower selling pressure.
- 💻 Miners: Miners’ are selling more holdings compared to its one-year average. Miner’s revenue is in a moderate range, compared to its one-year average.
- 🔗 On-chain: More investors are selling at a profit. In the middle of a bull market, it can indicate a market top. Long term holders’ movement in the last 7days were lower than the average. They have a motive to hold their coins. Investors are in an anxiety phase where they are currently in a state of moderate unrealized profits.
- 🏦 Derivatives: Long position traders are dominant and are willing to pay to short traders. Buying sentiment is dominant in the derivatives market. More buy orders are filled by takers. As open interest decreases, it indicates investors are closing futures positions and possibility of trend reversals. In turn, this might trigger the possibility of long/short-squeeze caused by sudden price movement or vice versa.
- 🔀 Technicals: RSI indicates a neutral condition. Stochastic indicates a neutral condition where the current price is in a moderate location between the highest-lowest range of the last 2 weeks.
News About Altcoins
- Polygon Launches Polygon 2.0 Blueprint to Build the Best Value Layer. According to a tweet from Polygon Labs, Polygon has announced the launch of Polygon 2.0. This is a unified network of Layer 2 chains supported by Zero-Knowledge (ZK) technology that aims to build a value layer for the Internet. This upgrade includes aspects of protocol architecture, token economics and governance, all aimed at achieving scalable and integrated liquidity. Polygon plans to roll out the components of Polygon 2.0 in the coming weeks and will discuss future development directions and community governance.
- Ethereum Foundation announces $12.91 million in grants to support innovation and ecosystem growth. The Ethereum Foundation has announced the recipients and allocation of funds for the first quarter of 2023. A total of $12.91 million has been allocated to projects and communities such as BuildETH 2023, ETH Beijing Hackathon and ETHDam. The grants cover various categories, including community and education, consensus layer, execution layer, cryptography and zero-knowledge proofs, developer experience and tools, layer 2 solutions, protocol growth and support, and others.
News from the Crypto World in the Past Week
- PEPE added to Bappebti’s authorized crypto asset list. The Indonesian Commodity Futures Trading Regulatory Agency (Bappebti) has issued new regulations regarding the list of crypto assets that can be traded in Indonesia. Users are required to trade on crypto exchanges that have obtained licenses from Bappebti and use crypto assets listed in the said list. Currently, the list includes a total of 501 crypto assets, including BTC, ETH, LTC, SOL, XRP, PEPE, and others.
- BlackRock, a global investment management company headquartered in New York and the world’s largest asset manager, is reportedly planning to launch a bitcoin exchange-traded fund (ETF). This ETF is designed to track the price of bitcoin, allowing investors to trade on traditional exchanges such as the New York Stock Exchange or Nasdaq, bypassing the technical aspects of bitcoin ownership such as storage and security. While previous companies have struggled to gain approval from the U.S. Securities and Exchange Commission (SEC) to launch a bitcoin ETF, BlackRock’s move could represent a breakthrough in the institutional acceptance and adoption of bitcoin, potentially providing both institutional and retail investors with a more regulated and secure environment to gain exposure to bitcoin.
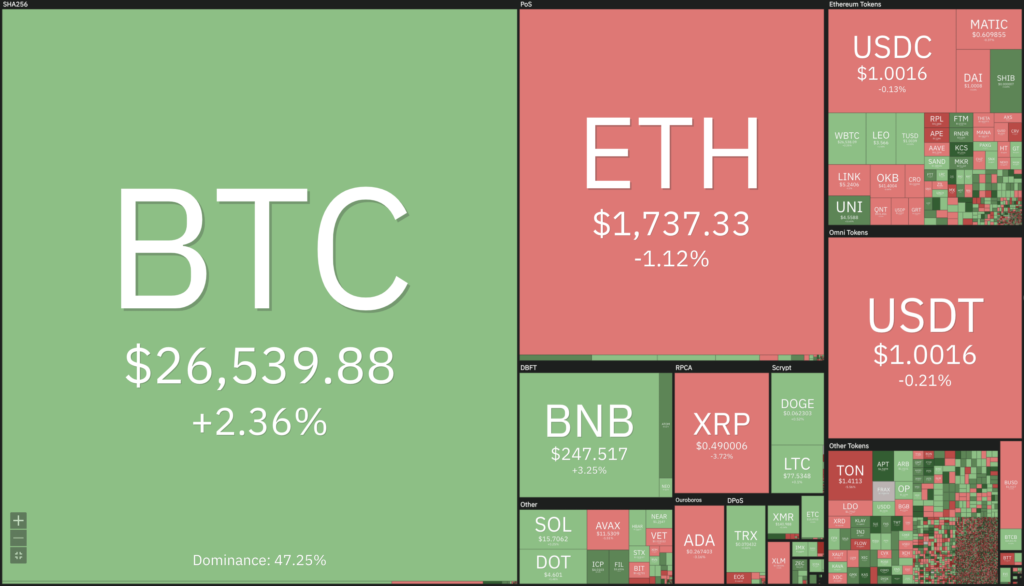
Cryptocurrencies Market Price Over the Past Week
Cryptocurrencies With the Best Performance
- Kava (KAVA) +4,14%
- Stellar (XLM) +2,46%
- Ripple (XRP) +1,95%
- Render (RNDR) +1,79%
Cryptocurrencies With the Worst Performance
- Quant (QNT) -10,40%
- Frax Share (FXS) -5,57%
- Injective Protocol (INJ) -4,80%
- Optimism (OP) -3,26%
References
- 0xPolygonLabs, Our vision for Polygon is simple: to build the Value Layer of the Internet, Twitter, accessed on 18 June 2023.
- Bappebti.go.id, **PERATURAN BADAN PENGAWAS PERDAGANGAN BERJANGKA KOMODITI NOMOR 4 TAHUN 2023, accessed on 18 June 2023.
- Ethereum.org, Allocation Update: Q1 2023, accessed on 18 June 2023.
- Ian Allison, Helena Braun, BlackRock May Have Found Way to Get SEC Approval for Spot Bitcoin ETF, Coindesk, accessed on 18 June 2023.