
Cryptocurrency assets, including Bitcoin (BTC), XRP, Solana, and Cardano, surged following a tweet from U.S. President Donald Trump advocating for the country to move forward with a national crypto reserve plan. Read the full analysis by the Pintu Trader Team.
Market Analysis Summary
- 📝 BTC is currently facing resistance at $89,000 and $91,250. If it fails to break these levels, further declines could push the price toward the next support zones around $81,000 or even lower. However, as of March 3, BTC has rebounded to $92,000, boosting market optimism.
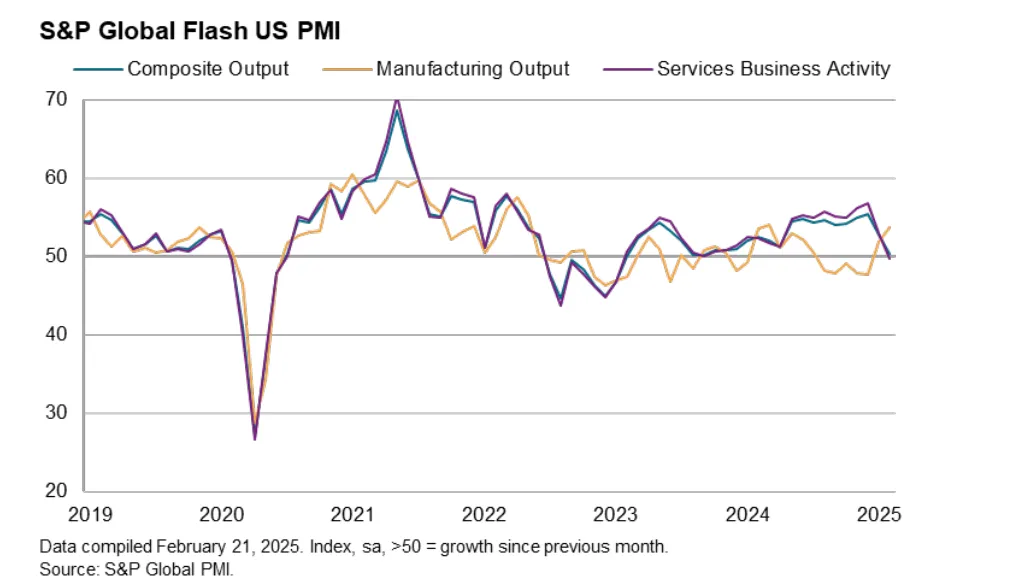
- 🏭 The Manufacturing PMI rose to 51.6, its highest level in eight months.
- 📉 The Services PMI fell to 49.7, signaling contraction for the first time in over two years due to weaker demand and political uncertainty surrounding federal spending cuts and tariffs.
- ⬇️ The Composite PMI, which combines manufacturing and services data, dropped sharply to 50.4 from 52.7 in January, marking a 17-month low and signaling near-stalling business activity.
- 🔴 The Michigan Consumer Sentiment Index, a key measure of consumer confidence in the United States, dropped sharply in February 2025 to 64.7 points from 71.1 in January, marking its lowest level since November 2023.
Macroeconomic Analysis
S&P Global Index
The latest S&P Global Purchasing Managers’ Index (PMI) results for February 2025 reveal mixed signals for the U.S. economy. The Manufacturing PMI rose to 51.6, its highest level in eight months, indicating modest expansion in the manufacturing sector. This improvement was driven by the fastest growth in factory output in nearly a year and easing inventory pressures. However, challenges persist, as new order growth slowed, employment gains nearly stalled, and supplier delivery times remained extended, albeit less severely than before. In contrast, the Services PMI fell to 49.7, signaling contraction for the first time in over two years due to weaker demand and political uncertainty surrounding federal spending cuts and tariffs.
The Composite PMI, which combines manufacturing and services data, dropped sharply to 50.4 from 52.7 in January, marking a 17-month low and signaling near-stalling business activity. Weakness was concentrated in the services sector, where new business inflows stagnated and optimism about future economic conditions declined significantly. This decline reflects growing concerns about federal policies, inflationary pressures, and geopolitical developments. Meanwhile, manufacturing showed resilience with rising production levels, but this was partly attributed to preemptive measures against potential tariff-related cost increases.
These PMI results have significant implications for the broader economy and other indicators. The divergence between manufacturing and services highlights uneven economic performance across sectors. The slowdown in services activity could weigh on overall GDP growth, as services constitute a substantial portion of the U.S. economy. Additionally, rising input costs in manufacturing—driven by tariffs and wage pressures—could reignite inflation concerns, potentially complicating monetary policy decisions by the Federal Reserve. Employment trends are also concerning; while manufacturing hiring barely grew, services employment contracted after months of gains, reflecting heightened uncertainty among businesses.
In summary, while the manufacturing sector shows signs of recovery, the broader economic outlook is clouded by weakening services activity and rising cost pressures. Policymakers will need to monitor these trends closely as they balance inflation control with supporting economic growth amidst ongoing uncertainties.
Other Economic Indicators
- Michigan Consumer Sentiment: The Michigan Consumer Sentiment Index, a key measure of consumer confidence in the United States, dropped sharply in February 2025 to 64.7 points from 71.1 in January, marking its lowest level since November 2023. This decline reflects growing concerns among consumers about economic conditions, particularly inflation and the impact of tariffs.
- Existing Home Sales: In January 2025, existing home sales in the U.S. fell 4.9% month-over-month to a seasonally adjusted annual rate of 4.08 million units, reflecting a slowdown from December’s 10-month high. However, on a year-over-year basis, sales rose by 2.0%, marking the fourth consecutive month of annual increases. The decline in monthly sales was attributed to persistently high mortgage rates, which remained above 6.5% despite the Federal Reserve’s rate cuts in 2024.
- New Home Sales: New home sales in the United States experienced a notable slowdown in January 2025, dropping by 10.5% to a seasonally adjusted annual rate of 657,000 units, marking a three-month low. This decline reflects ongoing affordability challenges, driven by elevated mortgage rates above 6% and high home prices. Compared to a year earlier, the sales pace was down by 1.1%, with inventory levels continuing to rise. The supply of new homes reached nine months, significantly higher than the balanced market level of six months.
- Jobless Claims: Initial jobless claims in the United States rose sharply to 242,000 for the week ending February 22, 2025, marking an increase of 22,000 from the previous week’s revised figure of 220,000. This represents the highest level of claims recorded this year and exceeds economists’ expectations of 225,000.
- Durable Goods: Durable goods orders in the United States surged by 3.1% in January 2025, rebounding strongly from a 2.2% decline in December. This increase, which exceeded economists’ expectations of a 2% rise, brought total orders to $286 billion. The transportation sector was the primary driver of this growth, with transportation equipment orders jumping 9.8%, or $8.6 billion, following two consecutive monthly declines.
BTC Price Analysis
BTC experienced significant volatility over the past week, with its price dropping sharply to as low as $83,500 on February 26, 2025, marking its steepest decline since November 2024. The cryptocurrency broke critical support levels at $90,000 and $89,000, signaling a bearish short-term trend. This drop was driven by global economic uncertainties, including fears of a potential recession and stricter trade policies, which have dampened investor sentiment. Additionally, over $1 billion in leveraged long positions were liquidated during this period, further exacerbating the sell-off. Despite some attempts to consolidate near $88,500, Bitcoin remains below key technical indicators such as its 100-hour simple moving average.
However, crypto investors can breathe a sigh of relief after witnessing BTC’s significant surge on March 3, 2025. This increase was driven by President Trump’s announcement regarding a national crypto reserve plan. Following the announcement, BTC jumped by 10% and is currently trading around $92,000.
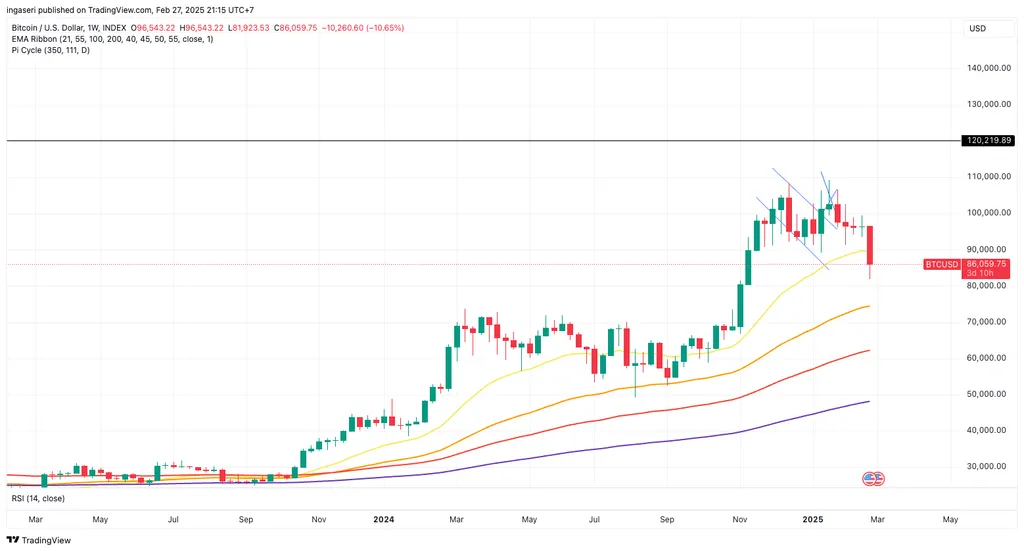
Technical analysis suggests that BTC is currently facing resistance at $89,000 and $91,250. If it fails to break these levels, further declines could push the price toward the next support zones around $81,000 or even lower. The formation of a double-top pattern earlier this month has reinforced bearish momentum, with analysts identifying unfilled liquidity areas between $81,700 and $85,100 that could act as temporary buffers. Meanwhile, some large investors or “whales” have been accumulating Bitcoin during this downturn, indicating confidence in its long-term potential despite the current bearish environment.
While the medium-term outlook for BTC has turned neutral to bearish due to the recent correction, the long-term trend remains cautiously optimistic. Large-scale institutional purchases and whale activity suggest continued interest in Bitcoin as a store of value. However, in the short term, market participants are closely monitoring macroeconomic developments and technical resistance levels to gauge whether Bitcoin can recover or if further declines are imminent. This period of heightened volatility underscores the challenges facing cryptocurrency markets amidst broader economic uncertainty.
On-Chain Analysis
- 📊 Exchange: As the exchange reserve continues to fall, it indicates lower selling pressure. Net deposits on exchanges are high compared to the 7-day average. Higher deposits can be interpreted as higher selling pressure.
- 💻 Miners: Miners’ are selling holdings in a moderate range compared to its one-year average. Miner’s revenue is in a moderate range, compared to its one-year average.
- ⛓️ On-chain: More investors are selling at a loss. In the middle of a bear market, it can indicate a market bottom. Long term holders’ movement in the last 7 days was lower than the average. They have a motive to hold their coins. Investors are in a anxiety phase where they are currently in a state of moderate unrealized profits.
- 🏦 Derivative: Long position traders are dominant and are willing to pay to short traders. Selling sentiment is dominant in the derivatives market. More sell orders are filled by takers. As OI decreases, it indicates investors are closing futures positions and possibility of trend reversals. In turn, this might trigger the possibility of long/short-squeeze caused by sudden price movement or vice versa.
- 🔀 Technicals: RSI indicates a oversold condition where 74.00% of price movement in the last 2 weeks have been down and a trend reversal can occur. Stochastic indicates a neutral condition where the current price is in a moderate location between the highest-lowest range of the last 2 weeks.
News About Altcoins
- Hyperliquid Surges in DeFi Revenue. Hyperliquid, a DEX and Layer 1 (L1) blockchain, now ranks third as the highest revenue generator in DeFi, surpassing PumpFun, with $12.6 million in revenue over the past week. This surge in revenue is due to high crypto market volatility and massive liquidations. In addition to adding BTC spot trading, Hyperliquid is also preparing to launch ETH spot after winning the UETH ticker in an auction worth $51,000. There is also speculation that HyperUnit, its ecosystem tokenization layer, will introduce shares into the DEX. Although the Hyperliquid network was only launched on February 18 and is still in its early stages, its native token, HYPE, has fallen 15% in the past week to $20.5, far from its peak of $34.
News from the Crypto World in the Past Week
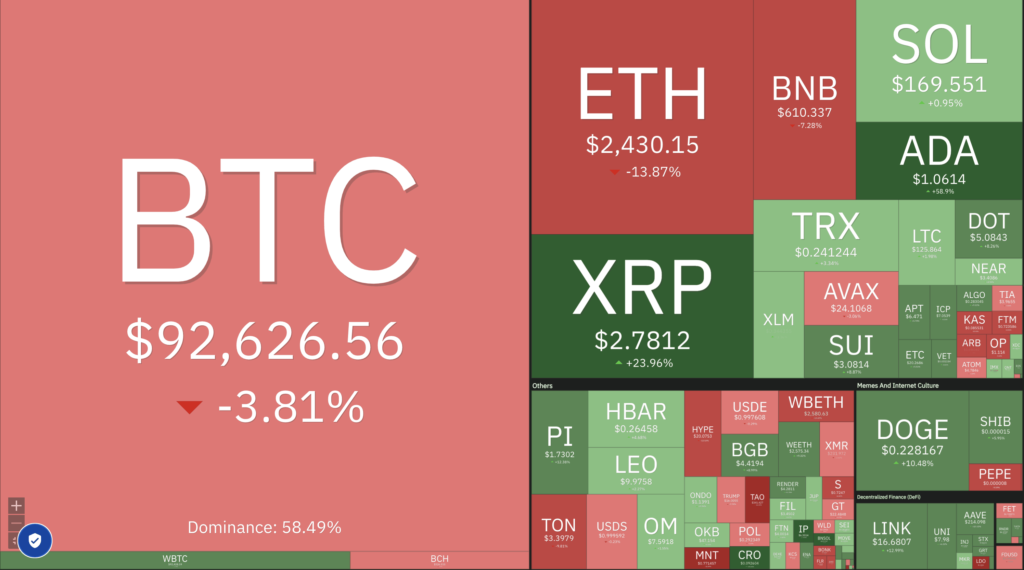
- Trump Announces Strategic Reserve Including BTC, ETH, XRP, SOL, and ADA. US President Donald Trump has announced plans to establish a Crypto Strategic Reserve to position the country as the “Crypto Capital of the World.” The reserve will include Bitcoin (BTC), Ethereum (ETH), XRP, Solana (SOL), and Cardano (ADA). This announcement immediately triggered a significant price surge for these five cryptocurrencies, with XRP, SOL, and ADA soaring up to 62%, while BTC and ETH gained over 10%. Trump, previously known as a crypto skeptic, has signed an executive order to form a presidential working group tasked with drafting new regulations and evaluating the feasibility of a national digital asset reserve, including cryptocurrencies seized by the government. Further details will be revealed at the first Crypto Summit at the White House this Friday.
- Grayscale Proposes Ethereum Staking in ETF, SEC Decision Expected May 2025. Grayscale has submitted a proposal to add staking rewards to their Ethereum ETF through NYSE Arca on February 14, 2025, with an SEC decision expected on May 26, 2025. If approved, the ETF will stake a portion of their ETH holdings through trusted providers without altering the custody structure, with Coinbase Custody remaining responsible for asset security. This move reflects a broader industry trend, although the SEC has previously been skeptical of staking in investment products. However, the regulator is now showing greater interest, as evidenced by the acceptance of a staking proposal from 21Shares and their decision to halt investigations into Robinhood Crypto and Uniswap. Approval of this proposal could usher in a new era for crypto ETFs offering staking rewards within traditional investment products.
Cryptocurrencies Market Price Over the Past Week
Cryptocurrencies With the Best Performance
- Cardano (ADA) +38.17%
- Hedera (HBAR) +26.72%
- Zcash (ZEC) +19.92%
- dogwifhat (WIF) +14.71%
Cryptocurrencies With the Worst Performance
- Raydium (RAY) – 23.33%
- Lido DAO (LDO) -20.07%
- Bittensor (TAO) -19.64%
- Sonic (S) -17.91%
References
- Squiffs, Hyperliquid Flips PumpFun to Become Top 3 Revenue Generator in DeFi, TheDefiant, accessed on 1 March 2025.
- Arslan Butt, US SEC Nears Decision on Grayscale Ethereum ETF Staking Proposal by May 26, fxleaders, accessed on 1 March 2025.
- Max Matza, Crypto prices rally after Trump backs five coins for ‘crypto reserve’, bbc, accessed on 3 March 2025.