
Bitcoin (BTC) price recently showed positive movement in response to the Federal Reserve’s decision not to raise interest rates. Additionally, market sentiment was boosted by the U.S.–China agreement to lower import tariffs, providing a tailwind for risk assets like crypto. These two factors mark a strong start for a potential bullish market in 2025. Check out the full analysis from the Pintu’s Trader Team.
Market Analysis Summary
- 🔑 Traders should watch for price action around the $103,000 resistance and maintain awareness of broader economic news that could impact sentiment.
- 📈 The latest US nonfarm payroll report for April 2025 showed an increase of 177,000 jobs.
- ✅ The United States and China reached a surprising agreement on Monday, May 5, 2025, to roll back tariffs on each other’s goods for an initial 90-day period.
- ↔️ The S&P Global US Services PMI for April 2025 was reported at 50.8, which is below the forecast of 51.4.
- ✂️ The Federal Reserve decided to keep its key interest rate steady at a target range of 4.25% to 4.5% during its May 2025 meeting.
- 💼 Continuing jobless claims, which represent the number of people receiving unemployment benefits after their initial claim, fell by 29,000 to 1.879 million in the same period.
Macroeconomic Analysis
Fed Interest Rate Decision
The Federal Reserve decided to keep its key interest rate steady at a target range of 4.25% to 4.5% during its May 2025 meeting, maintaining the level it has held since December 2024. This decision reflects the Fed’s cautious approach amid increased economic uncertainty, particularly related to the evolving trade policies of the Trump administration and their potential impact on the US economy. The Fed acknowledged that economic activity continues to expand at a solid pace, with a stable low unemployment rate and somewhat elevated inflation.
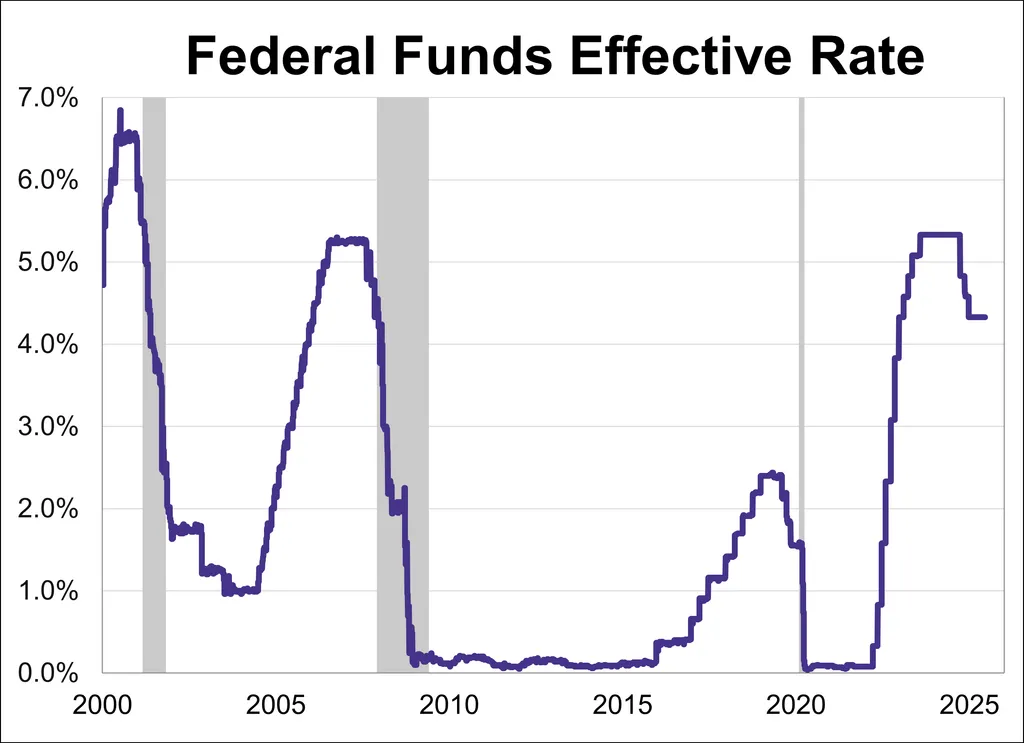
The Federal Open Market Committee (FOMC) emphasized that uncertainty about the economic outlook has intensified, raising risks on both sides of its dual mandate: maximum employment and price stability. The statement highlighted that the risks of higher unemployment and higher inflation have increased, but the Fed did not signal any immediate plans to change the rate.
In addition to holding rates steady, the Fed will continue its balance sheet reduction by rolling over maturing Treasury securities and agency debt within set caps. The Committee remains committed to supporting maximum employment and achieving a 2% inflation target over the longer term. It will closely monitor incoming data and evolving risks, prepared to adjust monetary policy if conditions threaten its goals.
Other Economic Indicators
- Non-Farm Payroll: The latest US nonfarm payroll report for April 2025 showed an increase of 177,000 jobs, slightly down from the revised 185,000 in March but well above market expectations of 130,000. This monthly gain is close to the average of 152,000 jobs added per month over the past year, reflecting steady-if moderate-growth in the labor market.
- U.S. Unemployment Rate: The unemployment rate remained at 4.2% in April 2025, in line with expectations. The number of unemployed rose by 82,000 to 7.165 million, while total employment increased by 436,000 to 163.944 million. The labor force participation rate rose to 62.6%, and the employment-to-population ratio improved to 60%, indicating moderate strengthening in the labor market.
- S&P Global Services PMI: The S&P Global U.S. Services PMI for April 2025 came in at 50.8, below the forecast of 51.4. While marking the 27th consecutive month of expansion, it was the slowest pace of growth since November 2023. The index is based on a survey of around 400 service-sector firms and tracks monthly changes in sales, employment, and prices, with readings above 50 indicating expansion.
- Jobless Claim: The latest data on US initial jobless claims for the week ending May 3, 2025, showed a decrease of 13,000 claims to 228,000, coming in slightly below market expectations of 230,000. This drop contrasts with the previous week’s two-month high of 241,000 claims, signaling a modest improvement in new unemployment filings. The figure remains consistent with a resilient labor market compared to historical levels, reflecting relatively low layoffs amid ongoing economic uncertainties.
BTC Price Analysis
Over the past week leading up to May 8, 2025, BTC experienced a generally steady upward trend with some volatility:
- May 1st: Starting around $94,000 on May 1, BTC gradually climbed through the week, reaching about $97,000 by May 7. This steady rise was supported by consistent trading volumes above the average, indicating sustained investor interest.
- May 4th & 6th: After some minor pullbacks on May 4 and May 6, the overall momentum remained positive, reflecting cautious optimism in the market.
- May 5th: The United States and China reached a surprising agreement on Monday, May 5, 2025, to roll back tariffs on each other’s goods for an initial 90-day period. Under the deal, the US will reduce its tariffs on Chinese goods from 145% to 30%, while China will cut its levies on American imports from 125% to 10%. The mutual tariff revisions will be imposed by May 14, 2025.
- May 8th: BTC initially traded around $97,000, maintaining the gains from the previous days. However, towards the end of day, BTC saw a significant run-up, surging to above $101,000. This sharp increase represents a roughly 4.2% jump within a short period, driven by a surge in buying volume. The intraday low was about $96,940, and the high reached $101,873, indicating strong bullish momentum.
Throughout the week, BTC’s price fluctuated between a low near $94,000 and highs approaching $97,000, showing a consolidation phase where buyers and sellers were closely matched. The price movements were influenced by broader macroeconomic factors, including the Federal Reserve’s recent decision to hold interest rates steady and ongoing geopolitical uncertainties. These factors likely contributed to cautious but persistent buying, preventing any sharp declines.
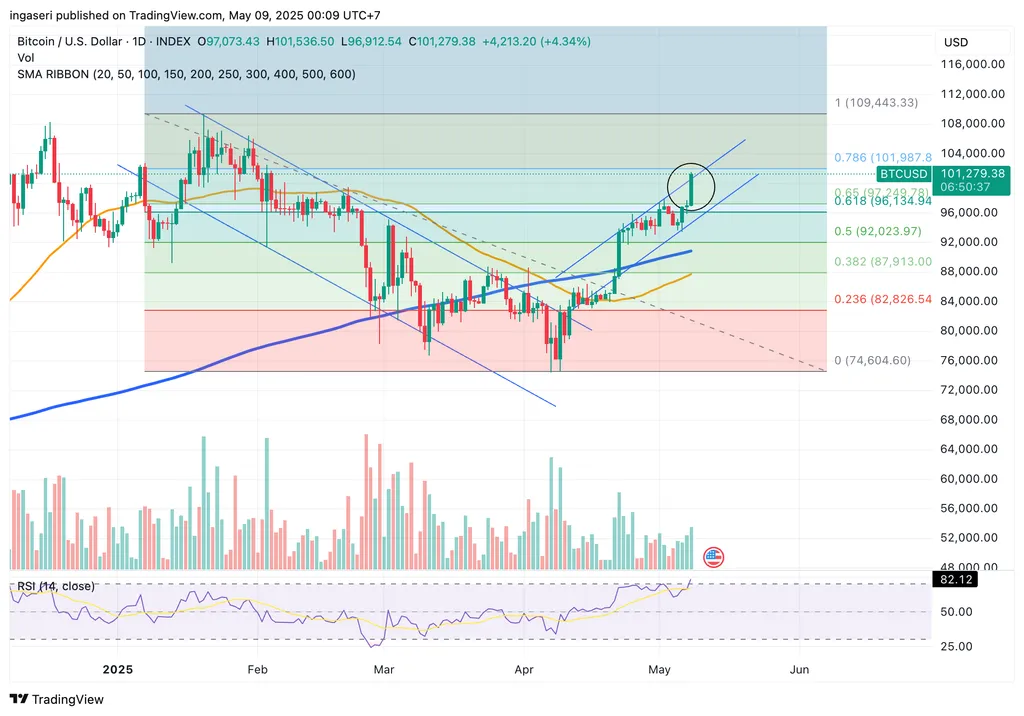
This sudden price spike could be attributed to a combination of technical breakout above key resistance levels and renewed investor confidence, possibly fueled by positive news or institutional buying. The market capitalization of BTC now stands near $2 trillion, underscoring its continued dominance and appeal as a digital asset. The volume during this rally was notably higher than average, suggesting that the move was supported by substantial market participation.
In summary, BTC’s price over the past week showed steady gains with some consolidation, followed by a sharp rally on May 8 pushing it above $101,000. This move highlights BTC’s resilience and the ongoing interest from investors despite broader economic uncertainties. Monitoring whether this momentum sustains or faces resistance near the year’s high of around $109,000 will be key for traders and investors in the near term.
Technical Indicators Analysis
- Moving Averages (MA): BTC’s price recently broke above its 50-day and 200-day moving averages, a bullish signal known as a “golden cross” when the shorter-term MA crosses above the longer-term MA. This crossover often signals a shift to upward momentum and tends to attract buying interest from traders. The 50-day MA is currently near $96,500, providing strong support, while the 200-day MA around $92,000 has acted as a longer-term floor.
- Relative Strength Index (RSI): The RSI, which measures momentum on a scale of 0 to 100, surged above 70 during the recent rally, indicating that BTC is entering overbought territory. While this suggests the asset might be due for a short-term pullback or consolidation, it also reflects strong bullish sentiment. Traders often watch for RSI divergences or sustained overbought conditions to time entries and exits.
- Volume: The volume accompanying the recent price surge was significantly above the average daily volume, confirming the strength behind the move. High volume on upward price moves typically indicates genuine buying interest rather than a short-lived spike caused by thin liquidity or speculative trades.
- Support and Resistance Levels: Key resistance was broken near $99,500, which had capped BTC’s price in recent weeks. The breakout above this level triggered stop-loss orders and fresh buying, propelling the price toward the next resistance zone around $103,000. On the downside, support now lies near $97,000, which was the previous consolidation range’s upper boundary.
Potential Drivers Behind the Surge
- Institutional Buying: Reports suggest renewed institutional interest, including large purchases by hedge funds and family offices, as BTC increasingly gains acceptance as a hedge against inflation and geopolitical risks. Institutional inflows often lead to sustained upward pressure on price.
- Macro Factors: The Federal Reserve’s decision to pause interest rate hikes has eased concerns about tighter monetary policy, encouraging risk-taking in assets like BTC. Additionally, ongoing geopolitical tensions have increased demand for alternative assets perceived as stores of value.
- Technical Breakout: The technical breakout above key resistance levels likely triggered algorithmic buying and attracted momentum traders, accelerating the rally. This “breakout effect” is common in crypto markets where technical analysis heavily influences trader behavior.
- Positive News and Sentiment: While no single headline dominated this move, the overall market mood appears optimistic.
In conclusion, BTC’s recent surge above $101,000 is supported by strong technical signals-moving average crossovers, high volume, and breakout of resistance-combined with favorable macroeconomic conditions and renewed institutional interest. While the RSI suggests caution for a possible short-term pullback, the overall momentum remains bullish. Traders should watch for price action around the $103,000 resistance and maintain awareness of broader economic news that could impact sentiment.
On-Chain Analysis
News About Altcoins
- XRP Set to Soar with Projections of $5.50 by Year-End, Boosted by Trump’s Policies and Anticipated SEC Approval. After a rocky start to the year, the crypto market is showing renewed optimism, with XRP expected to soar. Projections suggest XRP could reach $5.50 by the end of this year and $12.25 by 2029. Geoffrey Kendrick from Standard Chartered expects the rally to be fueled by pro-industry policies from US President Donald Trump and the potential approval of spot XRP exchange-traded funds by the SEC in 2025. Additionally, the crypto market is benefiting from the anticipation of new trade deals between the US and several countries, though some deals have yet to materialize.
News from the Crypto World in the Past Week
- BlackRock Acquires $4.5 Billion in Bitcoin, Surpassing US and China Holdings. BlackRock, the world’s largest asset manager, has made significant Bitcoin acquisitions totaling around $4.5 billion. The firm recently bought 682 Bitcoins worth $69 million, adding to a previous acquisition of 47,064 Bitcoins valued at $4.44 billion. These purchases occurred as Bitcoin’s price consolidated near $95,000 before surging past $100,000. Following these acquisitions, BlackRock now holds more Bitcoin than the combined holdings of the United States and China.
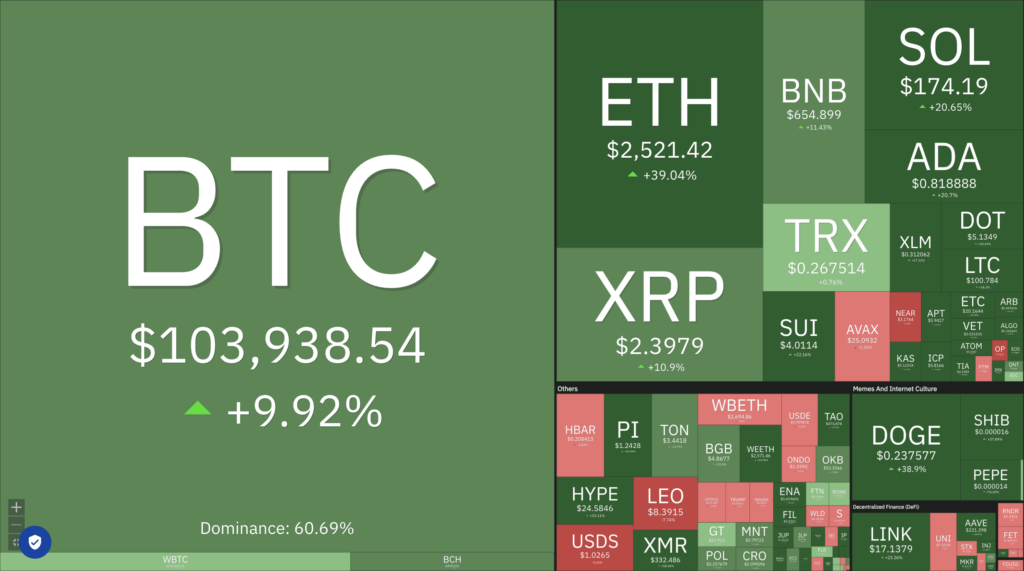
Cryptocurrencies Market Price Over the Past Week
Cryptocurrencies With the Best Performance
- dogwifhat (WIF) +89.48%
- Pepe (PEPE) +73.03%
- SPX6900 (SPX) +57.61%
- Brett (BRETT) +51.87%
Cryptocurrencies With the Worst Performance
References
- Eric Johansson, Crypto bulls are back as XRP expected to quintuple, dlnews, accessed on 12 May 2025.
- DeepNewz, BlackRock Acquires 47,746 BTC Worth $4.5 Billion as Bitcoin Surges Past $100K, Exceeding U.S. and China Holdings, thedefiant, accessed on 12 May 2025.