
The crypto market is entering May, a month often dreaded by investors and traders due to the saying ‘Sell in May and Go Away.’ However, many global analysts are taking a more optimistic view this year, predicting that Bitcoin (BTC) could reclaim the $100,000 price point by May 2025. Check out the full analysis from the Trader Pintu team.
Market Analysis Summary
- ✅ The expert forecasts are optimistic, projecting BTC to break above $100,000 in early May 2025, with some models anticipating prices reaching as high as $132,000 by the end of the month.
- 📈 The latest University of Michigan Consumer Sentiment Index for April 2025 was revised upward to 52.2, from a preliminary reading of 50.8.
- 📊 The latest data for the global goods trade balance reveals notable shifts across major economies. In the United States, the goods trade deficit widened sharply in March 2025.
- 💼 The latest JOLTS (Job Openings and Labor Turnover Survey) report, released on April 29, 2025, shows that U.S. job openings fell sharply in March 2025 to 7.192 million.
- 👥 The latest ADP National Employment Report for April 2025 reveals a significant slowdown in private sector job growth.
- 📉 The latest data on the Core PCE Price Index for March 2025, shows that the year-over-year inflation rate slowed to 2.6%, down from 3.0% in February.
Macroeconomic Analysis
Core PCE Price Index
The latest data on the U.S. Core Personal Consumption Expenditures (PCE) Price Index, released for March 2025, shows that the year-over-year inflation rate slowed to 2.6%, down from 3.0% in February. This marks the softest increase since March 2021 and aligns with market expectations. The Core PCE Price Index excludes volatile food and energy prices and is the Federal Reserve’s preferred gauge of underlying inflation, making this slowdown significant for monetary policy considerations.
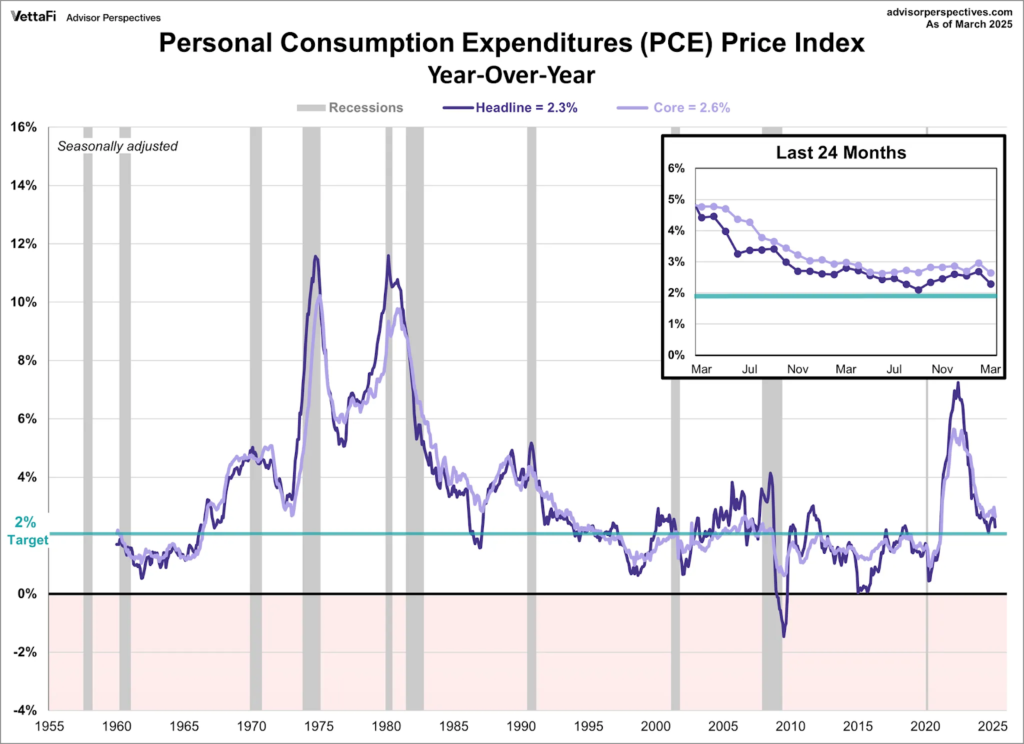
On a month-over-month basis, the Core PCE Price Index was unchanged in March 2025, following a 0.4% rise in February, which was the largest monthly increase since January 2024. The zero percent monthly change in March contrasts with expectations for a slight increase, indicating a pause in inflationary pressures at the consumer level excluding food and energy. This moderation suggests that inflation may be stabilizing after earlier volatility in prices.
Looking at the broader trend, the Core PCE inflation rate has been gradually easing from the peak levels seen in 2023 when it was well above 4%. The current annual rate of 2.6% remains slightly above the Federal Reserve’s 2% target but shows progress toward price stability. The index’s long-term average is around 3.24%, so the recent readings are below historical norms, reflecting a cooling inflation environment. This trend is likely to influence the Federal Reserve’s future decisions on interest rates as they balance controlling inflation without stalling economic growth.
In summary, the latest Core PCE Price Index data indicates a continuing moderation in inflation pressures, with annual inflation slowing to 2.6% in March 2025 and no increase in prices month-over-month. This easing supports the view that inflation is becoming more manageable, although it remains slightly above the Fed’s target. Policymakers will monitor upcoming data closely to gauge whether this trend is sustainable and to guide future monetary policy actions accordingly.
Other Economic Indicators
- Michigan Consumer Sentiment: The latest University of Michigan Consumer Sentiment Index for April 2025 was revised upward to 52.2, from a preliminary reading of 50.8, but still marked a significant drop from 57 in March. This represents an 8% decline month-over-month and the fourth consecutive monthly decrease, bringing the index to its lowest level since July 2022. The decline was broad-based, with the current economic conditions index falling to 59.8 from 63.8, and the expectations index plunging to 47.3 from 52.6 in March. Compared to a year ago, sentiment is down more than 32%, marking one of the steepest annual declines on record.
- Goods Trade Balance: The latest data for the global goods trade balance reveals notable shifts across major economies. In the United States, the goods trade deficit widened sharply in March 2025, reaching a record high of $162.0 billion, up 9.6% from the previous month. This surge was primarily driven by stockpiling ahead of anticipated tariffs, which led to a significant increase in imports. While exports rose modestly, the pace was insufficient to offset the jump in imports, resulting in the largest monthly goods trade gap ever recorded for the U.S.
- JOLTS Job Openings: The latest JOLTS (Job Openings and Labor Turnover Survey) report, released on April 29, 2025, shows that U.S. job openings fell sharply in March 2025 to 7.192 million, marking a decrease of 288,000 from the previous month and reaching the lowest level in six months. This figure was also well below market expectations of 7.48 million.
- ADP Employment Change: The latest ADP National Employment Report for April 2025 reveals a significant slowdown in private sector job growth, with only 62,000 jobs added compared to a revised 147,000 in March. This increase was well below market expectations of around 115,000 and marked the smallest monthly gain since July 2024. The report is based on anonymized payroll data from over 25 million U.S. employees, providing a near real-time snapshot of labor market conditions.
- GDP Growth: The U.S. economy contracted by 0.3% on a quarter-over-quarter basis in the first quarter of 2025, marking the first decline since early 2022. This contraction was a sharp reversal from the 2.4% growth recorded in the previous quarter and fell well short of market expectations, which had anticipated a modest 0.3% increase. The slowdown was largely driven by a substantial 41.3% surge in imports, reflecting businesses and consumers stockpiling goods ahead of anticipated tariff hikes, which negatively impacted net trade and GDP calculations. Additionally, federal government spending fell by 5.1%, the steepest drop since the first quarter of 2022, while consumer spending growth slowed to 1.8%, its weakest pace since mid-2023.
- Personal Income and Spending: The latest data for March 2025 shows that U.S. personal income increased by $116.8 billion, or 0.5% on a monthly basis, driven primarily by higher compensation and proprietors’ income. Disposable personal income (DPI), which is personal income after taxes, also rose by 0.5%, reflecting stronger income available for spending. This increase in income supports consumer confidence and spending capacity amid ongoing economic uncertainties.
BTC Price Analysis
Over the past week, BTC has experienced relatively stable price movements around the $94,000 mark, with minor fluctuations within a narrow range. The price hovered between a low near $93,076 and a high around $95,209, showing limited volatility compared to previous months. This stability suggests a consolidation phase where buyers and sellers are closely matched, reflecting cautious market sentiment amid broader economic and regulatory uncertainties.
Despite the sideways movement, technical indicators point to a generally bullish outlook. The 50-day moving average price stands at about $85,408, while the 200-day moving average is near $89,514, both below the current price, indicating upward momentum in the medium and long term. Market sentiment indexes also lean positive, with a “neutral bullish” rating around 71%, and the Fear & Greed Index at 56, signaling moderate investor confidence without excessive exuberance.
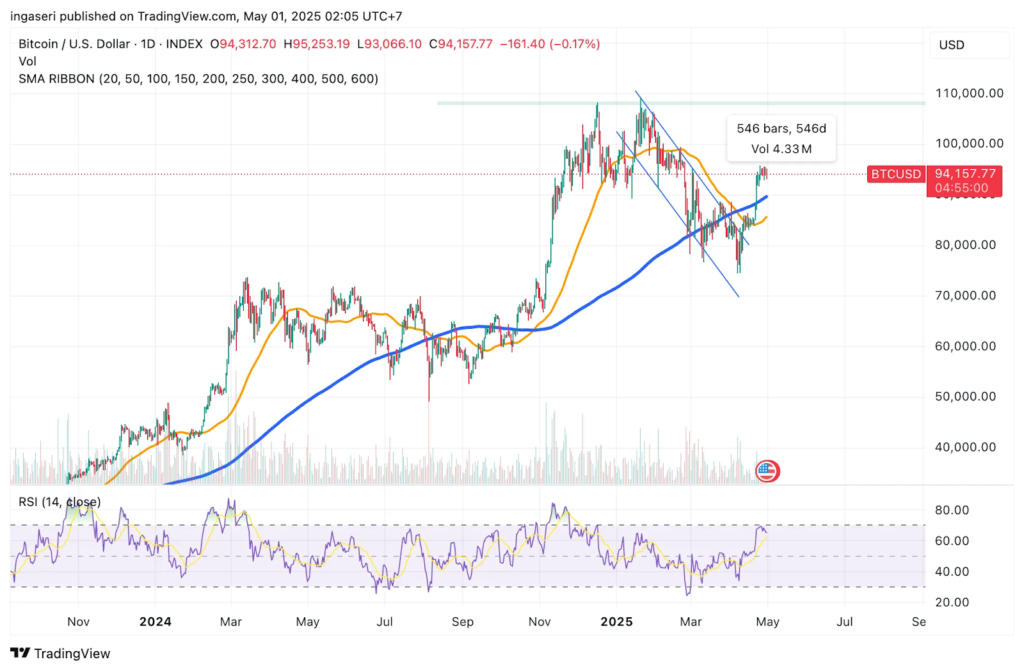
Trading volume over the week averaged roughly $29 billion daily, slightly below the longer-term average of about $38 billion, suggesting somewhat reduced trading activity. This lower volume could imply that market participants are waiting for clearer signals or upcoming catalysts before committing more capital. The market capitalization remains robust at approximately $1.86 trillion, underscoring BTC’s continued dominance and investor interest in the cryptocurrency space.
Looking ahead, expert forecasts are optimistic, projecting BTC to break above $100,000 in early May 2025, with some models anticipating prices reaching as high as $132,000 by the end of the month. These projections are based on historical price patterns, technical analysis, and expectations of increasing institutional adoption and favorable macroeconomic conditions. However, analysts caution that volatility remains a key risk factor, especially given regulatory developments and global economic shifts.
In summary, BTC’s price over the past week has shown consolidation near the $94,000 level with moderate trading volume and bullish technical signals. While short-term price action is subdued, forecasts suggest a potential breakout in the coming weeks, supported by positive market sentiment and strong fundamentals. Investors should remain attentive to market developments and external factors that could influence BTC’s trajectory in the near term.
On-Chain Analysis
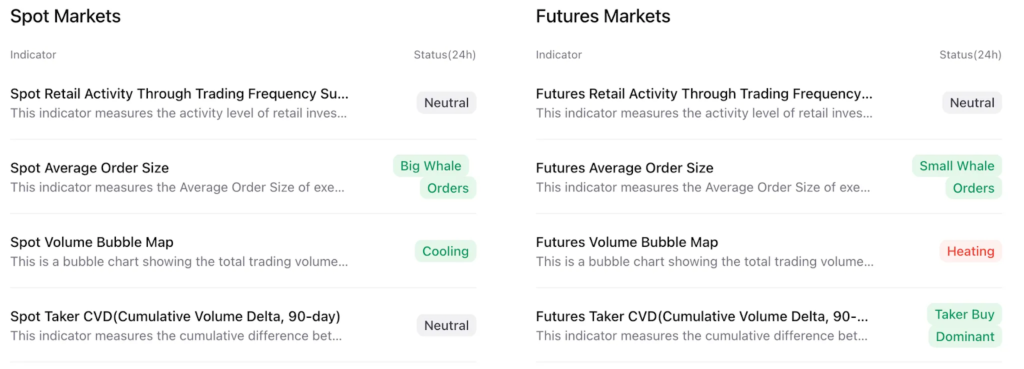
- 📊 Exchange: As the exchange reserve continues to fall, it indicates lower selling pressure. Net deposits on exchanges are high compared to the 7-day average. Higher deposits can be interpreted as higher selling pressure.
- 💻 Miners: Miners’ are selling holdings in a moderate range compared to its one-year average. Miner’s revenue is in a moderate range, compared to its one-year average.
- ⛓️ On-chain: More investors are selling at a profit. In the middle of a bull market, it can indicate a market top. Long term holders’ movement in the last 7 days was lower than the average. They have a motive to hold their coins. Investors are in a anxiety phase where they are currently in a state of moderate unrealized profits.
- 🏦 Derivative: Long position traders are dominant and are willing to pay to short traders. Selling sentiment is dominant in the derivatives market. More sell orders are filled by takers. As open interest increases, it indicates more liquidity, volatility, and attention are coming into the derivative market. The increasing trend in open interest could support the current ongoing price trend.
- 🔀 Technicals: RSI indicates a overbought condition where 79.00% of price movement in the last 2 weeks have been up and a trend reversal can occur. Stochastic indicates a neutral condition where the current price is in a moderate location between the highest-lowest range of the last 2 weeks.
News About Altcoins
- Tight Competition in the Ethereum Layer 2 Market: Arbitrum, Optimism, and Base. Three major protocols, Arbitrum, Optimism, and Base, are competing for dominance in the $52 billion Ethereum Layer 2 DeFi market. Arbitrum and Optimism, despite differing strategies, have similar valuations around $3.2 billion. Meanwhile, Base, supported by Coinbase, has no native token and uses Optimism’s technology, benefiting Coinbase more than OP token holders. Arbitrum retains more on-chain liquidity, while Base claims low transaction fees and a TVL of about $3 billion. Each protocol relies on various partnerships and innovations to attract users and increase liquidity in the Layer 2 space.
- The Ministry of Communication and Digital (Kemkomdigi) Temporarily Freezes Worldcoin and WorldID Services. The Ministry of Communication and Digital (Kemkomdigi) in Indonesia has temporarily suspended Worldcoin and WorldID services following reports of suspicious activities. This preventive measure is aimed at protecting the public. Kemkomdigi discovered that PT Terang Bulan Abadi, the operator of Worldcoin, was not legally registered and used another company’s identity, PT Sandina Abadi Nusantara. Kemkomdigi emphasized that failing to comply with regulations is a serious violation. The public is urged to stay vigilant about illegal digital services and report any suspected violations through official channels.
News from the Crypto World in the Past Week
- Massive Inflows into U.S. Bitcoin ETFs and Future Bitcoin Price Predictions. U.S. spot Bitcoin ETFs have seen significant inflows, with BlackRock’s iShares Bitcoin ETF (IBIT) attracting $674.9 million on May 2, marking its 14th consecutive day of inflows totaling over $4 billion. This surge occurs amid high market volatility and growing anticipation around monetary policy. The total daily volume across all U.S. spot Bitcoin ETFs surpassed $2.8 billion, signaling renewed institutional interest. The total Bitcoin held by U.S. ETFs has reached $112 billion, reflecting strong investor confidence. BlackRock has recommended a 2% allocation to Bitcoin, suggesting a potential market cap of $18 trillion for Bitcoin, with a price of around $900,000 per coin. BlackRock and Michael Saylor have made large Bitcoin purchases, while the market faces $3.1 billion in shorts, which could be impacted as Bitcoin approaches $100,000.
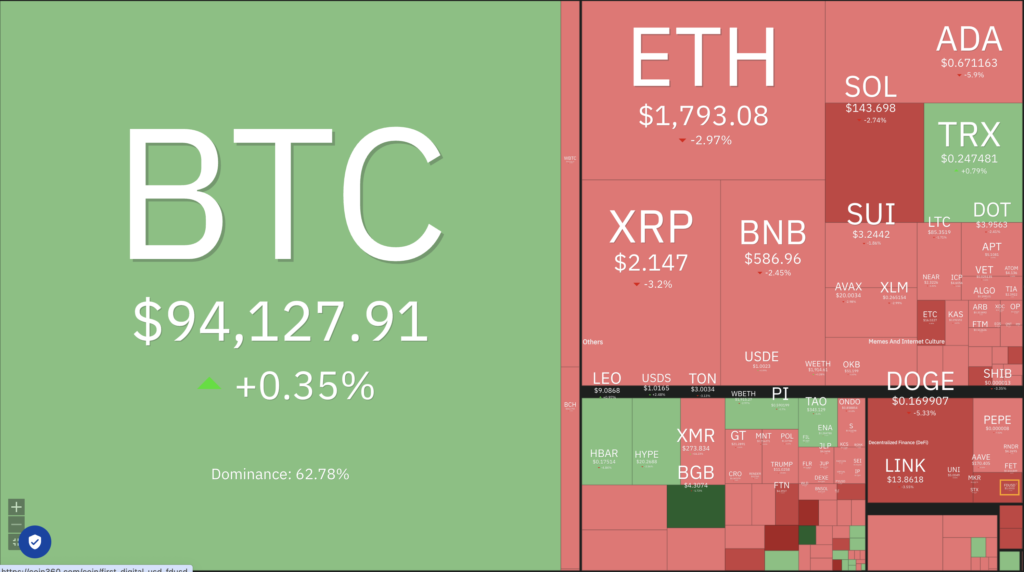
Cryptocurrencies Market Price Over the Past Week
Cryptocurrencies With the Best Performance
- Virutals Protocol (VIRTUAL) +51.35%
- Quant (QNT) +18.73%
- Zcash (ZEC) +9.71%
- Curve DAO Token (CRV) +5.96%
Cryptocurrencies With the Worst Performance
- Pudgy Penguins (PENGU) -18.82%
- Worldcoin (WLD) -16.65%
- Celestia (TIA) -16.17%
- Ethena (ENA) -15.68%
References
- Protos Staff, Arbitrum, Optimism, and Base are fighting over $52 billion DeFi pie, Protos, accessed on 3 May 2025.
- DeepNews, BlackRock’s Bitcoin ETF Sees $674.9M Inflow, Part of $4B Over 14 Days, as U.S. ETFs Hold $112B in BTC, thedefiant, accessed on 3 May 2025.
- Jessi Carina, Kemkomdigi Bekukan Sementara Izin Worlcoin dan WorldID, Kompas, accessed on 4 May 2025.