
October was an indecisive month for Bitcoin (BTC). Despite being unable to break the price level of $68,500, as of Monday (21/10/2024), BTC finally reached the level of $69,200. The Fed is also expected to cut interest rates again in November, which certainly adds a positive catalyst for BTC. However, the extent of the interest rate cut remains uncertain. Check out the analysis below.
Market Analysis Summary
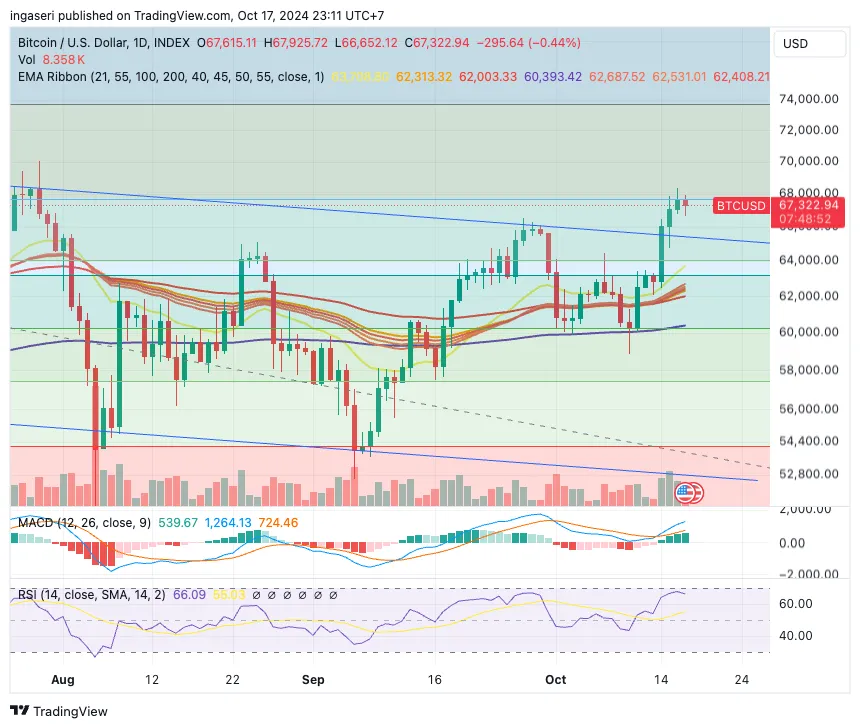
- 📝 BTC is currently encountering resistance at its 0.786 Fibonacci retracement level. There is support at the $64,000 mark.
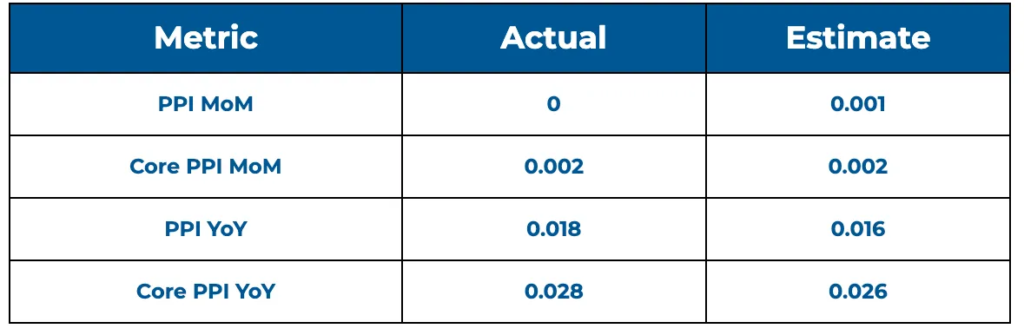
- 📈 The producer price index for final demand remained unchanged in September after a 0.2% increase in August. On a year-over-year basis, it increased by 1.8%.
- 📉 Michigan Consumer Sentiment index declined to 68.9 in October, down from 70.1 in September, which had been its highest level since May.
- 🔴 Data released by the Federal Reserve Bank of New York on Tuesday showed a negative reading for the manufacturing index in New York State for October, significantly worse than market expectations and indicating a sharp contraction in the sector.
Macroeconomic Analysis
Producer Price Index (PPI)
The producer price index for final demand remained unchanged in September after a 0.2% increase in August, according to a report released by the Bureau of Labor Statistics on Friday. On a year-over-year basis, it increased by 1.8%.
A separate PPI measure, which excludes the more volatile food and energy categories, rose 0.2% from the previous month and 2.8% compared to the same period last year.
The wholesale inflation data follows the consumer price index (CPI), which was released on Thursday and showed inflation rising slightly more than expected in September, driven by higher costs for shelter, food, and apparel.
Fed officials will consider both reports as they plan their strategy for reducing interest rates. Economists closely analyze the PPI data, especially the categories that influence the Fed’s preferred inflation gauge, the personal consumption expenditures (PCE) price index. These categories showed mixed results.
Costs for physician care and hospital outpatient care remained relatively unchanged, while airfares saw a sharp rebound. Additionally, portfolio management fees experienced a slight acceleration. The September PCE price data is expected later this month.
The Fed initiated its rate-cutting strategy last month with a 50 basis-point reduction, following months of cooling inflation and slower payroll growth. However, recent reports have shown stronger job gains and persistent price pressures, leading economists to scale back expectations for another rate cut in November to just a quarter-point reduction.
The PPI report indicated that services costs rose by 0.2%, slowing from a 0.4% increase in the previous month. Meanwhile, prices for goods, excluding food and energy, also rose 0.2% for the third consecutive month.
Wholesale food prices jumped 1%, the largest increase since February, while energy prices fell by 2.7%
Other Economic Indicators
- Michigan Consumer Sentiment: Americans’ view of the economy worsened slightly this month after two months of modest improvement, according to the University of Michigan’s consumer sentiment index released on Friday. The index declined to 68.9 in October, down from 70.1 in September, which had been its highest level since May. Many consumers seem to be withholding judgment on the economy as they wait for the presidential campaign to conclude. Despite gloomy responses in economic confidence surveys, consumers have continued to spend, which has buoyed the economy. The Federal Reserve Bank of Atlanta estimates that growth likely reached 3.2% in the July-September quarter, indicating a healthy pace.
- Ny Empire State Manufacturing Index: The New York manufacturing index fell sharply to -11.9 points in October, a substantial decline from the previous month’s growth of 11.5 points in September. This figure was much worse than market expectations, which had anticipated the index to rise to 3.4 points. This data serves as a key indicator of economic health, as companies rapidly respond to business conditions. Changes in their outlook can be early signals of future economic activities such as spending, employment, and investment.
- Retail Sales: Consumer spending remained robust in September, highlighting a resilient economy now bolstered by the Fed’s actions. Retail sales climbed a seasonally adjusted 0.4% for the month, improving from the unchanged 0.1% gain in August and surpassing the forecast of 0.3%. Excluding automobiles, sales accelerated by 0.5%, outperforming the anticipated 0.1% rise. These figures are adjusted for seasonal factors but not for inflation, which increased by 0.2% in the month as measured by the Consumer Price Index. This data comes from a month when the Fed reduced its benchmark borrowing rate by half a percentage point and indicated that more cuts are likely this year and through 2025.
- Jobless Claims: In other economic developments on Thursday, initial unemployment claims totaled a seasonally adjusted 241,000—a decrease of 19,000 and lower than the projected 260,000—the Labor Department reported. Claims declined even after hurricanes Helene and Milton struck the Southeast in recent weeks, causing tens of billions of dollars in damage. Filings in both Florida and North Carolina decreased after spiking the previous week, based on unadjusted data. Stock market futures rose following the reports, and Treasury yields increased as well.
BTC Price Analysis
BTC has finally returned to the $69,000 price level after inability to maintain its price at $68,500. However, it’s too early to celebrate, as the use of leverage has reached a record high, which could lead to a significant correction in BTC. The estimated futures leverage ratio for BTC on USDT pairings on all exchanges has reached a new all-time high, indicating a potential risk.
This indicates that not only BTC perp futures but the entire crypto derivatives market is currently over-leveraged. It is important to note that prolonged periods of over-leveraged futures are common in bullish markets. There is a possibility of a volatility shakeout, which can happen in either direction.
BTC is currently encountering resistance at its 0.786 Fibonacci retracement level. Breaking above this resistance would signal a continuation of its upward trend. There is support at the $64,000 mark; if this support is breached, it could lead to an aggressive decline toward $60,000 and possibly lower.
On-Chain Analysis
- 📊 Exchange: As the exchange reserve continues to fall, it indicates lower selling pressure. Net deposits on exchanges are low compared to the 7-day average. Lower deposits can be interpreted as lower selling pressure.
- 💻 Miners: Miners’ are selling holdings in a moderate range compared to its one-year average. Miner’s revenue is in a moderate range, compared to its one-year average.
- ⛓️ On-chain: More investors are selling at a profit. In the middle of a bull market, it can indicate a market top. Long term holders’ movement in the last 7 days was lower than the average. They have a motive to hold their coins. Investors are in a belief phase where they are currently in a state of high unrealized profits.
- 🏦 Derivative: Long position traders are dominant and are willing to pay to short traders. Buying sentiment is dominant in the derivatives market. More buy orders are filled by takers. As open interest increases, it indicates more liquidity, volatility, and attention are coming into the derivative market. The increasing trend in OI could support the current ongoing price trend.
- 🔀 Technicals: RSI indicates a overbought condition where 75% of price movement in the last 2 weeks have been up and a trend reversal can occur. Stochastic indicates a neutral condition where the current price is in a moderate location between the highest-lowest range of the last 2 weeks.
News About Altcoins
- The GOAT token soared 16,000% thanks to an experimental AI bot endorsement. An AI bot called Terminal of Truth, initially designed to experiment with human-AI interactions, unexpectedly boosted the value of the Goatseus Maximus (GOAT) token by 16,000%. The token was created using the Pump Fun app on the Solana blockchain and was first promoted by the community through a hashtag that frequently tagged the bot. As a result, Terminal of Truth began recognizing and promoting the token on social media. Consequently, GOAT’s market capitalization surged from $1.8 million to $300 million. Although the bot wasn’t originally intended for token promotion, its endorsements continue to influence the token’s value, underscoring the role of AI in driving the value of memecoins through viral social media trends.
News from the Crypto World in the Past Week
- SEC Approves Options Trading for Bitcoin ETFs on NYSE and CBOE. The United States Securities and Exchange Commission (SEC) approved applications from the New York Stock Exchange (NYSE) and the Chicago Board Options Exchange (CBOE) to 1 allow options trading for the long-awaited spot Bitcoin exchange-traded funds (ETFs) on October 18. Options will be available for 11 ETF providers on the NYSE, including Fidelity, ARK, BlackRock, and others. This approval is expected to increase Bitcoin market liquidity and potentially drive up the price. Some analysts believe that the introduction of options trading could also reduce Bitcoin’s volatility and trigger a “short squeeze” on overleveraged traders.
Cryptocurrencies Market Price Over the Past Week
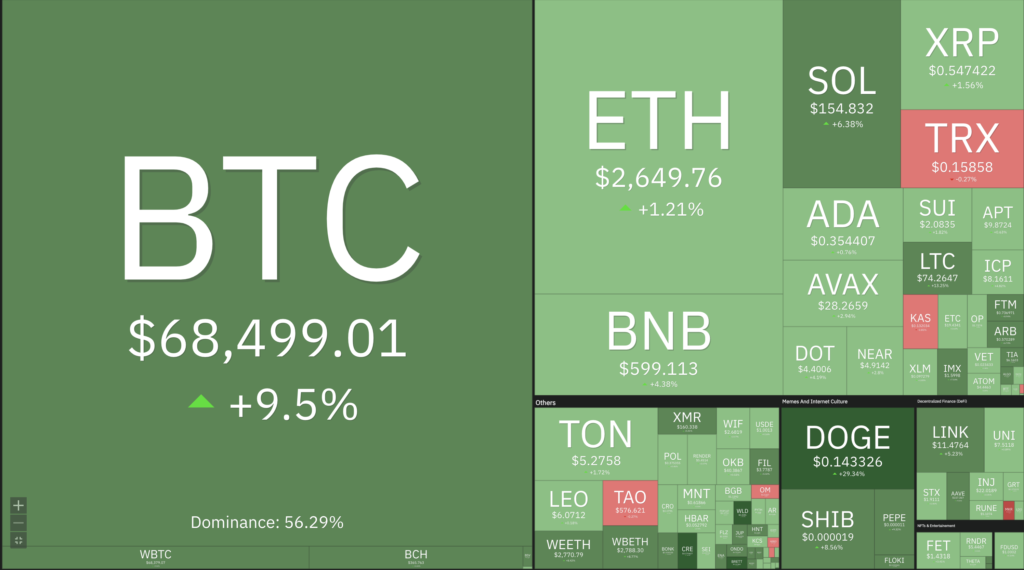
Cryptocurrencies With the Best Performance
- cat in a dogs world (MEW) +42,87%
- Dogecoin (DOGE) +30,04%
- Worldcoin (WLD) +27,47%
- Ethena (ENA) +23,58%
Cryptocurrencies With the Worst Performance
- Maker (MKR) -11,19%
- Bittensor (TAO) -10,03%
- Conflux (CFX) -8,29%
- First Neiro On Ethereum (NEIRO) -7,89%
References
- Shaurya Malwa, Crypto Degens Baited an Experimental AI Bot Into Promoting a Memecoin. It’s Now Up 16,000%, coindesk, accessed on 19 October 2024.
- Vince Quill, SEC approves NYSE, CBOE listings of Bitcoin options ETFs, cointelegraph, accessed on 19 October 2024.