
October is a highly anticipated month for crypto investors as the crypto market typically shows positive growth during this time. However, in the first week of October, Bitcoin (BTC) failed to break through its moving average (MA), extending its correction phase. What does October have in store for BTC? Explore the analysis below.
The Pintu trading team has gathered critical information and analyzed the general economic situation and the crypto market’s movements over the past week. However, it should be noted that all information in this Market Analysis is intended for educational purposes, not as financial advice.
Market Analysis Summary
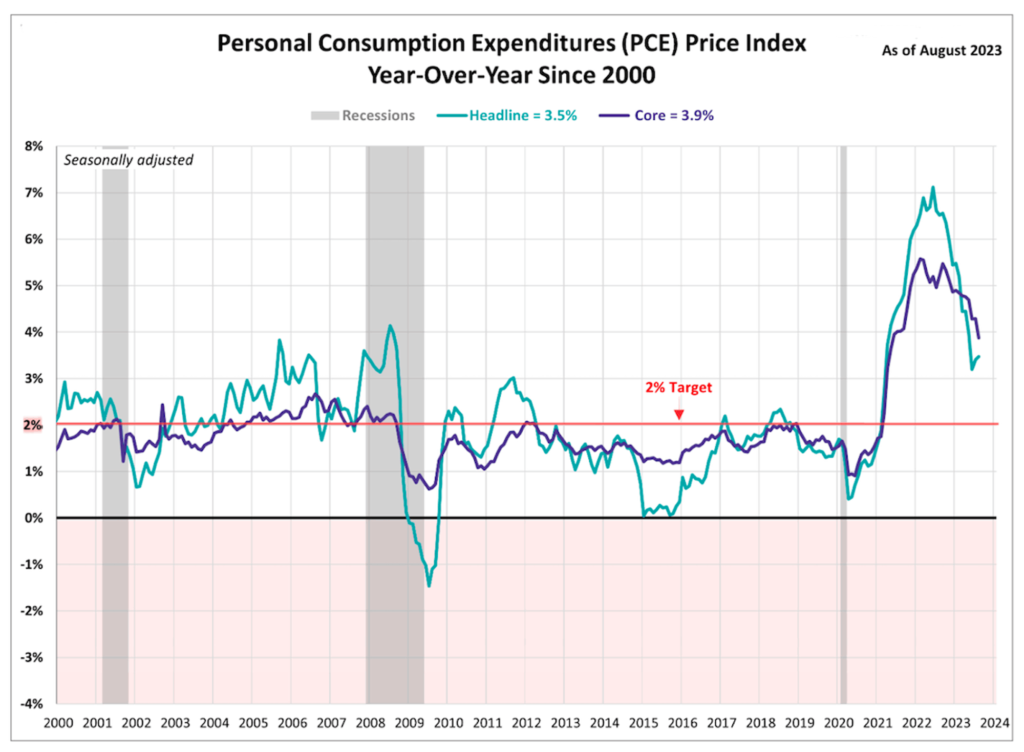
- 📈 The core PCE measure increased 0.1% compared to July and showed year-on-year (YoY) growth of 3.9%.
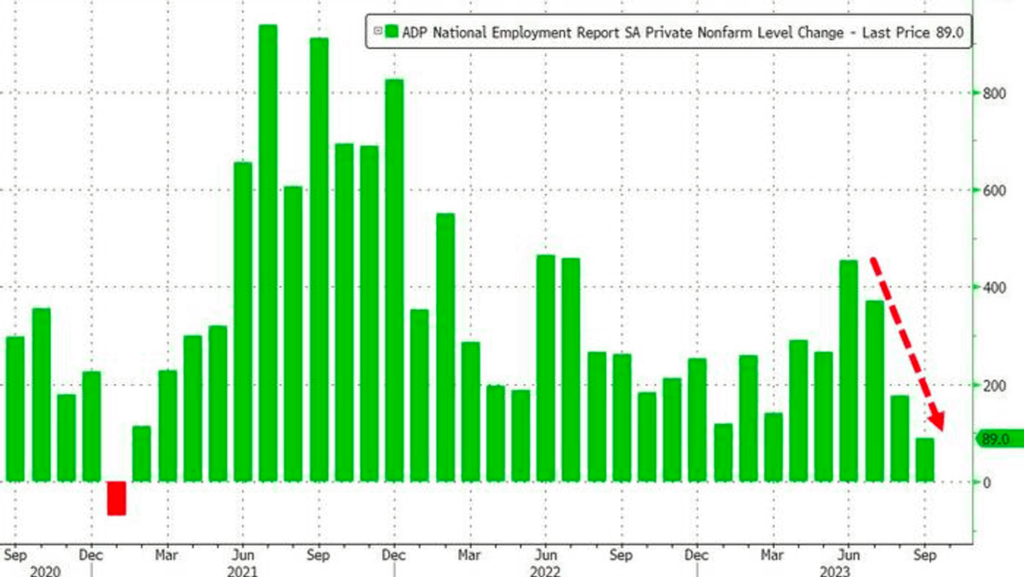
- 👥 Job openings rose to 9.6 million in August, but initial jobless claims rose slightly to 207,000 at the end of September. The private sector added 89,000 jobs in September, but job growth has been slowing since January 2021.
- 🚨 The stock market reacted negatively to several economic reports as investors worried that the Fed would raise interest rates to stabilize inflation and the economy.
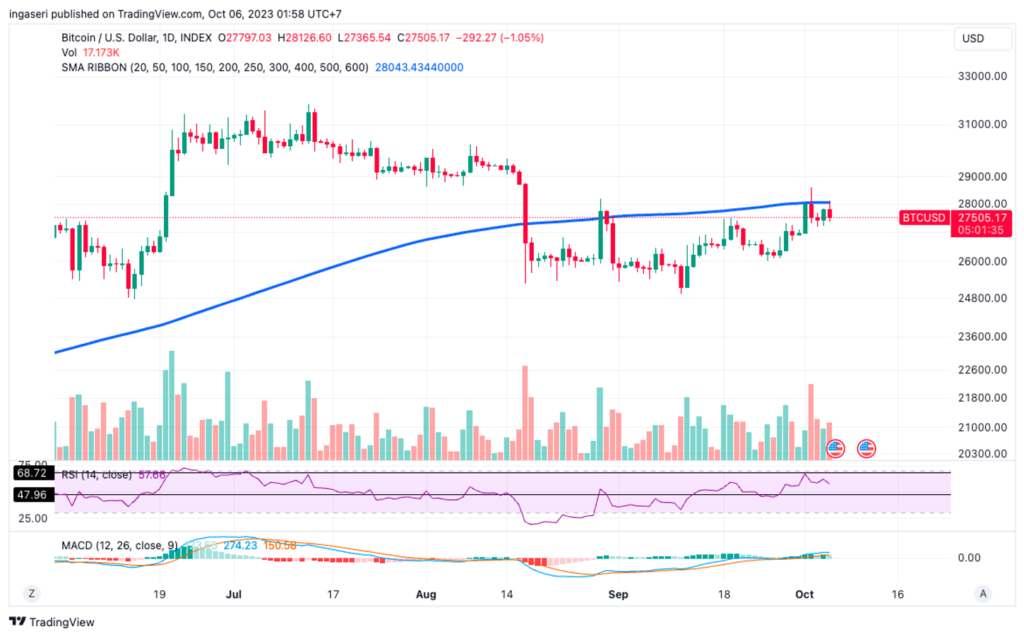
- ✍🏻 The price of BTC fell after being rejected at the 200-day MA at $28, but there is still potential for a move higher if it can break through the main resistance.
Macroeconomic Analysis
Personal Consumption Expenditures (PCE) & Core PCE
This week’s macroeconomic analysis begins with a review of the Personal Consumer Expenditure (PCE) data, which represents personal spending in the United States. PCE serves as a broad measure of changes in domestic personal spending. Meanwhile, core PCE is used to assess changes in personal consumption by excluding food and energy components, making it a more stable metric compared to total PCE. The PCE price index, which is derived from the PCE data, is an important method for assessing changes in consumer spending patterns and inflation.
Inflation slowed in August, according to the Core PCE measure that the Fed typically relies on. Some key Core PCE data include:
- Core PCE increased by a modest 0.1% compared to July and exhibited a year-over-year growth of 3.9%.
- This growth rate is the lowest level seen in over two years, though it still surpasses the Fed’s desired 2% target rate.
- The most recent headline PCE price index experienced a month-over-month (MoM) uptick of 0.4% and an annual increase of 3.5%.
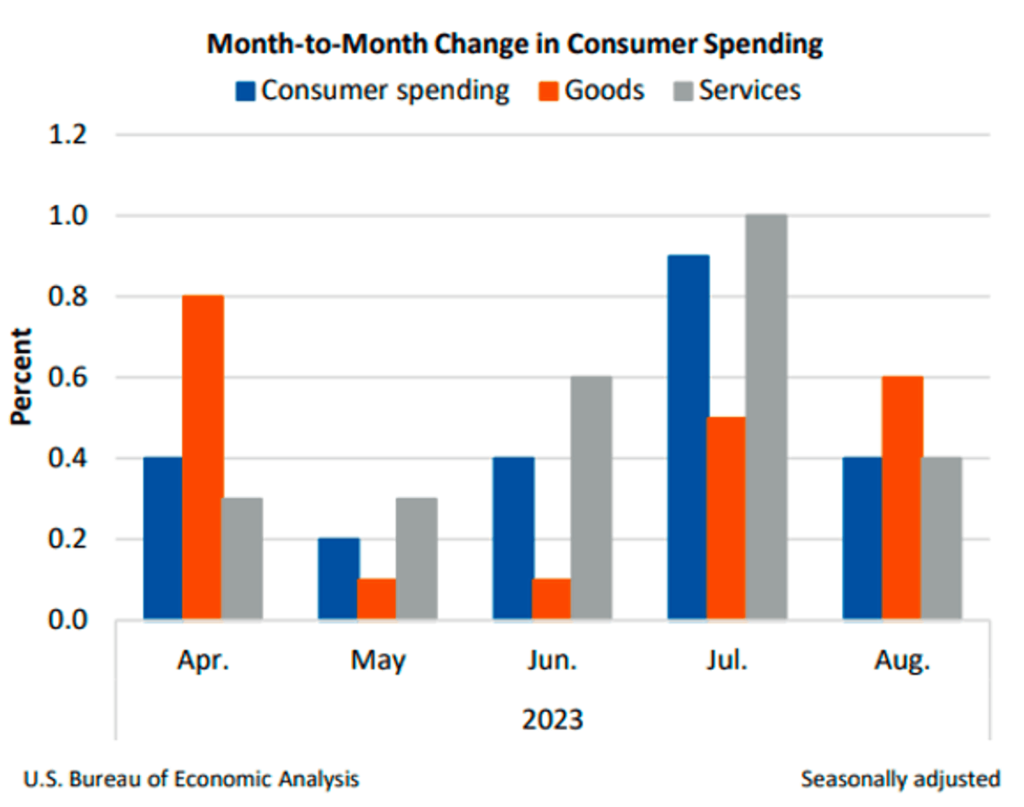
Personal Income and Spending
In line with the rise in the PCE data, Americans’ personal income and spending both increased by 0.4% in August, in line with market expectations.
The 0.4% increase in personal income and spending, combined with consumers’ increased inflation expectations, may influence the Fed to maintain higher interest rates for an extended period of time.
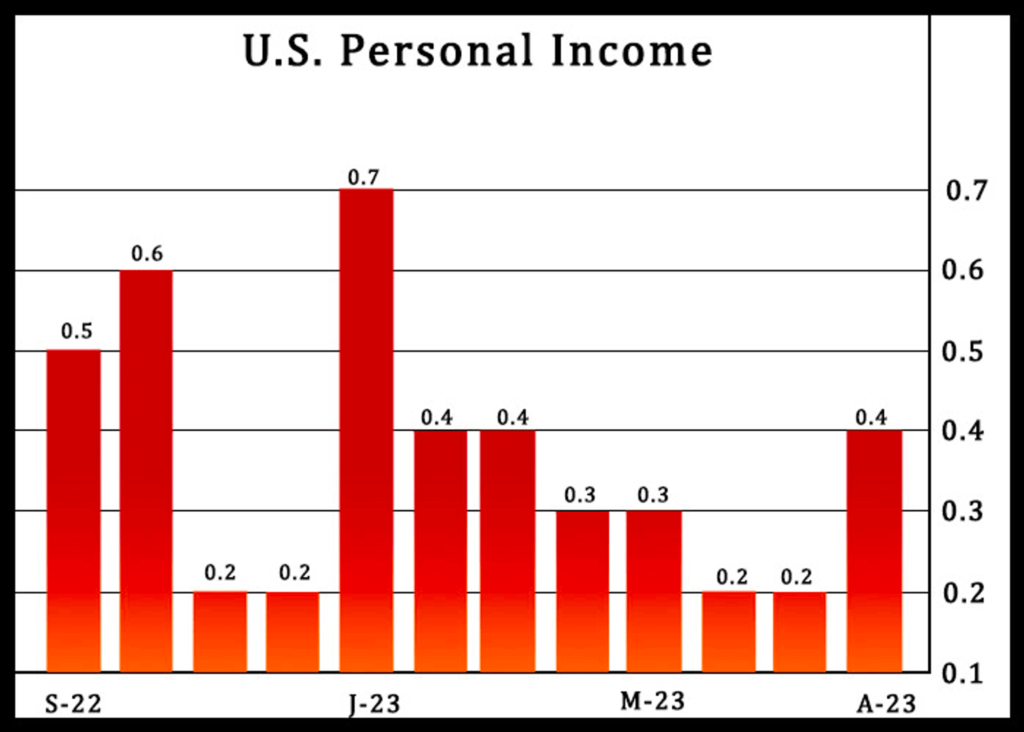
Meanwhile, data from the Commerce Department’s Bureau of Economic Analysis showed that personal income rose $87.6 billion from the previous month. The Bureau also reported that disposable personal income, which is personal income less personal current taxes, increased by $46.6 billion, or 0.2%.
In addition, the bureau said in a statement that the increase in current dollar personal income in August was mainly due to gains in compensation, personal investment income, rental income, and proprietors’ income. However, these gains were partially offset by a decline in receipts of personal current transfers.
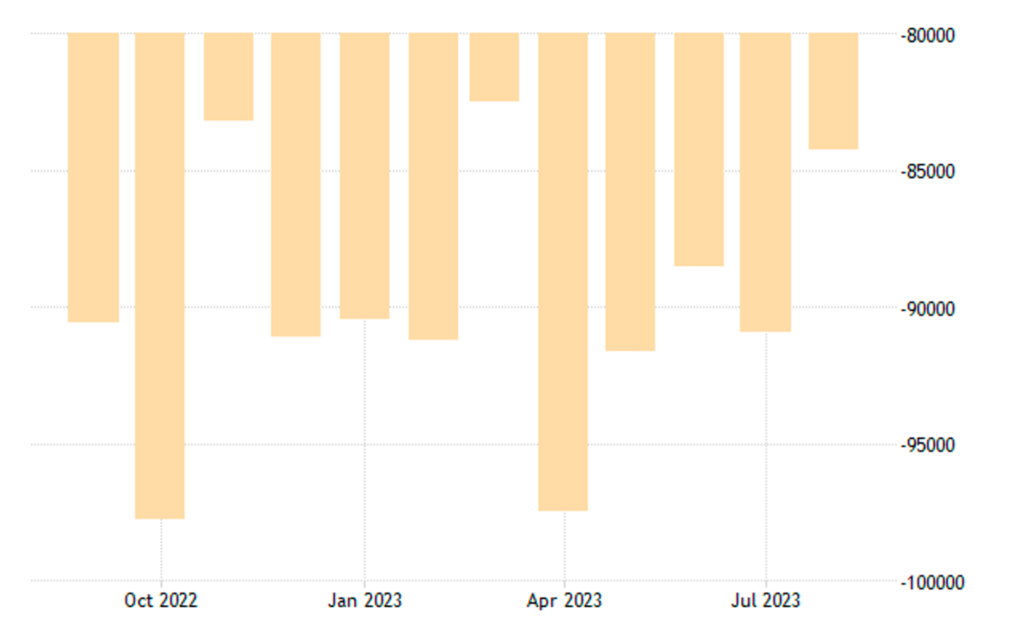
US Goods Trade Balance
In contrast to the increase in personal income, the U.S. goods trade balance posted a 7.3% deficit of $84.3 billion. This decline was influenced in part by lower consumer imports, including items such as the new iPhone.
Census Bureau data showed that the goods trade deficit decreased from $90.9 billion in July. In addition, an initial estimate of wholesale inventories showed a slight decline of 0.1% in August, while initial estimates of retail inventories showed a 1.1% increase in the same month.
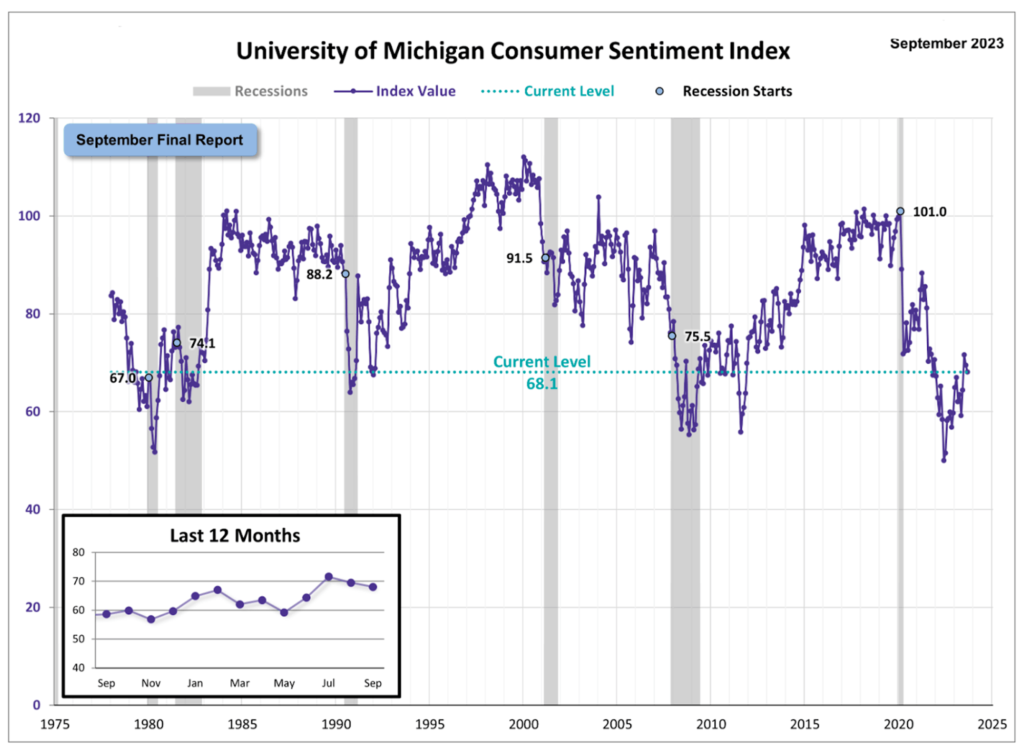
Michigan Consumer Sentiment
Despite the trade deficit, survey results show that the University of Michigan’s Consumer Sentiment Index fell only slightly from 69.5 in August to 68.1 in September. These results show relatively stable consumer confidence in the US.
However, there remain various concerns about the future direction of the economy, such as the potential for a federal government shutdown and labor disputes in the auto industry. Consumers have been reluctant to make definitive judgments about whether economic conditions have changed significantly from recent months.
S&P Global Services PMI & ISM Services PMI
From a service sector perspective, the latest Standard & Poor’s (S&P) Global and Institute for Supply Management (ISM) Purchasing Managers’ Index (PMI) surveys indicate that the service sector, which accounts for approximately 80% of U.S. gross domestic product (GDP), is showing signs of weakness.
In September, S&P Global’s Services PMI, a measure of whether activity in the services sector is contracting or expanding, fell to 50.1. A reading below 50 indicates that business activity is contracting.
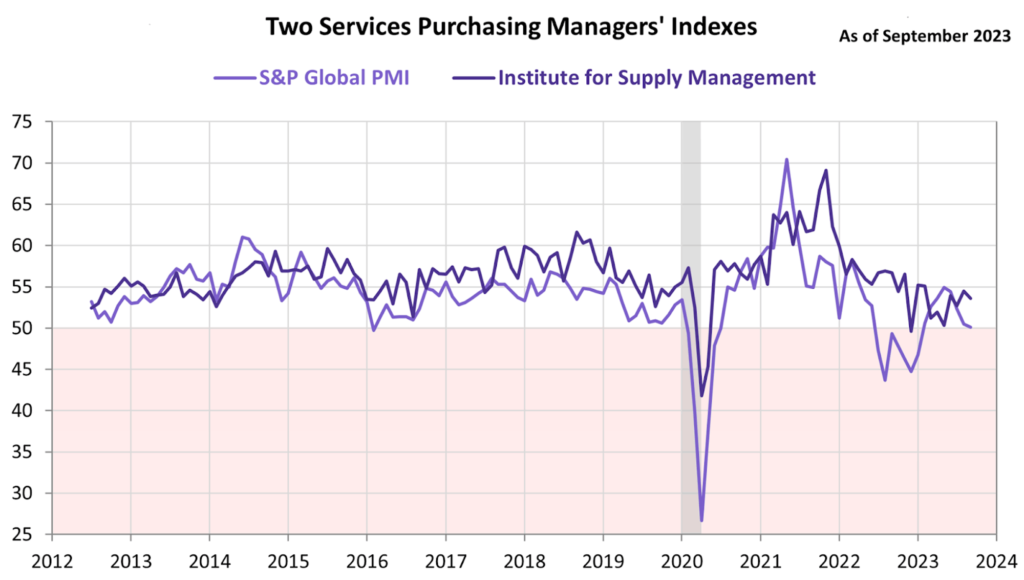
The most significant change in recent months has been a decline in demand for consumer services, including travel, tourism, and recreation, accompanied by a decline in financial services activity.
This marks the fourth consecutive month of slowing growth in the services sector, a notable decline from the pandemic-era peak of over 70 in May 2021, when the reopening after the COVID-19 shutdown led to a surge in business activity.
A separate survey by the Institute for Supply Management (ISM) showed that the service sector continued to expand for the ninth consecutive month, albeit at a slower pace than in August. The index fell nearly a percentage point from the previous month.
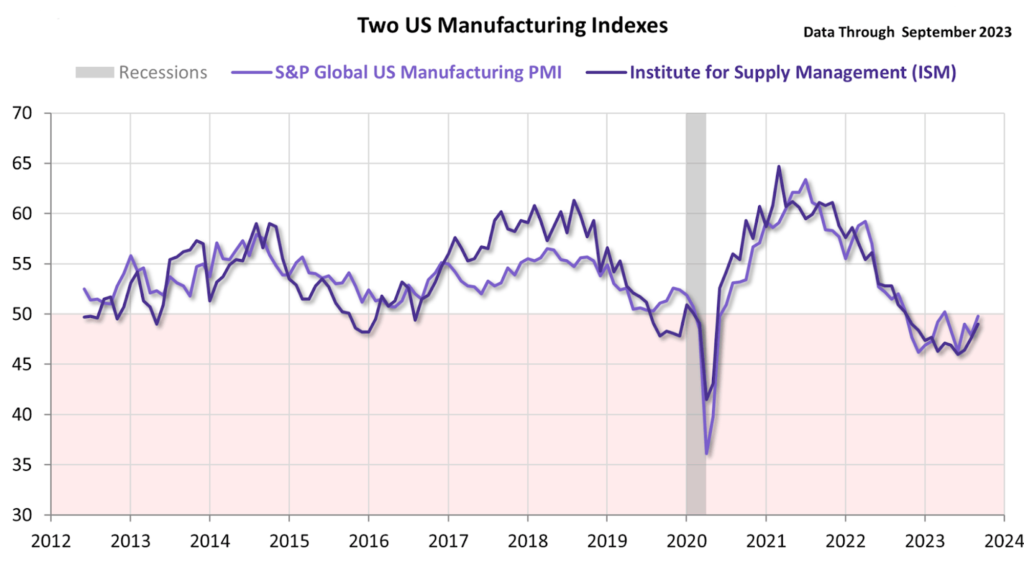
S&P Global Manufacturing PMI & ISM Manufacturing PMI
The S&P Global Manufacturing PMI rose from 47.9 in August to 49.8 in September, although it remains in contraction territory. This improvement follows a low of 46.3 in June. The ISM manufacturing index also rose to 49 from 47.6 last month, beating market expectations of 47.8.
Job Openings and Labor Turnover Survey (JOLTS)
Tuesday’s report from the Labor Department showed an increase in the number of job openings in August. There were 9.6 million job openings in August, up from a revised 8.9 million in July, and the increase was larger than expected.
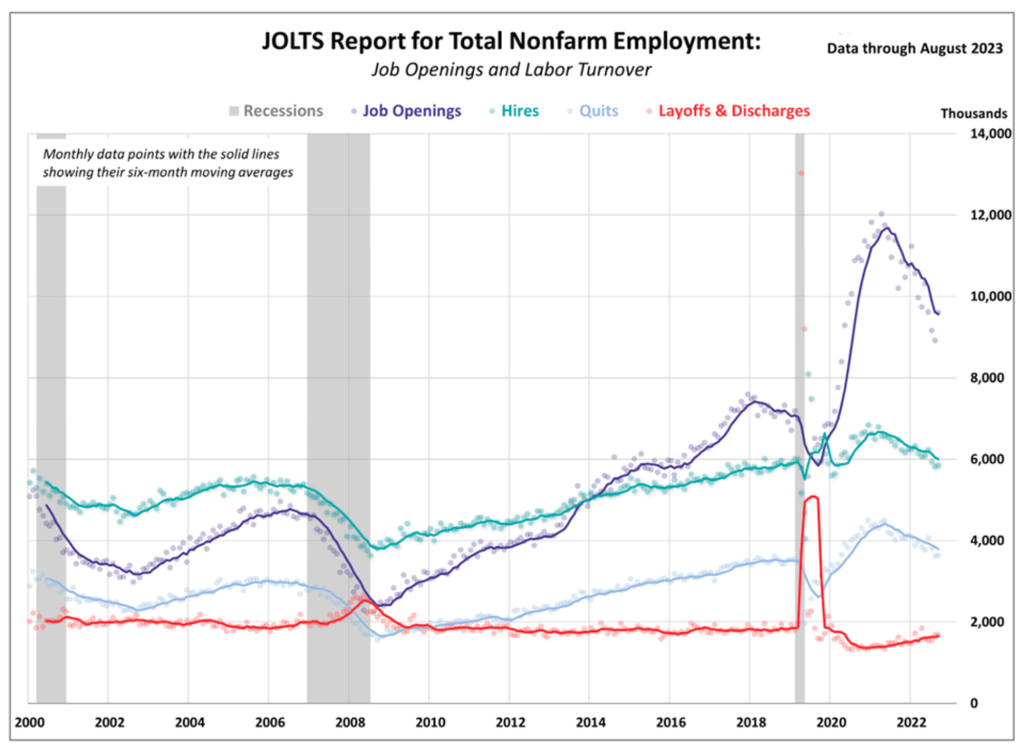
While the numbers are promising, investors have reacted cautiously to the updated figures. There are concerns that these numbers could be interpreted by the Federal Reserve as an indication that the economy is operating at too fast of a pace, potentially requiring higher interest rates to rein it in.
ADP Employment Change
Private employers added 89,000 jobs in September. Even with this addition, September showed the slowest growth rate since January 2021. This slowdown was driven by large institutions, which lost about 83,000 jobs, erasing gains made in August.
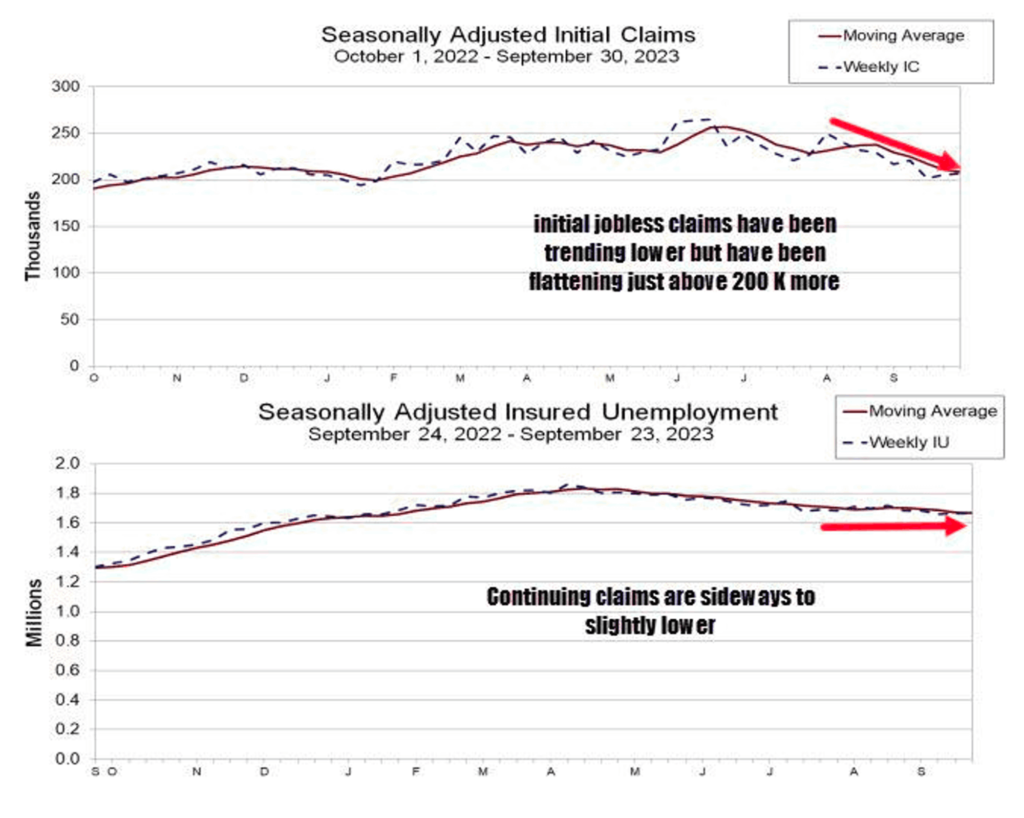
Unemployment Claims
Initial claims for unemployment benefits totaled 207,000 on September 30th, an increase of 2,000 from the previous period. This was below the Dow Jones consensus estimate of 210,000.
Continuing claims were relatively stable at 1.664 million, below the FactSet estimate of 1.68 million. The four-week moving average of claims fell to 208,750, a decrease of 2,500.
Following the release of the jobless claims report, the stock market fell 100 points and Treasury yields rose 3 basis points to a yield of 4.76%. This report comes at a critical time for the economy as the Federal Reserve considers the future of its monetary policy. Central bank officials are concerned that continued tightness in the labor market could put upward pressure on inflation, potentially necessitating additional interest rate hikes.
BTC Price Analysis
Last week, BTC was rejected at the 200-day MA at a price of $28K. As a result, BTC corrected back to the $27.5K level that it had previously breached. However, if BTC can break above this resistance line, there’s a strong possibility of a rally towards $30K or even higher.
On-Chain Analysis
- 📊 Exchange: As the exchange reserve continues to fall, it indicates lower selling pressure. Net deposits on exchanges are high compared to the 7-day average. Higher deposits can be interpreted as higher selling pressure.
- 💻 Miners: Miners’ are selling holdings in a moderate range compared to its one-year average. Miner’s revenue is in a moderate range, compared to its one-year average.
- 🔗 On-Chain: More investors are selling at a profit. In the middle of a bull market, it can indicate a market top. Long term holders’ movement in the last 7days was lower than the average. They have a motive to hold their coins. Investors are in an anxiety phase where they are currently in a state of moderate unrealized profits.
- 🏦 Derivatives: Long position traders are dominant and are willing to pay to short traders. Buying sentiment is dominant in the derivatives market. More buy orders are filled by takers. As open interest increases, it indicates more liquidity, volatility, and attention are coming into the derivative market. The increasing trend in open interest could support the current ongoing price trend.
- 🔀 Technicals: RSI indicates a neutral condition. Stochastic It indicates a neutral condition where the current price is in a moderate location between the highest-lowest range of the last 2 weeks.
News About Altcoins
- XRP Rallies After SEC Appeal Request Denied. XRP jumped 5% to $0.53 following a U.S. federal judge’s decision to deny the Securities and Exchange Commission’s (SEC) request to appeal a partial loss in its case against Ripple. The token’s rise was further bolstered by Ripple’s announcement that its Singapore subsidiary, Ripple Markets APAC, has received a license to operate in the city-state. Despite the setback, the SEC will still have the opportunity to appeal the case after a trial scheduled for April.
News from the Crypto World in the Past Week
- Simultaneous Bitcoin ETF Approvals Expected by Industry Experts. Martin Bednall, CEO of Jacobi Asset Management and former managing director at BlackRock, expects the Securities and Exchange Commission (SEC) to approve all spot bitcoin exchange traded fund (ETF) applications at the same time to prevent any “first mover advantage.” This sentiment was echoed by Steven Schoenfeld, CEO of VanEck-owned MarketVector Indexes, who believes that approvals may come sooner than originally predicted. Both industry experts assert that such decisions will significantly benefit the crypto markets.
- FriendTech developers made almost US$20 milliion. Since its launch in August, FriendTech, a social protocol that lets users buy or sell influencer profile tokens (termed “keys”) using ETH on the Base network, has amassed roughly $20 million in revenue. Ranking as the top revenue-generating app on Base and second-largest in the entire crypto domain based on DeFiLlama data, it’s pacing towards an annual revenue of $180 million. The platform has garnered close to $40 million in user fees, with 10% of social token trading volume being taxed. This fee is then equally split between the project’s team as revenue and users whose keys are traded.
- Brazil is initiating a blockchain-powered national identity program, with Rio de Janeiro, Goiás, and Paraná being the first states to implement on-chain identification documents. Alexandre Amorim, the president of Serpro, emphasized the significance of blockchain in ensuring data protection and fraud prevention, asserting that the b-Cadastros blockchain platform amplifies the security and trustworthiness of the National Identity Card project.
Cryptocurrencies Market Price Over the Past Week
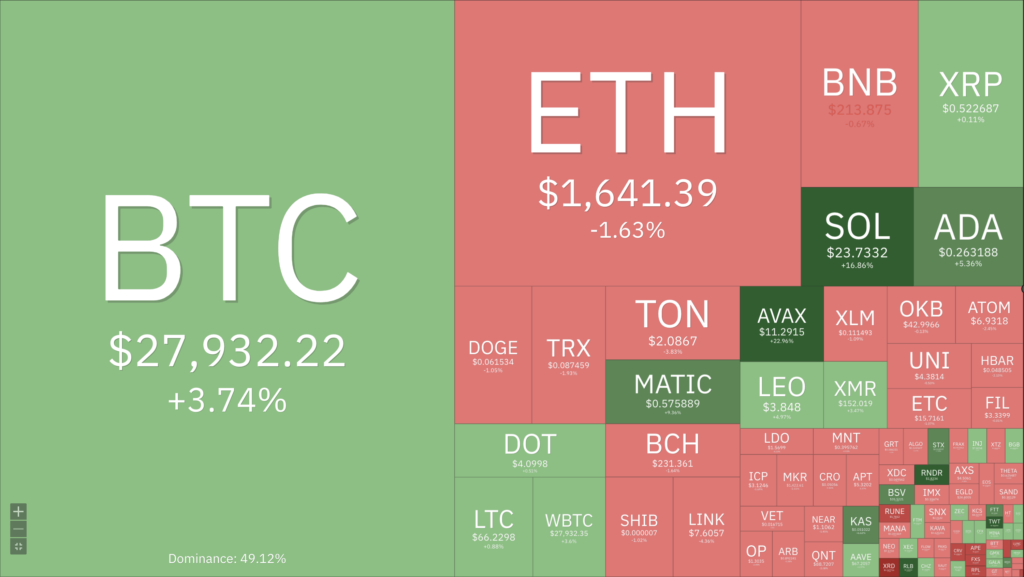
Cryptocurrencies With the Best Performance
- Avalanche (AVAX) +21,01%
- Render (RNDR) +18,58
- Solana (SOL) +17,07%
- Polygon (MATIC) +9,29%
Cryptocurrencies With the Worst Performance
- ApeCoin (APE) -11,56%
- THORChain (RUNE) -10,17%
- Curve DAO (CRV) -9,12%
- Rocket Pool (RPL) -7,02%
References
- Yogita Khatri, SEC likely to approve all spot bitcoin ETFs at once, says former BlackRock executive, theblock, accesed on 7 October 2023.
- Brian McGleenon, XRP leads crypto rally after SEC’s appeal bid is rejected, theblock, accesed on 7 October 2023.
- Vishal Chawla, FriendTech developers rake in nearly $20 million since August launch, theblock, accesed on 7 October 2023.
- Ana Paula Pereira, Brazil rolls out blockchain-based digital ID, Cointelegraph, accesed on 7 October 2023.