
The crypto market is showing strong recovery potential, given the weekly candlestick formation and price action last week. Coupled with the positive macroeconomic news, we can expect some bullish momentum this week, with some notes on risk management and caution.
The weekly crypto market analysis was made by traders and analysts in Volubit for educational purposes only, not as financial advise.
The Presence of New Narrative
This week will see significant economic events, namely the FOMC and the announcement of the Federal Reserve’s interest rate decision. Ahead of these events, it’s a good idea to maintain risk and be cautious of market volatility.
In addition, last week saw a “revival” of the Base ecosystem and AI Agent sector, which was reflected in the emergence of the x402 protocol as well as the rise of various assets in the AI Agent sector and Base ecosystem such as VIRTUAL and AIXBT. This increase is expected to continue this week, along with the potential for strengthening from other ecosystems with similar sectors.
Bitcoin (BTC) Analysis
Potentially Testing the Highest Price (ATH)
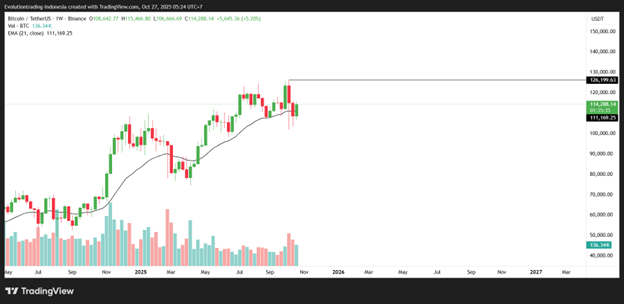
Bitcoin took center stage this week with a bullish candlestick forming after experiencing a significant bounce off the exponential moving average indicator on the 1-week timeframe.
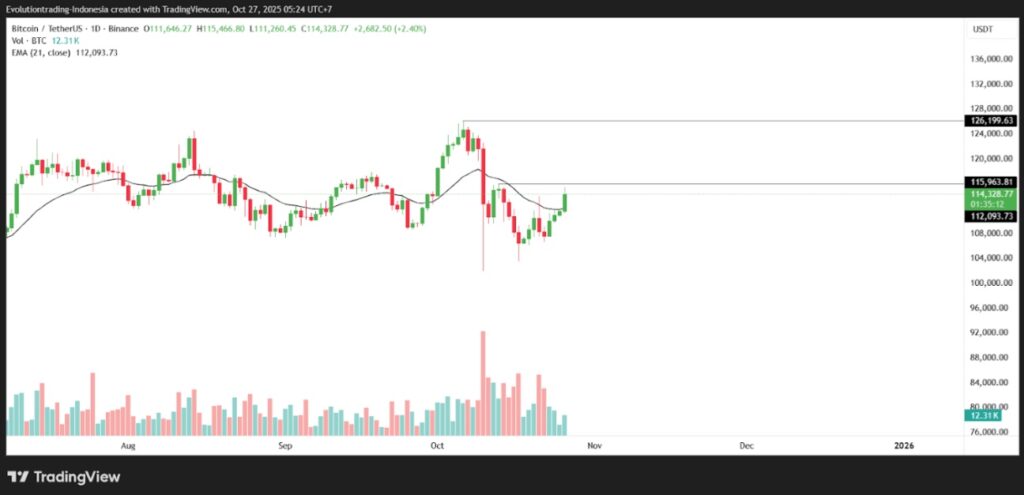
On the 1-day timeframe, it appears that Bitcoin is trying to test its crucial level of $115,963 which is the high formed on October 13, 2025. If this level is successfully broken by Bitcoin, it will form a higher high which is a confirmation that the price movement trend has increased.
The uptrend in Bitcoin, accompanied by support from indicators such as the 21 EMA, could be an indication of Bitcoin’s potential to test its high of $126,199.
The bullish momentum for Bitcoin is supported by several important factors:
- Bullish Harami Candlestick Formation on the 1-Week Timeframe: Is an indication of a strong bullish reversal.
- Bounce off the 21 EMA 1-Week Timeframe: The bounce from the 21 EMA indicator, one of the strongest indicators to show long-term trends, suggests that Bitcoin could experience significant gains this week.
- Upside Projection: If Bitcoin price is able to break and hold above the $115,963 level, Bitcoin has a great opportunity to continue its post-recovery increase, with the closest target being at the $121,000 level and potentially testing its highest price.
Ethereum (ETH) Analysis
Breakout with Target of $4,314
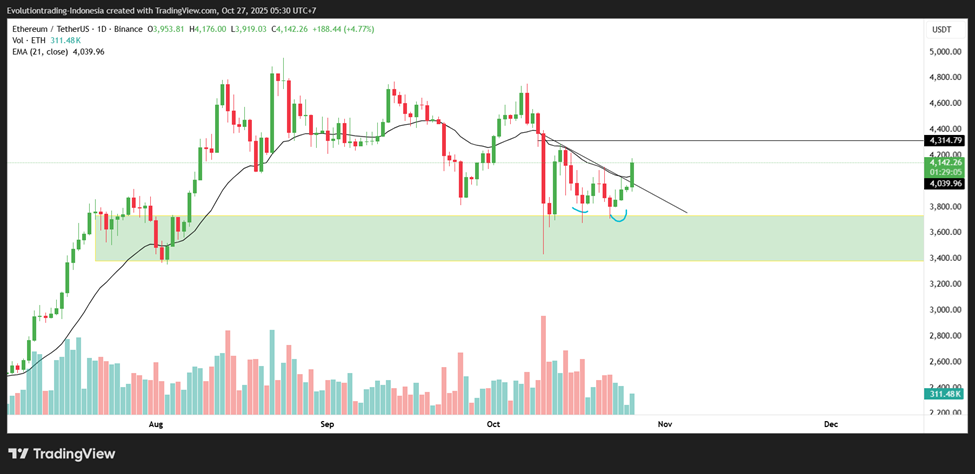
Apart from Bitcoin, Ethereum is also in the spotlight by having strong signals for an increase, namely above the 21 Exponential Moving Average (EMA) on a 1-day timeframe, as well as a breakout from the double bottom pattern formed around the price of $3,800 and a few days back.
The closest resistance for Ethereum is $4,314, with the potential for further gains to test the highest price for Ethereum, if it makes it to the $4314 level.
Ethereum’s upside potential is supported by several important factors:
- Breakout of Double Bottom Pattern: The double bottom pattern, which signals a reversal from a downtrend to an uptrend, has been confirmed by Ethereum.
- Breakout of 21 EMA: The bounce of the daily timeframe 21 EMA indicator, which is one of the strong indicators to show the long-term trend, indicates the potential for Ethereum to still rise this week.
- Projected Upside: Ethereum has the potential to go up to $4,314, and higher if that level can be broken. However, stay alert for corrections in the smaller timeframes.
Solana Analysis (SOL)
Upside Potential, But Still Trapped in Downtrend
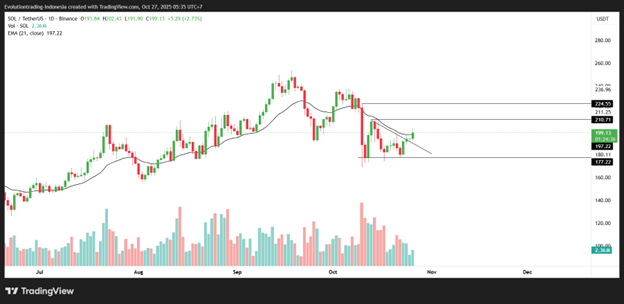
Solana also showed indications of potential upside as shown by the formation of a bullish engulfing candle on Thursday, October 23, 2025 and is currently testing the 21 EMA of the 1-day timeframe.
Some factors that can affect Solana:
- Crucial Support Level: The $177 level, is a price level that serves as support. This level has successfully resisted Solana’s price decline.
- 21 EMA: This indicator will act as resistance for Solana. Solana’s current price is still below the 21 EMA showing no further bullish confirmation.
- Upside Projection: If the price of Solana is able to surpass the 21 EMA on the 1-day timeframe, then there is an opportunity to continue rising to $210.
On-Chain Analysis: An Indication of Spot Market Strength
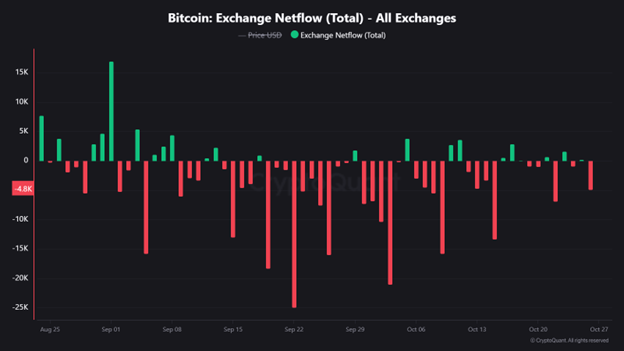
Exchange Netflow data shows an interesting market sentiment. Throughout October 2025, Bitcoin’s movement was dominated by Bitcoin outflows from exchanges. This indicates accumulation by market participants moving their assets off exchanges, which is a positive sentiment for the market. Based on data throughout October, spot positions on crypto assets are still relatively untouched and the market has recovered from the crash that occurred on October 10.
Macroeconomic Analysis of the Week
The focus of global markets this week will be on the dynamics between US President and Chinese President Xi Jinping which could trigger market volatility. In addition, interest rate cut and FOMC announcements will also occur this week.
Main Focus:
- Announcements and potential negotiations between the United States and China
- Interest rate and FOMC announcement
There have been many market predictions that interest rates will be cut again, and the end of Quantitative Easing will potentially create an inflow of funds into risky assets such as crypto.
Crypto Asset Performance in The Last Week
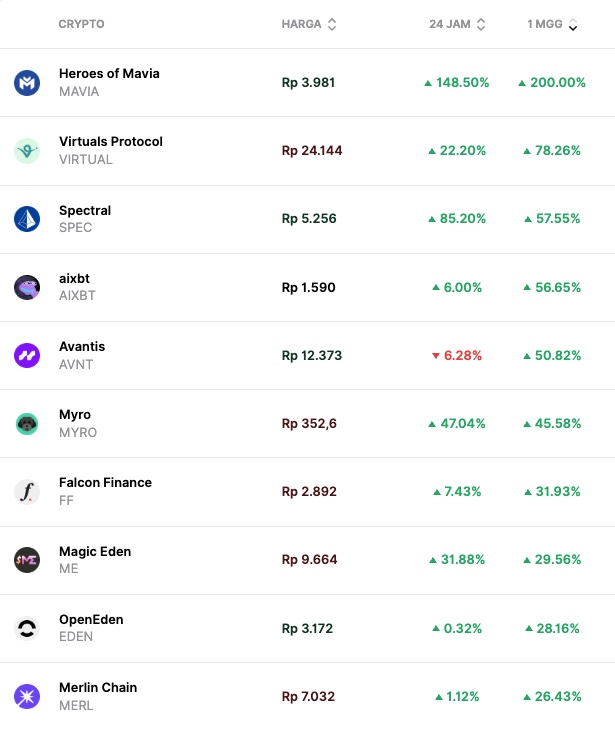
Top Performing Crypto Assets
- Heroes of Mavia (MAVIA) + 200%
- Virtuals Protocol (VIRTUAL) + 78.26%
- Spectral (SPEC) +57.55%
- aixbt (AIXBT) +56.65%
Worst Performing Crypto Assets
- Kadena (KDA) -74.31%
- Synthetix (SNX) -29.26%
- Cloud (CLOUD) -27.28%
- ZeroLend (ZERO) -26.93%
Reference Source:
- CryptoQuant | CryptoQuant.com
- Investing.com