
Bitcoin (BTC) remains on a downtrend as the U.S. dollar gains strength. There is growing speculation and concern that the dollar’s ascent will persistently exert downward pressure on BTC prices and weaken the overall cryptocurrency market. Will BTC’s price continue its decline? Find out in the analysis below.
The Pintu trading team has gathered critical information and analyzed the general economic situation and the crypto market’s movements over the past week. However, it should be noted that all information in this Market Analysis is intended for educational purposes, not as financial advice.
Market Analysis Summary
- 🔴 The U.S. Purchasing Managers’ Index (PMI) fell sharply in August, adding to fears of stagflation.
- 🆘 The probability of a November rate hike is bolstered by comments from the Fed’s Collins that they have not been effective in curbing inflation.
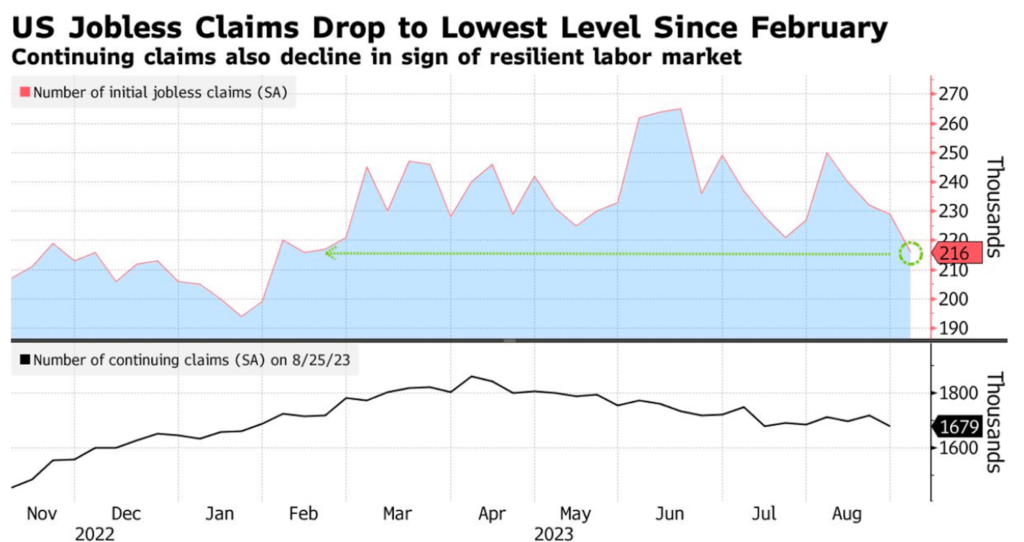
- 📉 Unemployment claims in the U.S. have reached a new low, indicating a stable job market.
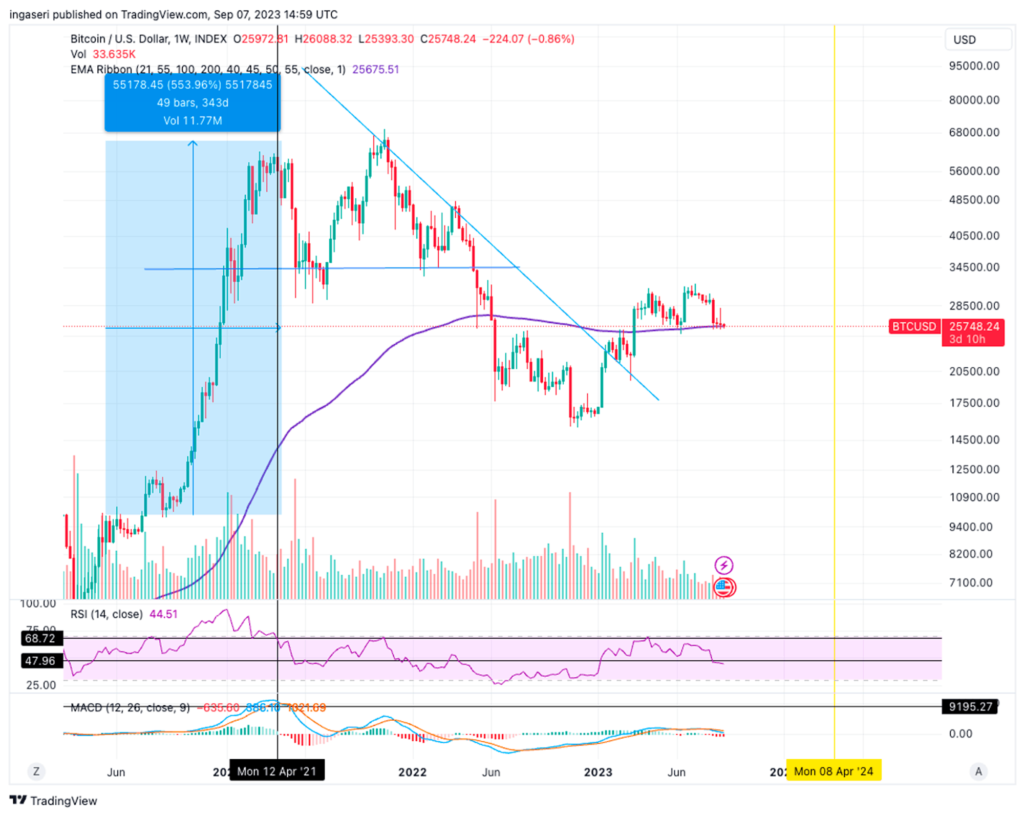
- ✍🏻 The price of BTC is at risk of falling due to the strengthening U.S. dollar, with the potential to drop as low as $23,500. Currently, BTC is holding at the 200-week exponential moving average (EMA) support line.
Macroeconomic Analysis
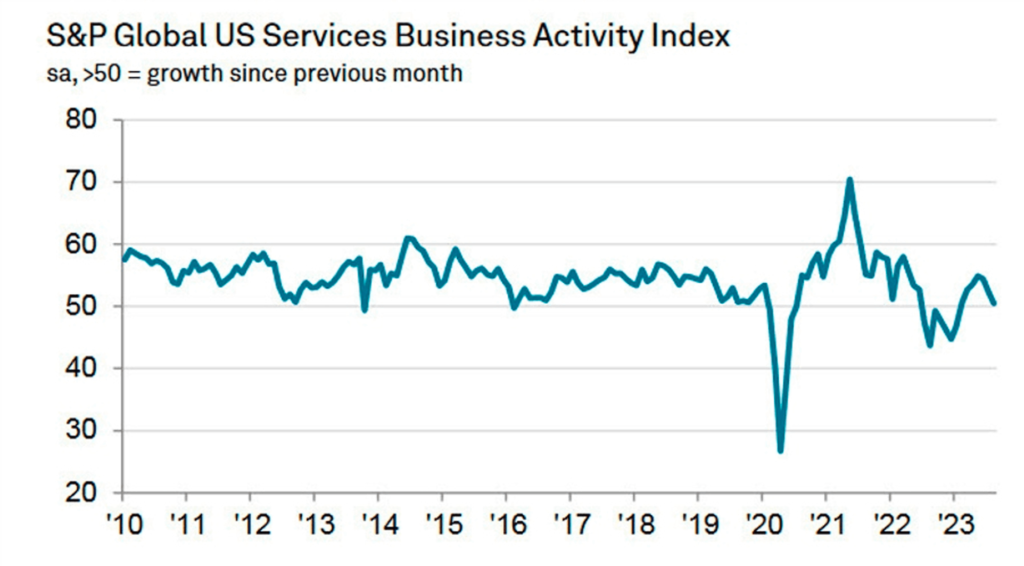
This week’s analysis begins with a decline in the S&P Global US Purchasing Managers’ Index (PMI) for August 20-23, which fell significantly to 50.5 from July’s 52.3. The composite index also fell to its lowest level since February, dropping from 50.4 to 50.2.
The survey results point to growing concerns about stagflation, as persistent price pressures coincide with a significant slowdown in economic activity.
<aside> 💡 Stagflation is a condition in which the economy does not grow while prices continue to rise.
</aside>
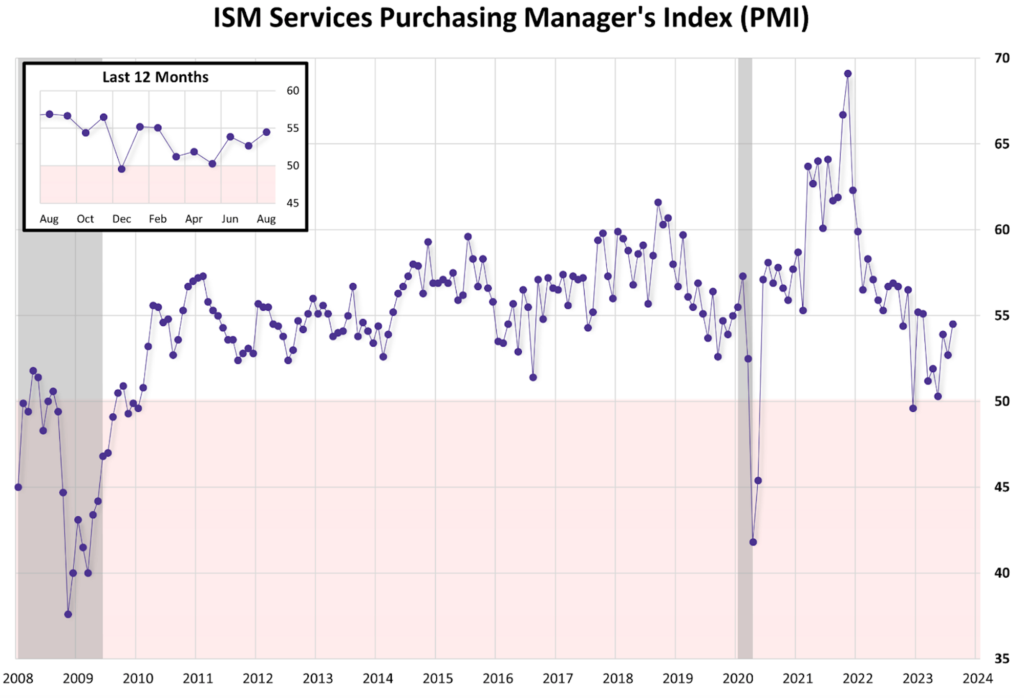
Despite a decline in overall business activity, the services sector actually extended its growth streak in August, with the details as follows:
- The Institute of Supply Management (ISM) Services PMI rose from 52.7 to 54.5, surpassing market expectations set at 52.5.
- The Employment Index also improved, climbing from 50.7 to 54.7.
- The Prices Paid Index increased from 56.8 to 58.9.
The services sector recorded an accelerated growth rate, with increases in all four sub-indexes contributing directly to the composite services PMI. While sentiment among business survey committee respondents varied across industries, the majority were positive about business and economic conditions, with a slight moderation in the pace of growth observed in the services sector.
Although the service sector appears positive, caution is warranted as the likelihood of a rate hike in November has increased. This increased likelihood is further exacerbated by comments from Fed’s Collins, who emphasized that the Fed has not been effective in taming inflation.
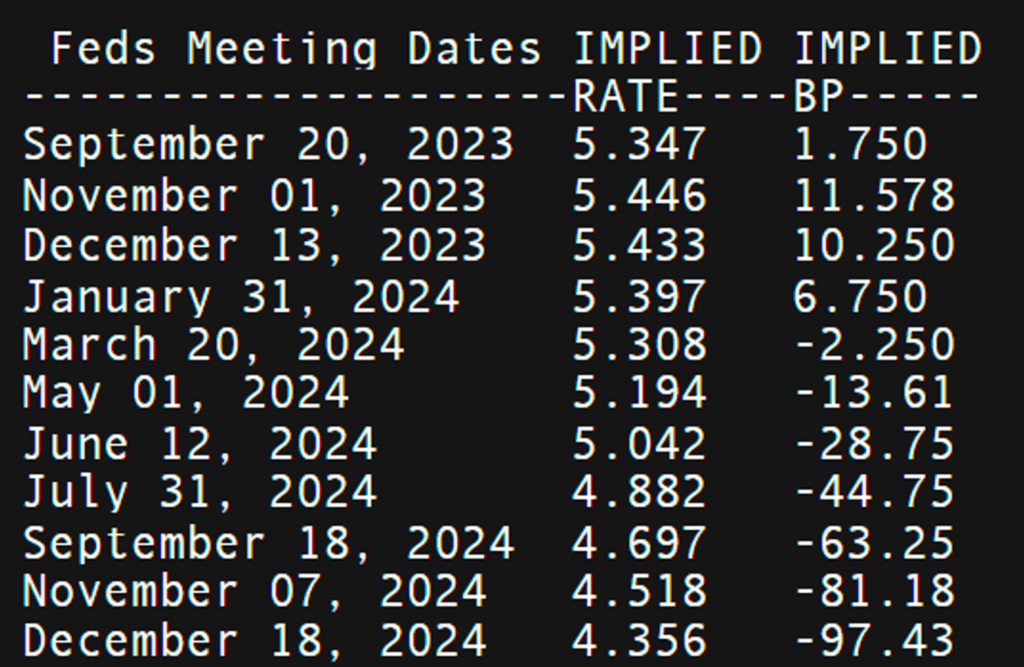
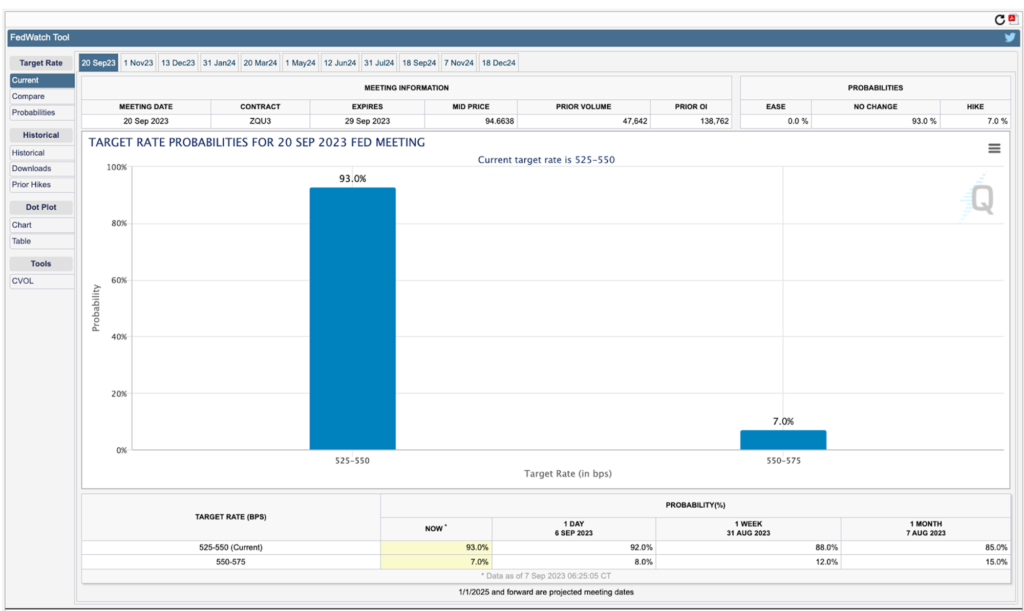
On the interest rate front, the Federal Reserve is likely to keep its benchmark interest rate in the range of 5.25% to 5.50%, which it raised by one percentage point last quarter. In the financial markets, there’s a 50-50 chance that the Federal Reserve’s rate-hiking campaign, which began 18 months ago, has come to an end.
Nevertheless, Fed officials continue to maintain a flexible approach. They believe that the cumulative 5.25 percentage point rate hikes implemented since March 2022 have had a dampening effect on the economy, limited job growth and, most importantly, may have suppressed inflation, which rose to its highest level in 40 years last year.
Data in the six weeks following the Fed’s most recent rate hike tend to support this view. During this period, the economy added an average of 150,000 jobs per month over the last three months, a significant slowdown from the previous three months. In addition, inflation, as measured by the Fed’s preferred indicator, was 3.3% in July, down sharply from 7% last summer.
A policymaker such as Fed Governor Christopher Waller asserts that the central bank will have the opportunity to assess new data before making decisions on the need for further rate hikes or the viability of maintaining current rates.
Applications for U.S. jobless benefits fell to their lowest level since February, according to the latest data from the Labor Department, underscoring companies’ reluctance to lay off workers.
For the week ending September 2nd, initial jobless claims fell by 13,000 to a total of 216,000. This figure exceeded all economists’ expectations of 234,000.
In addition, continuing claims, which serve as a proxy for the number of people receiving unemployment benefits, fell to 1.68 million for the week ending August 26. This is the lowest level since the previous July, when the figure was 1.72 million and the market consensus was 1.71 million.
BTC Price Analysis
The price of BTC has the potential to go as low as $23,500. One of the reasons for this is the strengthening performance of the US Dollar Index (DXY), which has shown an inverse correlation with bitcoin over the past few years. The continued rise in the value of the dollar is raising concerns about its negative impact on BTC and the broader crypto market in the short term.
Some analysts believe that a further rise in the value of the dollar and low trading volumes for BTC could continue to drive BTC prices lower. Currently, BTC is being held at the 200-week EMA support line (purple line at $25,700). Resistance is at the 200-day MA at $27,500.
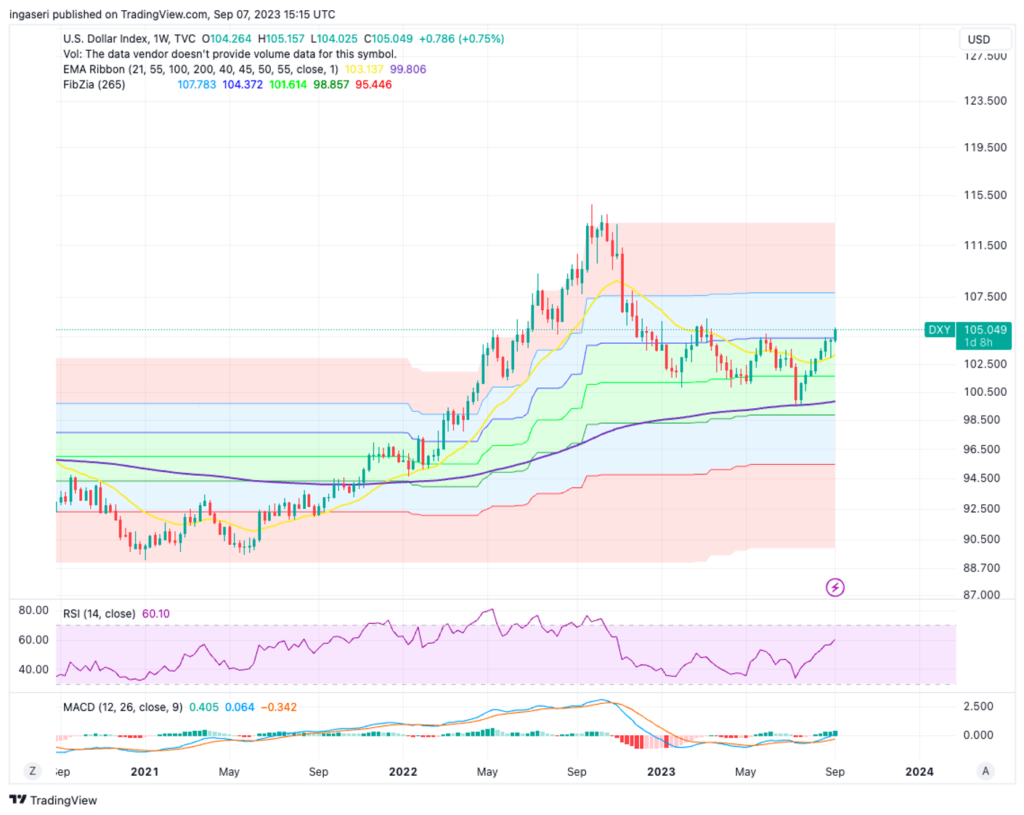
The DXY (Dollar Index) has experienced a significant surge, reaching its highest level since March, marking a pivotal moment for BTC and the broader crypto sector. The DXY, which measures the performance of the U.S. dollar against six major currencies, has continued its upward momentum, crossing the 104 threshold in the last four days to reach a five-month high of 105.
On-Chain Analysis
- 📊 Exchange: As the exchange reserve continues to rise, it indicates higher selling pressure. Net deposits on exchanges are low compared to the 7-day average. Lower deposits can be interpreted as lower selling pressure.
- 💻 Miners: Miners’ are selling less holdings compared to its one-year average. Miner’s revenue is in a moderate range, compared to its one-year average.
- 🔗 On-Chain: More investors are selling at a loss. In the middle of a bear market, it can indicate a market bottom. Long term holders’ movement in the last 7days were lower than the average. They have a motive to hold their coins. Investors are in a fear phase where they are currently with unrealized profits that are slightly more than losses.
- 🏦 Derivatives: Long position traders are dominant and are willing to pay to short traders. Selling sentiment is dominent in the derivatives market. More sell orders are filled by takers. As OI decreases, it indicates investors are closing futures positions and possibility of trend reversals. In turn, this might trigger the possibility of long/short-squeeze caused by sudden price movement or vice versa.
- 🔀 Technicals: Relative Strength Index (RSI) indicates a neutral condition. It indicates a oversold condition where the current price is close to the bottom of the last 2 weeks and a trend reversal can occur.
News About Altcoins
- Paolo Ardoino, the Chief Technology Officer of Tether, tweeted that Tether currently holds U.S. Treasury bonds worth $72.5 billion, surpassing countries like the United Arab Emirates, Mexico, Australia, and Spain. This makes Tether the 22nd largest holder of U.S. Treasury bonds globally. According to Paolo, $USDT is the most widely used stablecoin in the world, and for many communities, USDT serves as a way to protect themselves from the inflation of their national currencies.
- Visa has announced its plans to enhance cross-border payment settlements using the stablecoin USD Coin (USDC) on the Solana blockchain. Working with merchant acquirers Worldpay and Nuvei, Visa aims to enable settlements in USDC instead of traditional fiat currencies. The move aims to take advantage of Solana’s speed and scalability to mainstream the use of stablecoins for digital payments. Initially, Visa started the project in collaboration with crypto exchange crypto.com leveraging Ethereum for cross-border payments associated with crypto.com’s Visa cards.
News from the Crypto World in the Past Week
- Jay Clayton, the former chairman of the U.S. Securities and Exchange Commission (SEC), stated that the United States will approve a spot-based Bitcoin Exchange-Traded Fund (ETF). This statement came after a federal court ruled that the SEC’s rejection of Grayscale’s proposal to convert its Bitcoin Trust (GBTC) into an ETF was arbitrary. The ruling has forced the SEC to review its denial on grounds other than the risk of fraud and market manipulation. Major companies like BlackRock, Fidelity, and Invesco are also awaiting the SEC’s decision on spot-based Bitcoin ETFs, expected to be announced by mid-October at the latest. JPMorgan also believes that a spot-based Bitcoin ETF will eventually be approved in the U.S.
- Grab, the largest ride-hailing app in Southeast Asia, has integrated a Web3 wallet into its platform. This marks a significant step in bringing blockchain technology to Grab’s 180 million users. Currently, the Web3 wallet only supports two types of digital assets: SG Pitstop vouchers and digital collectibles from the SG Pitstop Pack. For now, the Web3 wallet is only operational in the Singapore region.
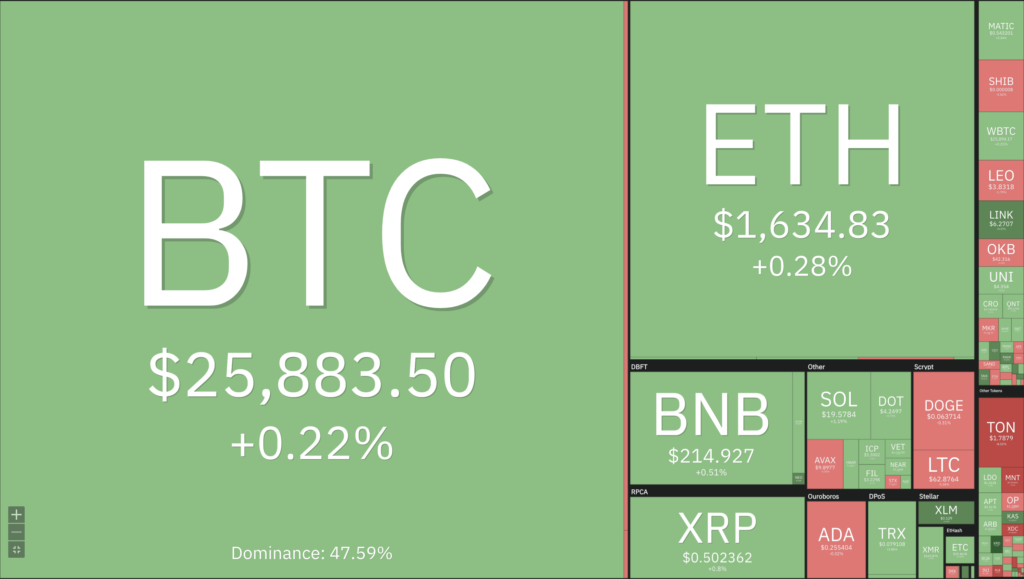
Cryptocurrencies Market Price Over the Past Week
Cryptocurrencies With the Best Performance
- Synthetix (SNX) +14.33%
- Stellar (XLM) +13.16%
- IOTA (MIOTA) +12.07%
- Render (RNDR) +10.58%
Cryptocurrencies With the Worst Performance
- Gala (GALA) -12.82%
- Mantle (MNT) -8.05%
- dYdX (DYDX) -6.37%
- ApeCoin (APE) -4.64%
References
- Yogita Khatri, Spot bitcoin ETF approval is ‘inevitable,’ says former SEC chairman, Theblockco, accessed on 9 September 2023.
- Martin Young, Popular Southeast Asian Super App Grab Adds Polygon-Based Web3 Wallet, beincrypto, accessed on 9 September 2023.
- Paoloardoino, While @Tether_to reached 72.5B exposure in US t-bills, X, accessed on 9 September 2023.
- Mat Di Salvo, Visa Promises Faster Credit Card Payments With USDC on Solana, Decrypt, accessed on 9 September 2023.