
The third week of October 2025 closed with a very interesting dynamic in the crypto market. After a sharp correction in the middle of the month, major assets such as Bitcoin and Ethereum began to recover, but investor sentiment is still clouded with caution.
The main highlights of the week came from the price surge of Paxos Gold (PAXG), Fusaka’s Ethereum upgrade plans, and expectations for the US inflation data (CPI) to be released on October 24.
The weekly crypto market analysis was made by traders and analysts in Volubit for educational purposes only, not as financial advise.
PAXG is the Star of the Week
Paxos Gold‘s gold token (PAXG) stole the show after trading above the spot gold price on several global exchanges.
This phenomenon signals the growing demand for crypto assets backed by real-world assets (RWAs), amid macro uncertainty and stock market turmoil.
PAXG’s movement also triggered the liquidation of short positions in the derivatives market, which magnified weekly volatility.
US Economic Calendar: CPI is the Main Catalyst
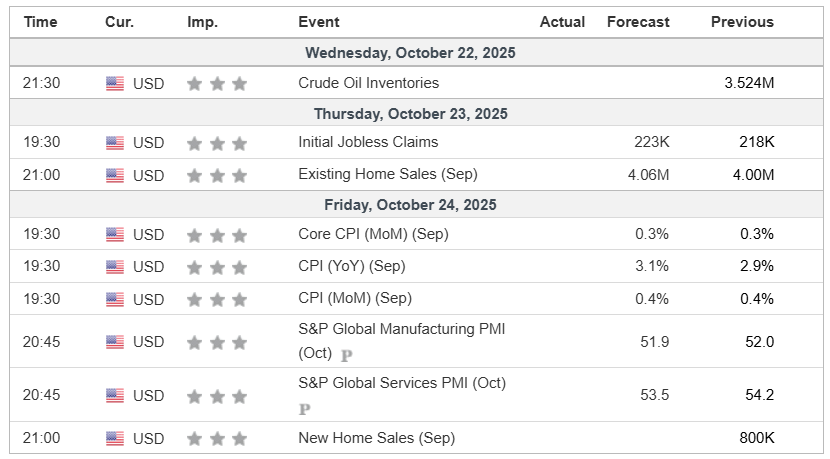
A number of important US economic data to be released this week is expected to influence the direction of global markets, including crypto.
Inflation data (CPI) will be a key market reference this week. If inflation exceeds the forecast (3.1% YoY), the chances of a rate cut by the Fed could decrease, pressuring risky assets such as crypto. But if the data is lower, a potential rebound could continue until the end of the month.
Market Sentiment Analysis: Fear Still Dominates
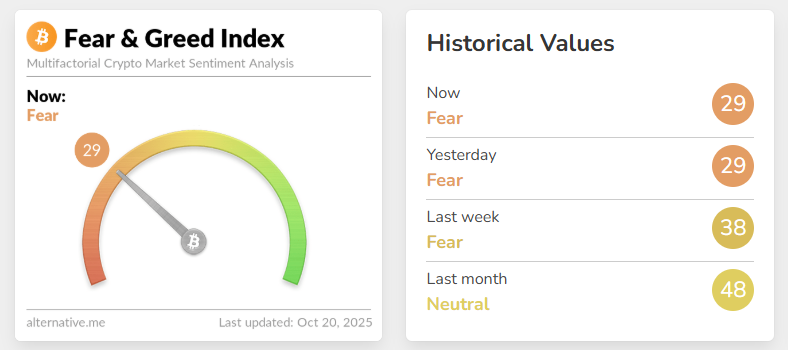
According to the latest Crypto Fear & Greed Index (October 20, 2025) data from alternative.me, the index value stands at 29 (Fear) – unchanged from the previous day, and down significantly from 38 last week and 48 a month ago.
📉 Interpretation:
- Crypto market sentiment remains bearish, with fear dominating.
- This decline reflects investors’ concerns over macro data (CPI & Fed) as well as Bitcoin’s unstable price fluctuations.
- Historically, levels below 30 are often considered accumulation zones by long-term investors, signaling potential opportunities amid market fears.
BTC Technical Analysis
After two consecutive weeks of weakness that created a cautious sentiment in the market, Bitcoin (BTC) showed early potential for a reversal today. Crucial price action is observed at key support levels, which will determine the direction of BTC’s movement in the short term.
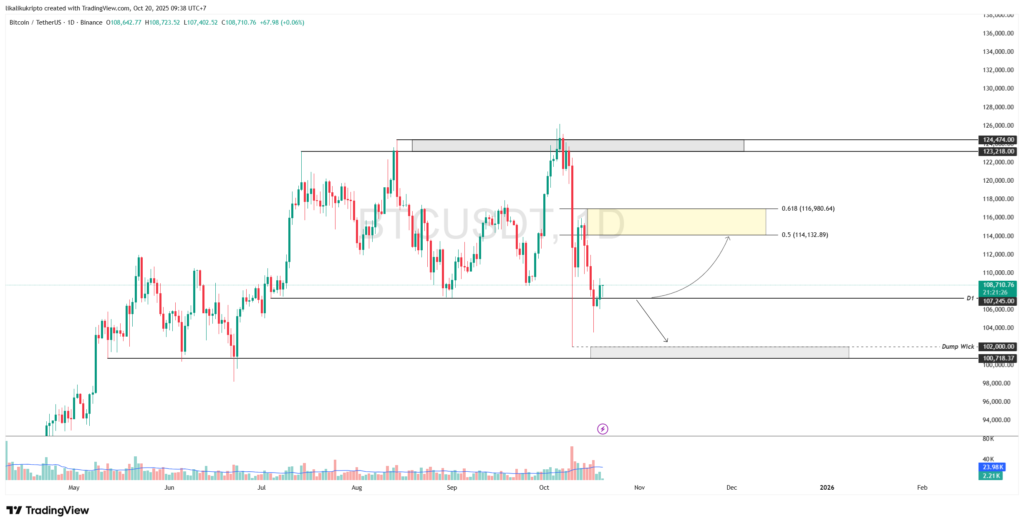
On the daily chart, this morning’s candle managed to close above the horizontal support level at $107,245. This level was previously broken downwards on October 17 and has now been reclaimed by buyers. The successful reclaiming of this level is a positive signal indicating resistance to selling pressure and opening up opportunities for further recovery.
Bullish Scenario
If Bitcoin is able to maintain its position and consolidate above the $107,245 level, then this level will be confirmed as solid support. This scenario could trigger a continuation of the buying momentum and push the price towards the next resistance zone. The main rebound targets are between $114,132 (0.5 Fibonacci retracement level) and $116,980 (0.618 Fibonacci retracement level).
Bearish Scenario
Conversely, if the price fails to hold and closes below the $107.245 support level again, this would indicate that the breakout was a fakeout. Rejection of this level will reopen the potential for further weakness. The immediate downside target is at the next significant support area in the $100,718 – $102,000 zone, which previously served as a liquidity area (dump wick).
Conclusion
The $107,245 level is a crucial pivot point for Bitcoin price movement in the next few days. The ability to hold above this level will be a confirmation of buyers’ strength and pave the way for a recovery rally. However, failure to hold it would signal a potential continuation of the downtrend. Market participants are advised to closely monitor the price reaction around this key level.
ETH Technical Analysis
Ethereum (ETH) is at a crucial point after successfully reclaiming an important psychological and technical level. Price action in the coming days will largely depend on its ability to hold these levels. This will be key to determining if the bullish momentum can continue or if selling pressure will return.
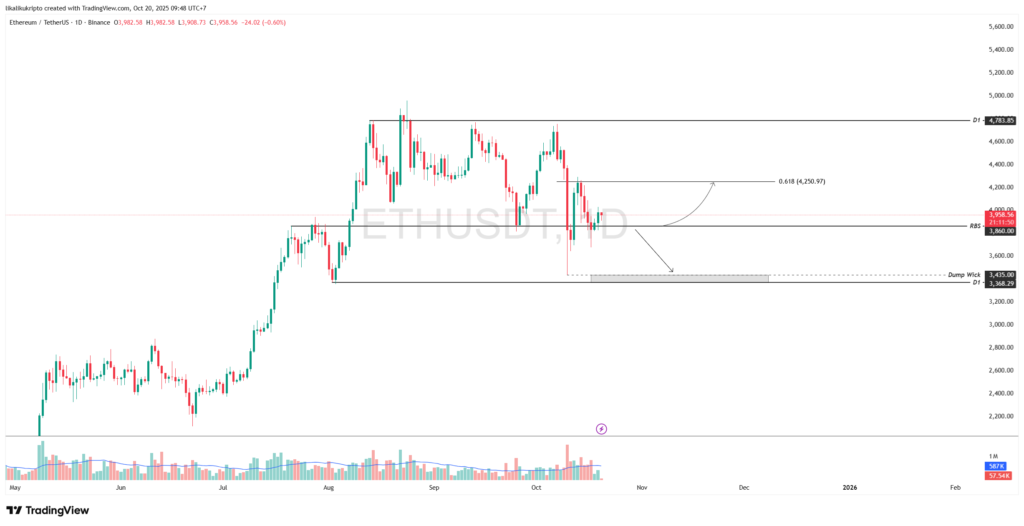
On the daily chart, the ETH price showed strength by moving back above the $3,860 level. This level is a significant Resistance Become Support (RBS) area, where the previous resistance has now potentially turned into a new support foundation. Successfully holding above this zone is critical to maintaining positive market sentiment.
Bullish Scenario
If ETH is able to consolidate and consistently maintain prices above the $3,860 support, this would be a confirmation of the validity of the RBS level. This scenario could trigger a continuation of the uptrend with the nearest resistance target being the $4,250 level, which coincides with the 0.618 Fibonacci retracement level, an area that has historically been a frequent target for price reversals.
Bearish Scenario
However, market participants need to be wary if the ETH price fails to hold and slips below the $3,860 level again. A downward break of this level would invalidate the RBS scenario and signal that buyers lack momentum, opening the door for a deeper correction. The next downside target is towards the next support zone between $3,368 – $3,435, which is the liquidity area from the previous sharp drop.
Conclusion
Ethereum’s price movement in the short term depends heavily on the $3,860 pivot level. The ability to establish it as strong support will pave the way towards the $4,250 target. Conversely, failure to hold will indicate the potential for further weakness towards the support area around $3,400.
SOL Technical Analysis
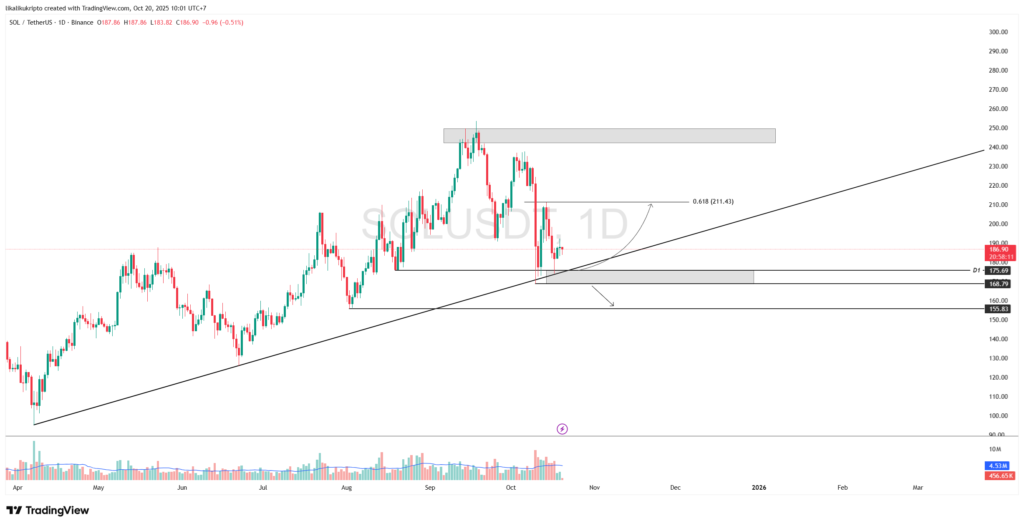
Solana (SOL) price is currently at a very important technical crossroads. After retesting its uptrend line, SOL found strong support at a key demand zone. The price reaction from this level will most likely determine the trend direction for the short to medium term.
On the daily chart, SOL’s price movement shows that its long-term uptrend line has been successfully tested twice, on October 10 and 17, signaling its relevance as dynamic support.
The price’s downward momentum was significantly halted when it entered the support cluster between $168.79 – $175.69. This area, which is a combination of horizontal support and the uptrend line, proved to be a solid defense zone. Strong buying pressure in this area managed to trigger an upward price reversal.
Bullish Scenario
As long as the price is able to hold and move above the $168.79 – $175.69 support cluster, the recovery outlook remains valid. If this buying momentum continues, the SOL rebound could potentially strengthen towards the next resistance target at $211.43, which coincides with the 0.618 Fibonacci retracement level.
Bearish Scenario
Conversely, a high alert is required if the price weakens again and breaks below this support cluster (with a daily close below $168.79). This breakout would invalidate the current uptrend structure and be a strong bearish signal. If this happens, the price could potentially experience a deeper drop towards the next support level at $155.83.
Conclusion
The $168.79 – $175.69 support zone is the pivot level to watch. SOL’s ability to hold above this zone will open up opportunities for a recovery rally towards $211.43. However, failure to hold this crucial level will indicate a potential trend shift towards bearishness with a downside target of $155.83.
On-Chain Activity Remains Solid
On-chain data still shows fundamental strength:
- Spot volumes and fund flows into crypto ETFs remain high.
- Entity-adjusted transfer volume increased, indicating active asset movement between wallets.
- Derivative liquidation picked up mid-week, fueling short-term volatility.
In general, capital flows still persist in large assets such as BTC and ETH, while altcoins experience more selective movements.
News from the Altcoin World
Ethereum Prepares for “Fusaka” Upgrade
Ethereum is heading for one of its major updates with the “Fusaka” upgrade, with the “Hoodi” testnet scheduled for late October.
The upgrade will improve efficiency at the execution and consensus layers and pave the way for deeper integration of layer-2 solutions.
This move could potentially be a positive catalyst for ETH prices ahead of the fourth quarter of 2025.
Monad Finally Releases Airdrop Checker
Monad, a highly anticipated L1 blockchain platform, has finally released an airdrop checker for MON assets. Users can check the allocation they will get through the portal https://claim.monad.xyz/. Users have a long time to claim MON until November 3.
Monad provides MON airdrop allocations for various crypto users, not just community members and Monad developers. DEX traders on Solana, owners of large NFT projects, and users of lending protocols on Ethereum get allocated MON assets.
Crypto Asset Performance in the Last Week
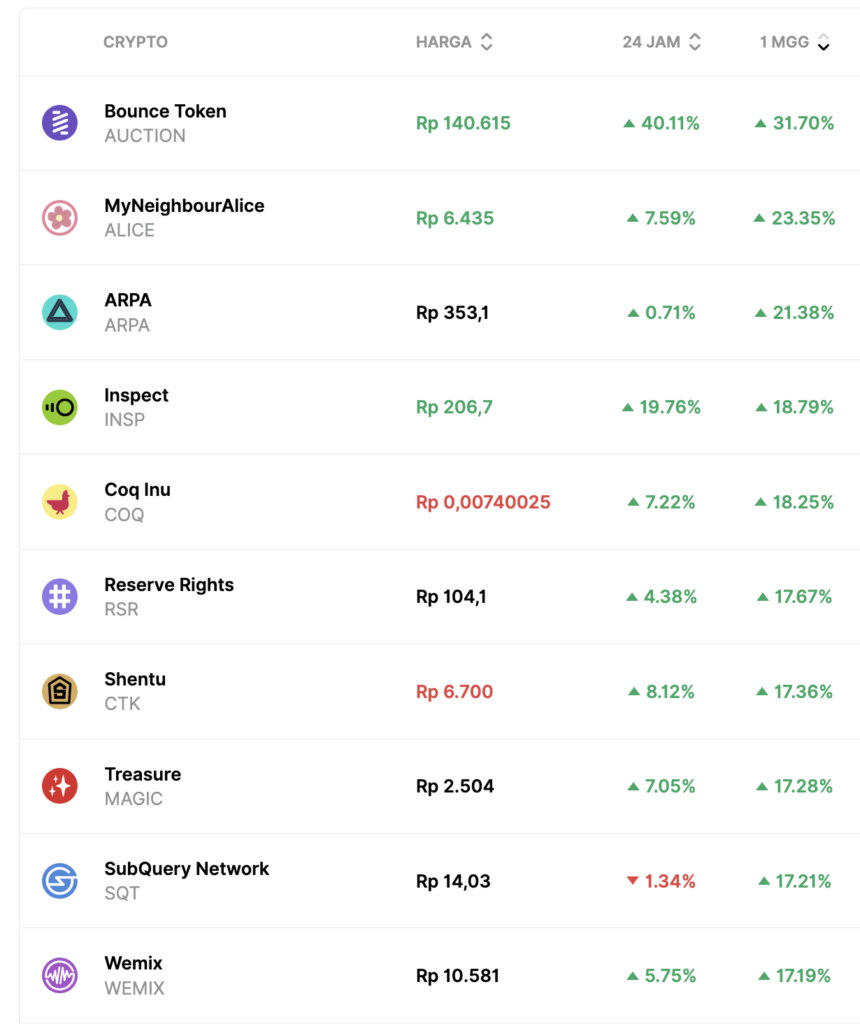
Top Performing Crypto Assets
- Bounce (AUCTION) + 33.6%
- MyNeighborAlice (ALICE) +22.75%
- Arpa (ARPA) +21.4%
- SubQuery Network (SQT) +16.92%
Worst Performing Crypto Assets
- Aethir (ATH) -34.8%
- Avantis (AVNT) -24.2%
- Radiant Capital (RDNT) -23.7%
- Launchcoin on Believe (LAUNCHCOIN) -23.2%