Signal Trading Summary:
- XRP (XRP)
- Entry (Buy/Long): $2.1146
- Stop Loss [SL]: $2.0314
- Take Profit [TP]:
- TP1: $2.1978 – $2.2505
- TP2: $2.2853 – $2.3379
- Optimism (OP)
- Entry (Buy/Long): $0.3477
- Stop Loss [SL]: $0.3310
- Take Profit [TP]:
- TP1: $0.3631
- TP2: $0.3815 – $0.3870
- Golem (GLM)
- Entry (Sell/Short): $0.32820
- Stop Loss [SL] : $0.35733
- Take Profit [TP] :
- TP1: $0.29938
- TP2: $0.27678 – $0.26994
1. XRP (XRP)
The selling pressure on XRP successfully subsided after the price touched the harmonic support that coincides with the full Fibonacci retracement area in the range of $2.0422 – $2.1137. This area triggered significant buying, prompting a reversal from a downtrend to an uptrend in the short term.
Technically, the XRP rebound rate is expected to retest the full retracement area as a form of confirmation of the strength of support before continuing the gradual increase. As long as the area is able to survive, the price movement structure remains constructive to continue the uptrend.
The next upside target is at $2.2505, with the primary target in the range of $2.3379-$2.3842 acting as major resistance.
Notes: Make sure there is a clear bounce with confirmation of a bullish candle (such as bullish engulfing) supported by increased volume, to minimize the risk of false signals.
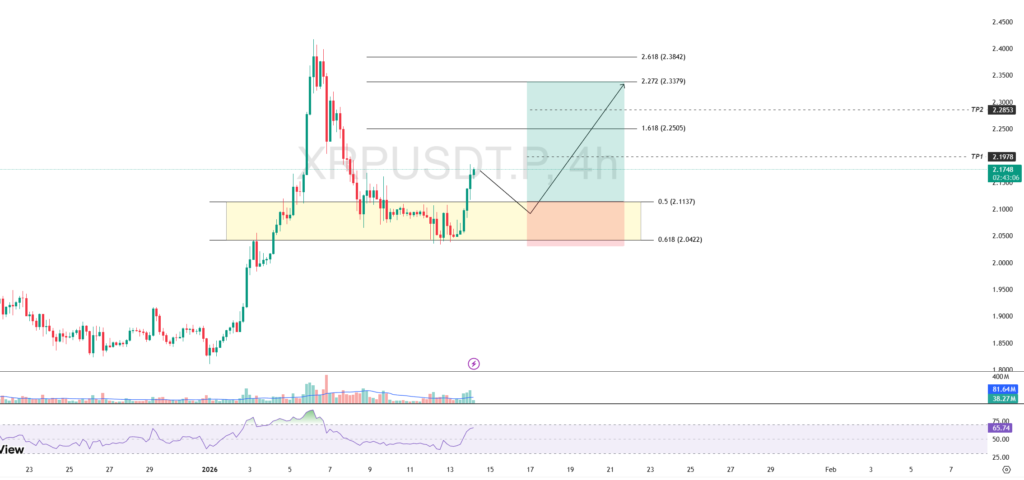
XRP Buy/Long Potential Setup:
Entry: $2.1146
Stop Loss [SL]: $2.0314
Take Profit [TP]:
- TP1: $2.1978 – $2.2505
- TP2: $2.2853 – $2.3379
2. Optimism (OP)
The price movement of Optimism (OP) managed to record a breakout from the $0.3339-$0.3432 area, which has now turned into the nearest support zone. This breakout confirms a change in the price structure in a more constructive direction in the short term.
However, on the 4-hour timeframe, the RSI indicator has been in the overbought area and is accompanied by the formation of a bearish divergence. This combination is a cautionary signal, as it could potentially trigger a short-term correction before the uptrend resumes.
Technically, OP has the opportunity to retest to the nearest support zone if the price drops and moves below the $0.3631 level. The price reaction at the support area will be the main reference to determine the direction of the next movement as well as a more measured entry opportunity.
Notes: Make sure there is a clear bounce with confirmation of a bullish candle (such as bullish engulfing) supported by increased volume, to minimize the risk of false signals.

Potential Buy/Long OP Setup:
Entry: $0.3477
Stop Loss [SL]: $0.3310
Take Profit [TP]:
- TP1: $0.3631,
- TP2: $0.3815 – $0.3870
3. Golem (GLM)
Golem’s (GLM) bullish run experienced significant rejection after the price touched the resistance area at $0.35300, which was the highest price at the close of the July 27 daily candle. This rejection marks the weakening of buying pressure in that area.
In price action, the formation of a long upper wick in the resistance area indicated a liquidity grab, which was later confirmed by two consecutive red candles. This pattern reflects increasing selling pressure and is a negative sentiment for market participants in the short term.
As long as the price of GLM still moves below the resistance area, the potential for continued correction remains open with a downward target towards the support area at $0.27678 as the main target.
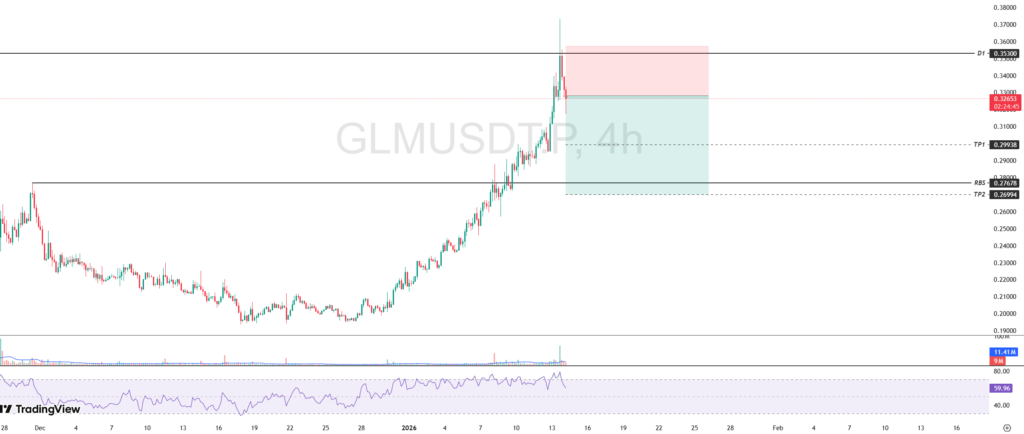
Potential Sell/Short Setup:
Entry: $0.32820
Stop Loss [SL]: $0.35733
Take Profit [TP]:
- TP1: $0.29938,
- TP2: $0.27678 – $0.26994
Important Notes:
Always apply risk management and capital management with discipline. For trading, especially those using leverage, we recommend using a risk per transaction of: 1% of total capital.
*Disclaimer: Pintu Futures activities (trading futures contracts on crypto assets) are carried out by PT Pintu Kemana Saja (Digital Financial Asset Trader), a Futures Brokerage company licensed and supervised by Bappebti and a member of CFX and KKI. Trading futures contracts on crypto assets me