
Signal Trading Summary:
1. Storj (STORJ)
- Entry : IDR 2.301 ($0.1372)
- Cut Loss (CL) : IDR 1.798 ($0.1072)
- Take Profit [TP] :
- TP1 = IDR 2.816 – IDR 2.962 ($0.1679 – $0.1766)
- TP2 = IDR 3.388 ($0.2020)
2. GMT (GMT)
- Entry: IDR 262 ($0.01562)
- Cut Loss (CL): IDR 214 ($0.01279)
- Take Profit [TP]:
- TP1 = IDR 309 – IDR 331 ($0.01844 – $0.01974)
- TP2 = IDR 361 – IDR 399 ($0.02153 – $0.02381)
3. Plasma (XPL)
- Entry: IDR 2,603 ($0.1552)
- Cut Loss (CL): IDR 2.134 ($0.1272)
- Take Profit [TP]:
- TP1 = IDR 3,109 – IDR 3,426 ($0.1853 – $0.2042)
- TP2 = IDR 3,832 ($0.2284)
1. Storj (STORJ)
STORJ managed to catch the market’s attention after the December 27 daily candle closed with a significant gain of 38.78%, signaling a short-term surge in buying momentum. However, after reaching the IDR 2,962 ($0.1766) level, the price went through a natural correction phase in response to profit-taking.
Currently, the price movement is seen pulling back to the support area in the range of IDR 2,296 ($0.1369). This area acts as a crucial zone to determine the continuation of the trend. If the December 29 daily candle closure is able to close bullish, then it can be an initial confirmation to continue the upward scenario.
As long as the price is able to stay above the support area, the potential for a rebound remains open with the target of a gradual increase towards the previous resistance area.
Notes: Make sure there is a clear bounce with confirmation of a bullish candle (such as bullish engulfing) supported by increased volume, to minimize the risk of false signals.
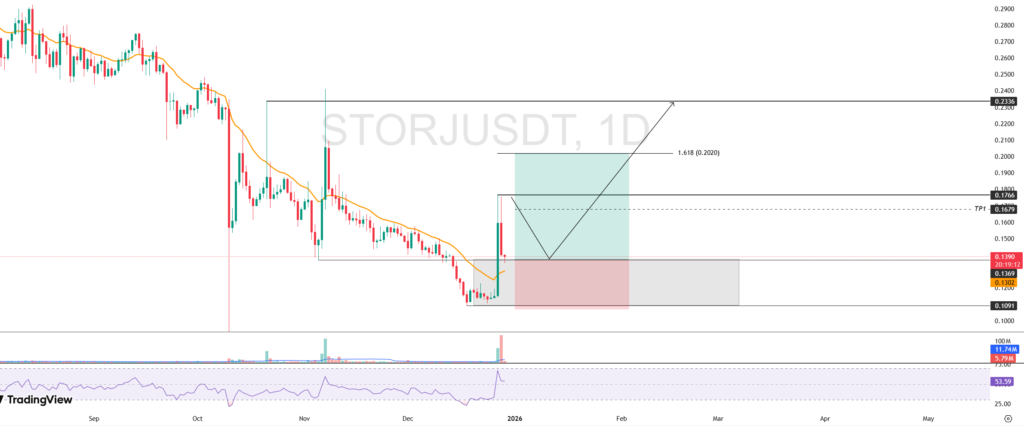
STORJ Potential Buy Setup:
Entry: IDR 2,301 ($0.1372)
Cut Loss (CL): IDR 1.798 ($0.1072)
Take Profit [TP]:
- TP1 = IDR 2,816 – IDR 2,962 ($0.1679 – $0.1766)
- TP2 = IDR 3,388 ($0.2020)
2. GMT (GMT)
GMT showed positive initial technical signals after the formation of a bullish engulfing pattern at the close of the daily candle this morning. This pattern indicates a potential reversal from selling pressure to buying pressure, as well as the potential to become an initial trigger that attracts the attention of market participants.
However, market participants are advised to remain conservative, given that the momentum indicator still detects bearish divergence, which indicates the potential for further weakness or a short-term correction phase before prices resume rising.
The ideal scenario for the continuation of the bullish trend is if the GMT price pulls back and retests the support area around IDR 2,531 ($0.1509), followed by a bounce accompanied by a valid bullish candle confirmation. This condition can be an entry opportunity with a more measured risk ratio.
Technically, the high area of the November 27 daily candle close at the level of IDR 331 ($0.01974) is the nearest upside target, as well as an important resistance area to watch.
Notes: If the price drops close to the support area, make sure there is a clear bounce with confirmation of a bullish candle (such as bullish engulfing) supported by increased volume, to minimize the risk of false signals.
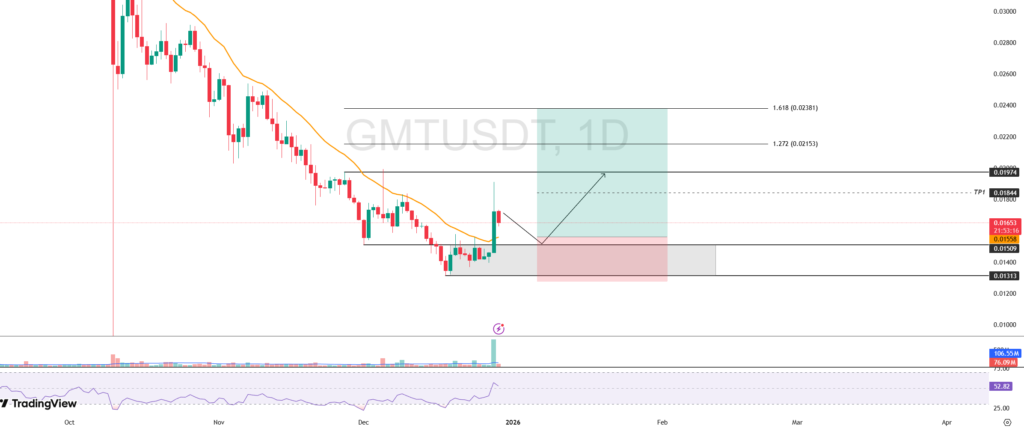
GMT Potential Buy Setup:
Entry: IDR 262 ($0.01562)
Cut Loss (CL): IDR 214 ($0.01279)
Take Profit [TP]:
- TP1 = IDR 309 – IDR 331 ($0.01844 – $0.01974)
- TP2 = IDR 361 – IDR 399 ($0.02153 – $0.02381)
3. Plasma (XPL)
Plasma (XPL) managed to record a breakout from the consolidation phase in the area of IDR 1,932 – IDR 2,327 ($0.1152 – $0.1387). This breakout is a positive technical signal, especially since it was followed by price movement back above the 20-Day EMA, signaling a change in momentum to a bullish direction.
Technically, the price movement structure shows the potential for a continuation of the uptrend, with the nearest upside target being the area of IDR 3,109 – IDR 3,426 ($0.1853 – $0.2042) as the next minor resistance.
If the buying momentum is maintained, then the high on November 28 at IDR 3,832 ($0.2284) is potentially the main target as well as the major resistance to watch.
This bullish scenario remains valid as long as the price is able to stay above the previous breakout area. Weakness that breaks back below the zone could potentially trigger a further correction.
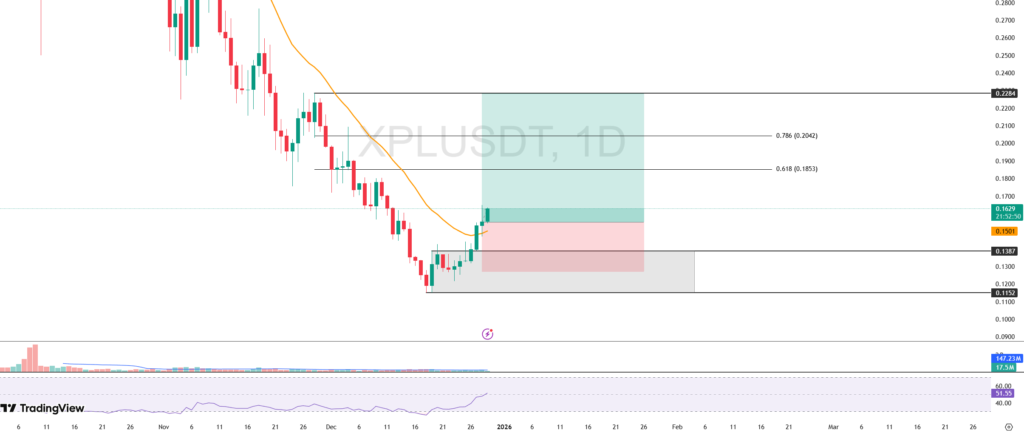
XPL Potential Buy Setup:
Entry: IDR 2,603 ($0.1552)
Cut Loss (CL): IDR 2.134 ($0.1272)
Take Profit [TP]:
- TP1 = IDR 3,109 – IDR 3,426 ($0.1853 – $0.2042)
- TP2 = IDR 3,832 ($0.2284)
Important Notes:
Always apply risk management and capital management with discipline. For trading, especially leveraged trading, it’s best to use a risk per transaction of: 1% of total capital