Bearish engulfing is an indicator that traders can utilize to avoid losses. The appearance of bearish engulfing is an early sign that the asset price will experience a reversal from bullish to bearish. At the same time, the appearance of bearish engulfing can also be an entry point for traders who want to open short positions. What is a bearish engulfing? How do you identify and use it? Find out more in the following article.
Article Summary
- 📉 Bearish engulfing is a candlestick pattern that signals a trend reversal from bullish to bearish.
- 📊 Bearish engulfing is formed when a bearish candle (red) has a larger body size than the previous bullish candle (green) with a small body.
- 🔍 The larger the body of the bearish candle, the higher the trading volume, and the stronger the previous uptrend, the more reliable the signal from the bearish engulfing.
- 💡 For traders with a long position, the appearance of a bearish engulfing can be a signal to exit the position. Its appearance can be an ideal entry point for traders who want to open short positions.
What is Bearish Engulfing?
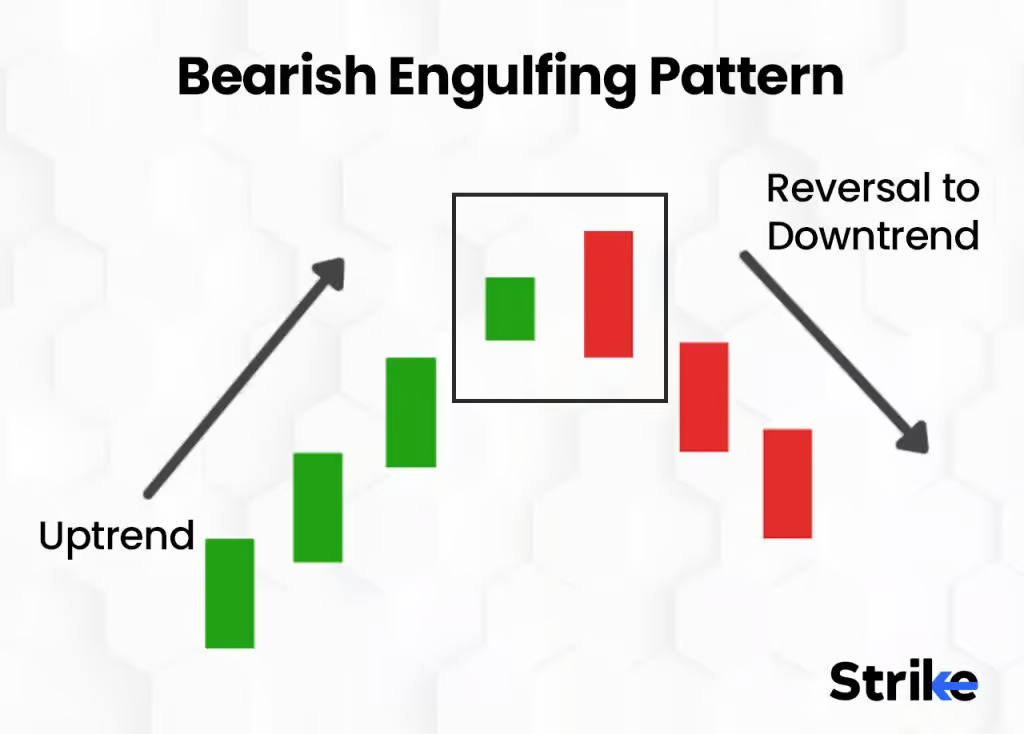
Bearish engulfing is a candlestick pattern that consists of two candlesticks. The first candle is green, followed by a larger red candle. It looks like the second candle engulfs the first, hence the name engulfing.
The bearish engulfing pattern is categorized as a bearish reversal pattern. Generally, it forms at the peak of an uptrend movement. Therefore, this pattern can only appear when the asset price is in a definite upward trend.
This pattern appears when the market is dominated by buying, but suddenly, significant selling pressure forces the price to decline. This condition eventually makes the second candle red and closes at a lower price than the previous candle.
The appearance of the second candle signals a potential change in sentiment, and a trend change from bullish to bearish is very likely.
The bearish engulfing shows that the sellers have dominated the buyers. Their presence even pushed the price down aggressively (big red candle) compared to the buyers' ability to push the price up (green candle).
The double top is another chart pattern that signals a bearish reversal. Learn how to use it here.
Bearish Engulfing Characteristics
To identify a bearish engulfing pattern, here are some characteristics of a bearish engulfing.
- 📈 Uptrend. The price is in an ongoing upward trend
- 🟢 The first candlestick should be bullish (green) and tend to be small. If the green candlestick is small, it indicates that buyers are still dominating the market, although their dominance is gradually starting to subside.
- 🔴 The second candle should be bearish (red) and larger than the first. If the red candlestick is large, it shows that sellers have taken over the market. The bigger the candlestick, the greater the sellers and the potential price drop.
- 🆙 Change in overall Market Sentiment. Trading volume can give an idea of market sentiment through the number and pressure of transactions. The bearish engulfing signal is more reliable in high volume on the bearish candle.
Psychologically, the bearish engulfing pattern shows the tug-of-war between optimism and pessimism, as well as trust and fear. Its appearance is an important marker when there is a change in dominance from buyers to sellers, and a downward trend begins.
The appearance of the bearish engulfing pattern is a sign of an influx of “fear” “in the” market. For traders who have already opened a position, the appearance of bearish engulfing can trigger them to sell part of their position or even exit completely. Meanwhile, traders about to open a short position will see it as a sign to enter.
When confirmed, owners of long positions will immediately exit, and at the same time, short positions will begin to open. This will increase the selling pressure so that the correction trend will strengthen and continue. At this point, a bearish reversal has occurred.
Trading Strategy Using Bearish Engulfing
Jika kamu inign membuka posisi short, maka cara terbaik adalah dengan melakukan perpetual trading. Pelajari caranya melalui artikel berikut.
If you want to trade using bearish engulfing, make sure to do the following to get a more accurate signal:
- The uptrend must have a solid and significant trend for the bearish engulfing to be effective.
- The higher the opening price and the lower the closing price of the second (bearish) candle, the stronger the signal.
- To get stronger signals, use daily candles where each candle represents the daily price change.
- High trading volume on the second candle indicates the potential for a more substantial correction trend.
Apart from sticking to the bearish engulfing pattern, traders can combine it with other indicators to get more reliable signals. Generally, bearish engulfing will get a stronger signal when the closing price of the second (bearish) candle crosses the support on the asset’s trendline.
If a bearish engulfing pattern appears, traders with long positions can start closing their positions. However, if they are still in doubt, the appearance of the pattern can be responded to by tightening the stop-loss level. Meanwhile, for traders who want to place short positions, the appearance of bearish engulfing can signal to open a position.
Remember to place a stop-loss above the second (bearish) candle wick if you open a short position. The choice of this point is based on the reason that bearish engulfing patterns are often used as markers of resistance areas. As a result, if the trend reversal turns out to be a failure, traders have already put safety at the stop-loss level.
If you want to open a short position, the best way is to do perpetual trading. Learn how in the following article.
Bearish Engulfing Example
The following is an example of the appearance of a bearish engulfing pattern on the ETH/IDR daily chart:
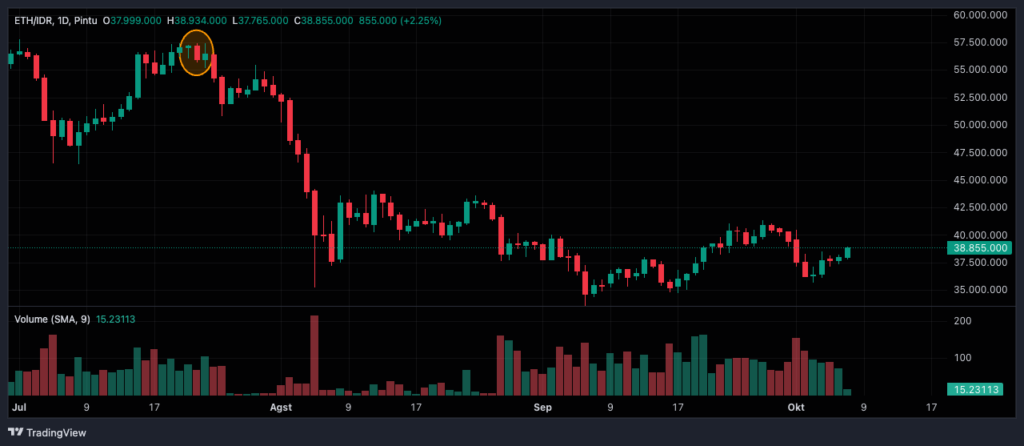
In the chart above, you can see that the bearish engulfing appeared after several small bullish candles. This indicates that the buying momentum of ETH/IDR is starting to subside. The bearish candle also fulfills the characteristics of bearish engulfing: it has a higher opening price, and its body engulfs the previous bullish candle.
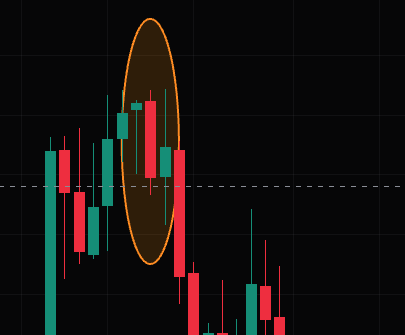
After the appearance of the bearish engulfing, it can be seen that the price of ETH/IDR experienced a sharp correction. For long traders, the bearish engulfing can be used to take profit or immediately exit the position to avoid more significant losses. Meanwhile, the bearish engulfing area can be an optimal entry point for those who want to go short.
Bearish Engulfing Limitations
Like any other chart pattern, the bearish engulfing pattern is not 100% reliable, as it could be a false signal. In addition, bearish engulfing is a signal that falls into the lagging indicator category. It will only form when a price change has occurred, so the signal tends to be late.
In addition, bearish engulfing also requires additional indicators for confirmation. This can cause traders to lose momentum because they must wait for confirmation.
The reliability of the bearish engulfing also depends on market conditions. In a prolonged uptrend, its occurrence is reliable. However, its reliability drops considerably when the market is in a sideways or short-term trend.
The bearish engulfing signal becomes much more reliable when used on long-term timeframes such as daily or weekly. On shorter timeframes, such as 1 hour, it becomes less effective. Its signals can be affected by more volatile short-term movements or noises.
Bearish engulfing is an effective indicator to use for position trading. Want to know what position trading is?
Conclusion
Bearish engulfing is a candlestick pattern that signals a trend reversal from bullish to bearish. It forms at the end of an uptrend when the bearish candle (red) has a larger body size than the bullish candle (green). As the body of the bearish candle gets bigger, it looks like it is engulfing the bullish candle, hence the name engulfing it.
The accuracy level of bearish engulfing will be stronger when the bearish candle has an opening price that gets higher and lower. Also, the longer the timeframe used and the larger the trading volume on the second candle, the stronger the signal. The appearance of bearish engulfing can be a sign to exit long positions completely. Meanwhile, it can be an ideal entry point for those who want to open short positions.
Buy Crypto Assets on Pintu
Looking to invest in crypto assets? No worries, you can safely and conveniently purchase a wide range of cryptocurrencies such as BTC, ETH, SOL, and others safely and easily at Pintu. Pintu diligently evaluates all its crypto assets, highlighting the significance of being cautious.
Pintu is also compatible with popular wallets such as Metamask to facilitate your transactions. Download Pintu app on Play Store and App Store! Your security is guaranteed because Pintu is regulated and supervised by Bappebti and Kominfo.
Aside from buying and trading crypto assets, you can expand your knowledge about cryptocurrencies through various Pintu Academy articles. Updated weekly, all Pintu Academy articles are made for knowledge and educational purposes, not as financial advice.
References
- Cedric Thompson, Bearish Engulfing Pattern: Definition and Example of How To Use, Investopedia, accessed on 4 October 2024.
- Baby Pips, Bearish Engulfing Pattern, Forexpedia, accessed on 4 October 2024.
- Arjun Remest, Bearish Engulfing Candlestick: Definition, How to Use in Trading, and Examples, Strike Money, accessed on 4 October 2024.