Traders often look for technical patterns that signal potential reversals in market trends. One such pattern, the double bottom, can indicate a transition from a downtrend to an uptrend. By understanding the characteristics and formation of a double bottom, traders can make informed decisions about entry and exit points.
Article Summary
- 📈 Double bottom is a pattern that indicates a reversal signal from bearish to bullish.
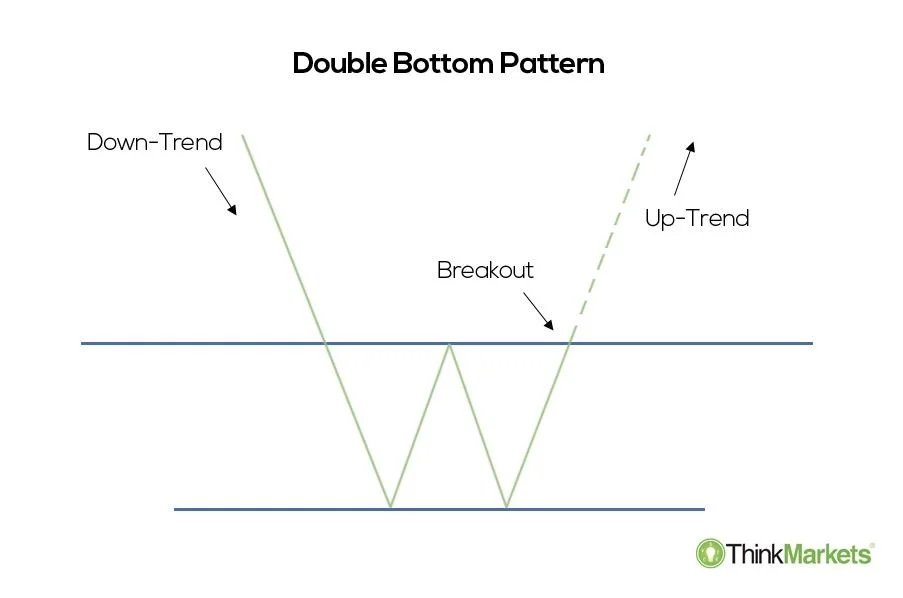
- 👁️ Double bottom is formed when the price reaches two lows, separated by a moderate rebound that creates a neckline as a resistance level.
- 🔍 The double bottom pattern is confirmed when the price rebounds from the second low and breaks the neckline.
- 💡 Traders can utilize the second bottom as an ideal entry area. While the neckline point can be used as a profit-taking area. If the price continues to rise, traders can hold their positions longer to earn higher profits.
What is a Double Bottom Pattern?
A double bottom pattern signals a potential reversal from a downtrend to an uptrend. As the name implies, it consists of two successive low points in a price chart, separated by a moderate rebound. Once the second low is reached, the price will likely experience a more significant rebound, potentially initiating a new uptrend.
Visually, a double bottom resembles the letter ‘W.’ This pattern indicates that the price is attempting to recover after a bearish rally. The two low points are considered strong support levels.

If these two low levels hold, there is potential for a significant upward movement. A double bottom is confirmed when the asset’s price breaks above the neckline, acting as a resistance level.
The double bottom pattern is the opposite of the double top pattern. In another article, Pintu Academy has discussed the details of the double top pattern. Learn about the pattern here.
Double bottom patterns can be found on various timeframes. A double bottom may signal a temporary pause in a downtrend on an hourly timeframe. Meanwhile, on a daily timeframe, it can indicate a long-term trend reversal.”
Key Elements for Identifying a Double Bottom
Several elements can help identify a double bottom pattern:
- Downtrend. Before a double bottom pattern is formed, the asset price must be in a downtrend. The series of lower highs and lower lows can characterize this.
- Two Bottom. Two bottoms, approximately at the same price level, must be formed. These bottom served as key support levels where the price stalls and rebounds.
- Rebound. There should be a rebound between the two bottoms, which shows that the bearish trend will not continue.
- Neckline. The neckline is a vertical line drawn from the highest point at which the price retrace. It acts as a resistance point and a confirmation area for forming a double bottom pattern.
- Breakout from Neckline. The key will be at the neckline when the price rebounds after the second bottom is touched. If the rebound successfully crosses the resistance (neckline), then the breakout signals that a reversal will occur. This also confirms the formation of a double bottom pattern.
Double Bottom Pattern Example
The Solana daily chart below showcases a classic example of a double bottom pattern. On June 6, 2024, SOL initiated a downtrend. After reaching a peak of IDR 2,868,000, SOL consistently declined.

The downward trend stopped on June 24, 2024, when SOL touched the IDR 2,040,000 level. This point marked the first bottom and was a support level for SOL. Following this support, SOL rebounded to reach IDR 2,552,000.
After reaching this point, SOL lost momentum, making IDR 2,552,000 a resistance level (or neckline). The subsequent downward price movement drove SOL to IDR 2,003,000, forming a new support level and the second bottom.
Following the second bottom, SOL rebounded again. However, this time, it managed to break through the neckline. With this successful breakout, the double bottom pattern was confirmed. SOL entered a new uptrend phase and reached a new high of IDR 3,150,000.
Calculating from the neckline, SOL experienced a price increase of 23.43% during the uptrend phase. When calculated from the second bottom, SOL gained a significant 57.25%. These price actions demonstrate how the double bottom pattern can signal a reversal from a bearish to a bullish trend.
Pros and Cons of the Double Bottom Pattern
One advantage of the double bottom pattern is that it identifies support and resistance levels through the bottom points and the neckline. This simplifies the process for traders to determine optimal entry and exit points.
However, like other technical indicators, the double bottom pattern can produce false signals, especially in volatile markets. It can be challenging to accurately pinpoint the bottom, particularly during a prolonged downtrend.
Therefore, traders should also evaluate fundamental factors and market sentiment to assess the likelihood of a trend reversal. Furthermore, using additional technical indicators can enhance the reliability of the signals.
Trading Strategy with Double Bottom Pattern
Several key factors must be considered when validating the bottom in a double bottom pattern. These include improvements in fundamental conditions, positive catalysts, and changes in market sentiment.
Additionally, trading volume should be closely monitored as the price approaches the bottom. A surge in trading volume signals that the price will likely initiate an uptrend, strengthening the double bottom pattern.
Traders often utilize the double bottom pattern as an entry point. Typically, traders enter when the asset’s price reaches the second bottom, anticipating a rebound and the start of a new uptrend.
However, to mitigate risk, traders will place a stop-loss order below the support level (the bottom). This ensures that the trader can limit their losses if the price falls.
Another strategy for using a double bottom pattern is to set a take-profit order at the neckline. However, once the neckline is breached and the double bottom is confirmed, traders may hold the asset for a more extended period, anticipating a sustained uptrend.
Conclusion
A double bottom is a chart pattern that signals a potential reversal from a downtrend to an uptrend. It is characterized by a ‘W’ shape, where the asset’s price is in a correction phase, reaches the bottom, and rebounds. However, this rebound is short-lived as the price corrects again, turning the previous bottom into resistance. The double bottom pattern is confirmed if the price fails to break below this resistance and rebounds to create a second bottom.
The second bottom can be an ideal entry point for traders as the price is expected to rise. The neckline or resistance level can be used as a take-profit target. If the price breaks above the neckline, traders may hold their positions longer to capture additional gains.
Like any other technical indicator, the double bottom pattern is not foolproof and can produce false signals. Using a stop-loss order below the second bottom is recommended to mitigate risk. Combining the double bottom pattern with other technical indicators and fundamental analysis can provide a more reliable trading signal.
How to Buy Crypto on Pintu
Looking to invest in crypto assets? No worries, you can safely and conveniently purchase a wide range of cryptocurrencies such as BTC, ETH, SOL, and others safely and easily at Pintu. Pintu diligently evaluates all its crypto assets, highlighting the significance of being cautious.
Pintu is also compatible with popular wallets such as Metamask to facilitate your transactions. Download Pintu app on Play Store and App Store! Your security is guaranteed because Pintu is regulated and supervised by Bappebti and Kominfo.
Aside from buying and trading crypto assets, you can expand your knowledge about cryptocurrencies through various Pintu Academy articles. Updated weekly, all Pintu Academy articles are made for knowledge and educational purposes, not as financial advice.
References
- James Chen, What are Double Bottom Patterns? Investopedia, accessed on 10 September 2024.
- ThinkMarkets, The Double Bottom Patterns, accessed on 10 September 2024.
